
EB Daily Market Report - Thursday, March 11, 2021
Executive Market Summary
- Futures were strong overnight and it's been full speed ahead for U.S. equities today
- The U.S. dollar (UUP) is down for a third consecutive day, but a key rising 20-day EMA test is coming
- The weak dollar is aiding both crude oil ($WTIC, +1.99%) and copper ($COPPER, +1.88%)
- The 10-year treasury yield ($TNX) is up slightly, rising 1 basis point to 1.53%
- Initial jobless claims came in below expectations this morning; another inflation report - PPI - is due out at 8:30am ET on Friday
- The three bullish amigos - technology (XLK, +2.55%), communication services (XLC, +2.26%), and consumer discretionary (XLY, +1.76%) are driving this broad rally
- All 11 sectors are higher on the day and growth is swamping value (IWF:IWD, +1.39%)
- Oracle (ORCL, - 7.40%) is not participating after releasing its latest quarterly earnings after the bell on Wednesday
Market Outlook
I've been watching the QQQ (ETF tracking the NASDAQ 100) across multiple time frames, so let's review each one:
Big Picture - weekly chart:
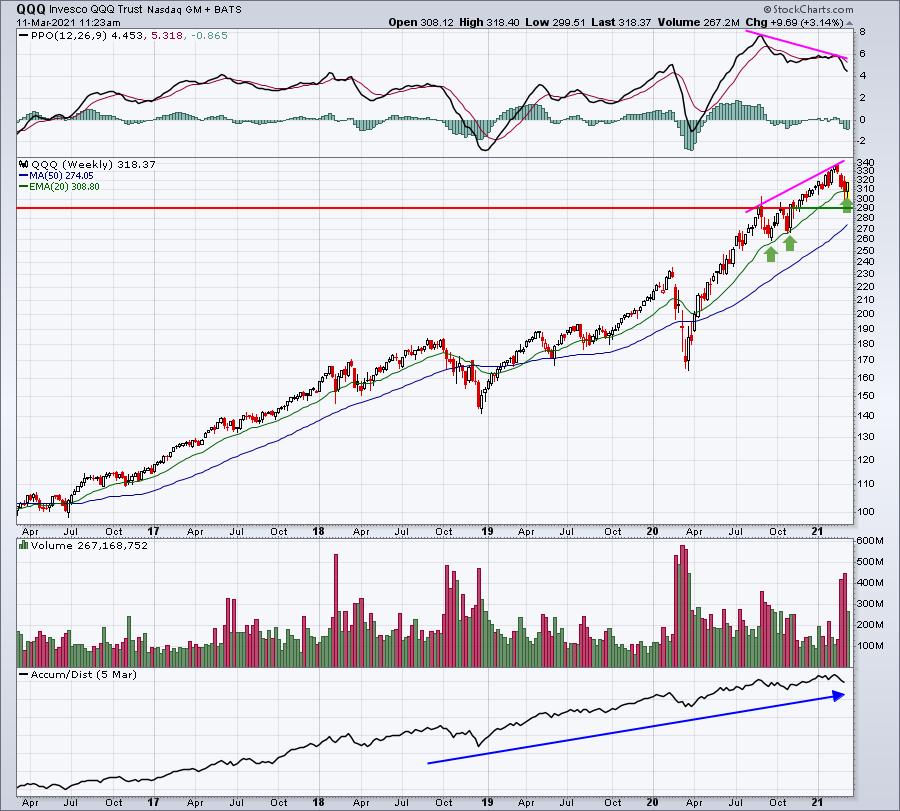
The most important takeaway here is that we have a massive uptrend on our hands, which is extremely bullish. The QQQ is now more than 130% higher since the low of the Q4 2018 trade war scare. The QQQ has now nearly doubled since the pandemic-induced low. That's now in our rear view mirror. Those who didn't believe in this secular bull market now must pay up to ride what I believe will be another 10-year bull market, with corrections and even a cyclical bear market or two along the way. Those will, of course, have the bears out in full force again.
Many will argue that volume on the downside was so much greater and that's a bearish sign. Ummmm, look at Q4 2018 and the pandemic in March 2020. Volume ALWAYS is greater during panicked lows. Few folks panic buy, but many will panic sell. Recoveries are nearly always on much lighter volume. Don't fall for that argument.
Intermediate-term - daily chart:
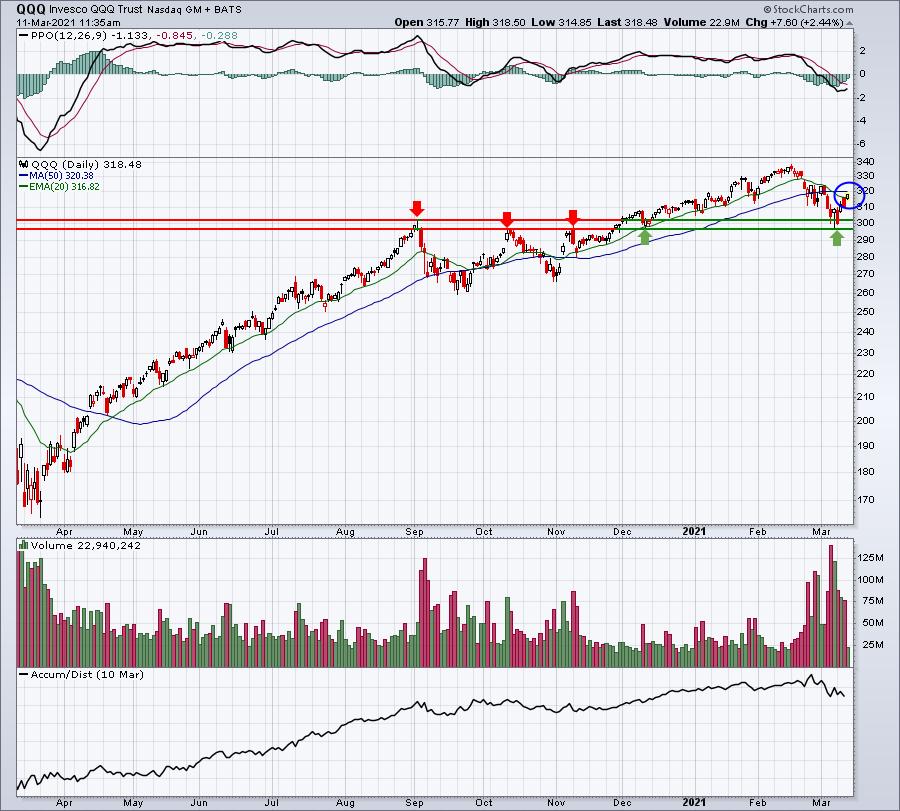
Remember the A-B-C correction that I wrote about recently? Well, it appears to have played out as the QQQ is now trying to climb back above its 20 day EMA (blue circle). Doing so would be the first step to repairing the short-term damage caused by the recent selling. Currently, this looks nothing more than a selloff to test a key intermediate-term price support level.
Short-term - hourly chart:
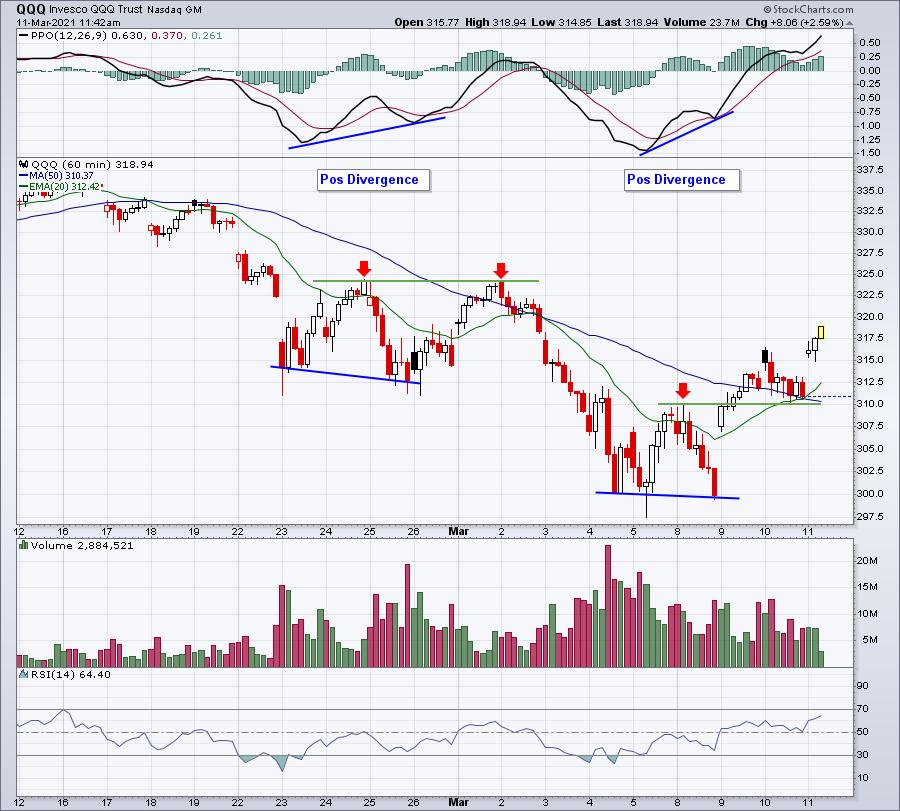
The reaction to this positive divergence already looks much better than the last one. If you look at the last positive divergence we could not later pierce the price resistance marked by the green horizontal line. We blew right through the price resistance marked by the high between the two recent lows near the 310.00 level. Not only did we break through, but we've now tested that prior resistance (now support) and broken out again. Also, note that yesterday's selling tested the now-rising 20 day EMA beautifully. If PPI has a scary headline number tomorrow and we see another short-term selloff, it'll likely create one more solid opportunity to jump into growth stocks.
Sector/Industry Focus
It's been a crazy, volatile market of late when we consider leadership, but today we're seeing the key secular bull market drivers back on center stage. Here's a quick snapshot:
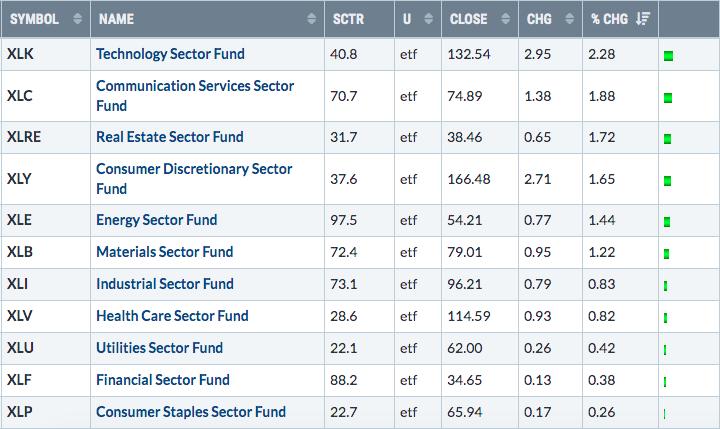
Granted, it's just one day and we have another big inflation report in the morning, so expect the unexpected. As I continue to state, I'm very comfortable with the big picture. But March can derail the market from time-to-time as we've just witnessed. My suggestion is to keep your eyes on the prize - a long-term secular bull market where we see WIDE participation and lots of excellent opportunities ahead.
ChartLists/Strategies
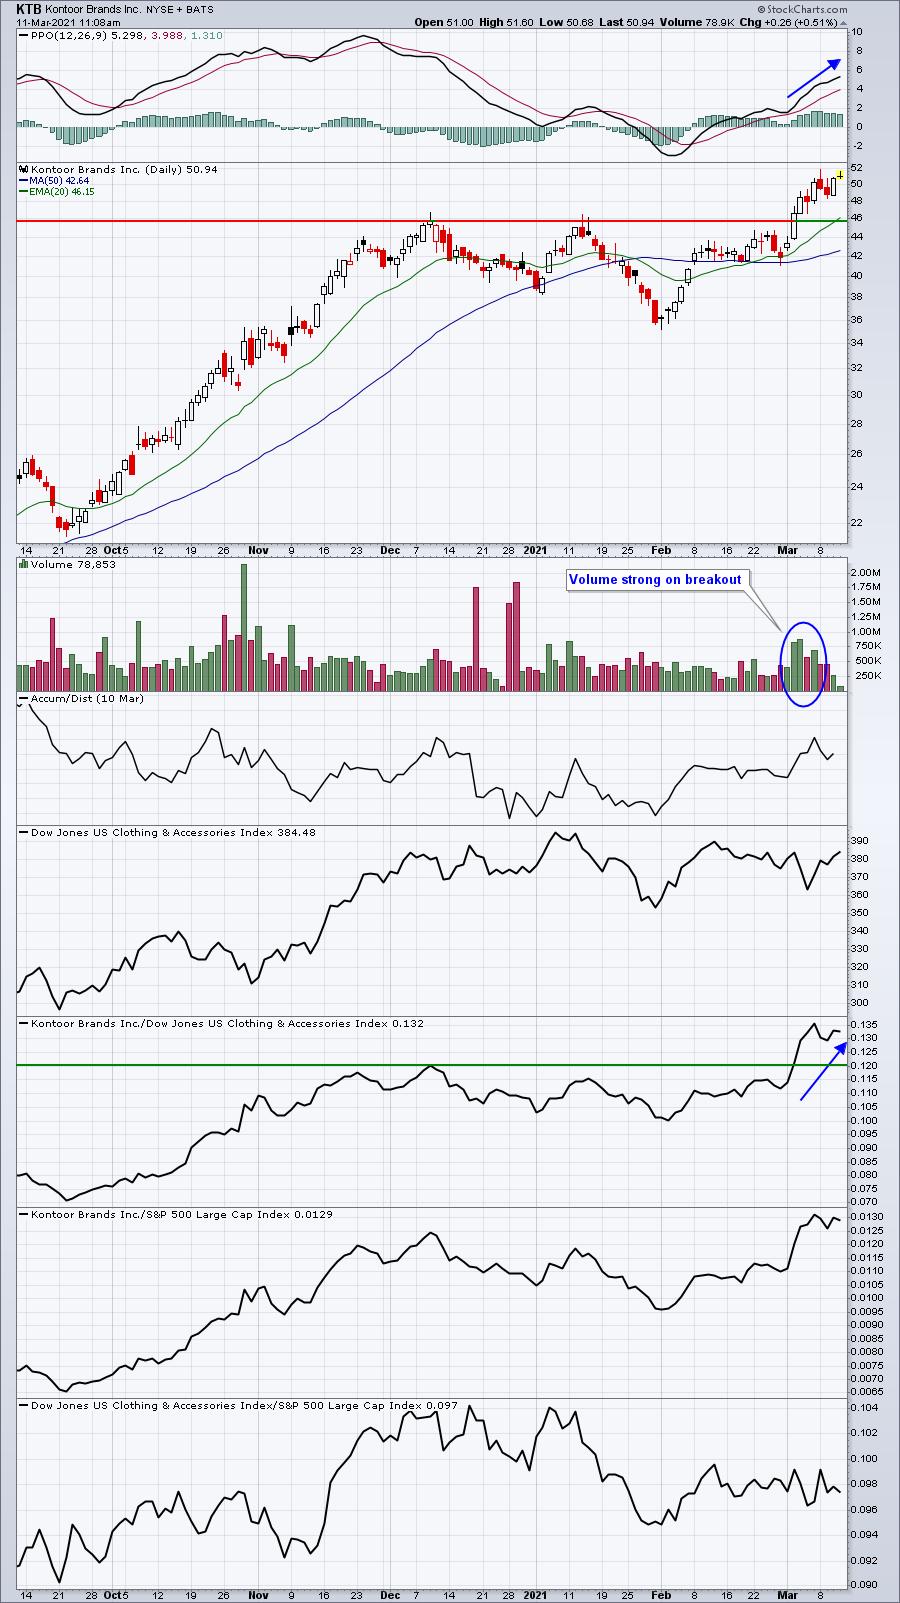
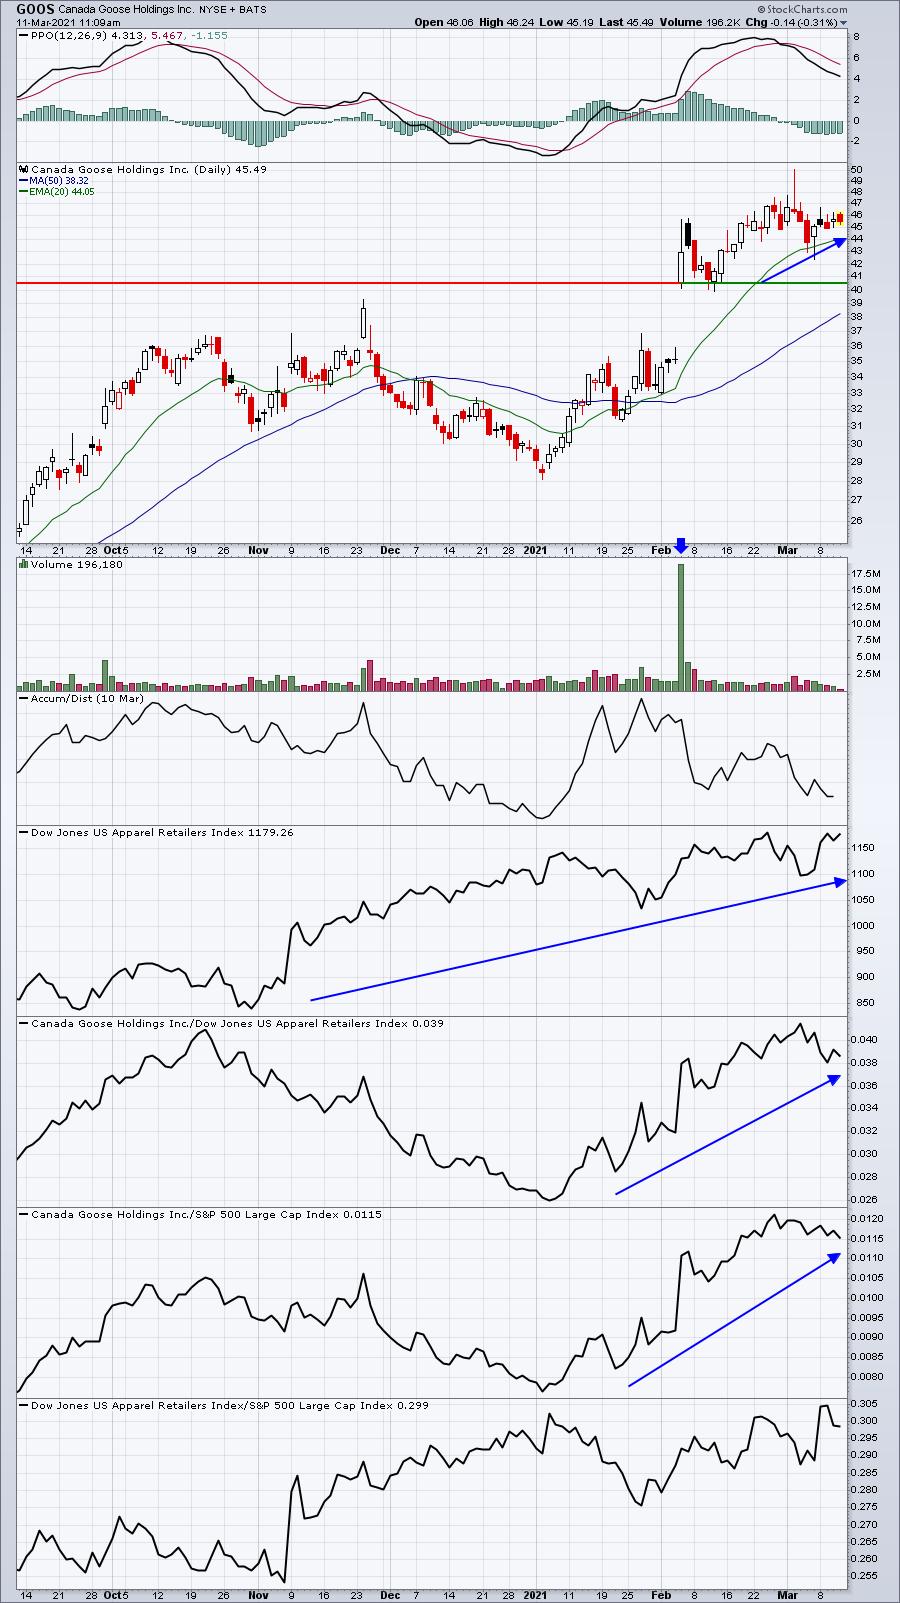
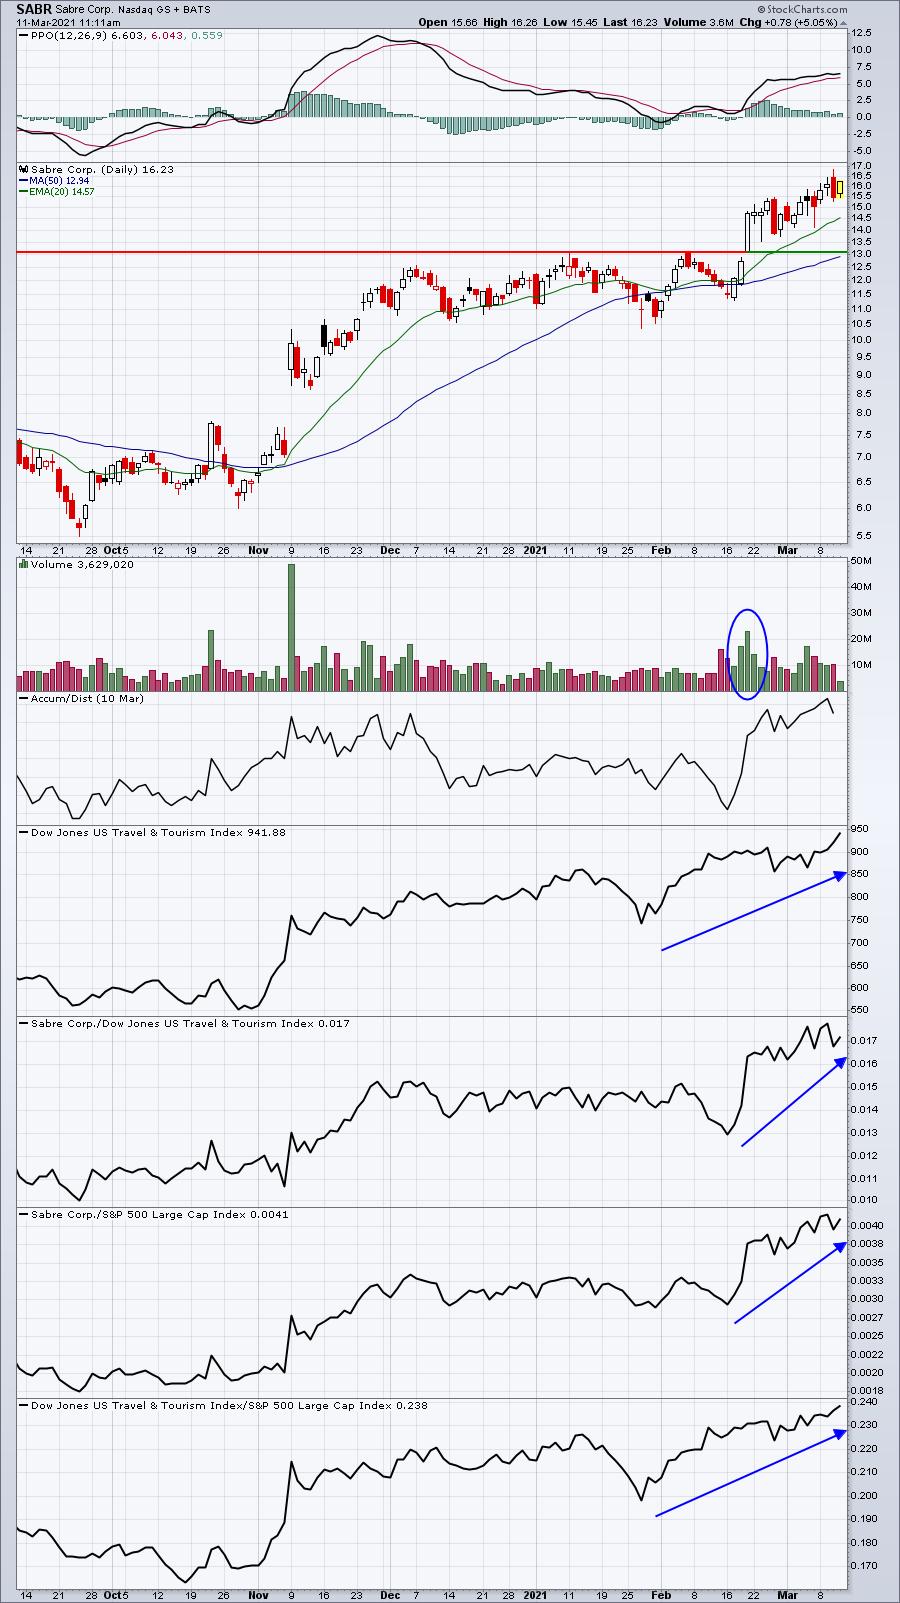
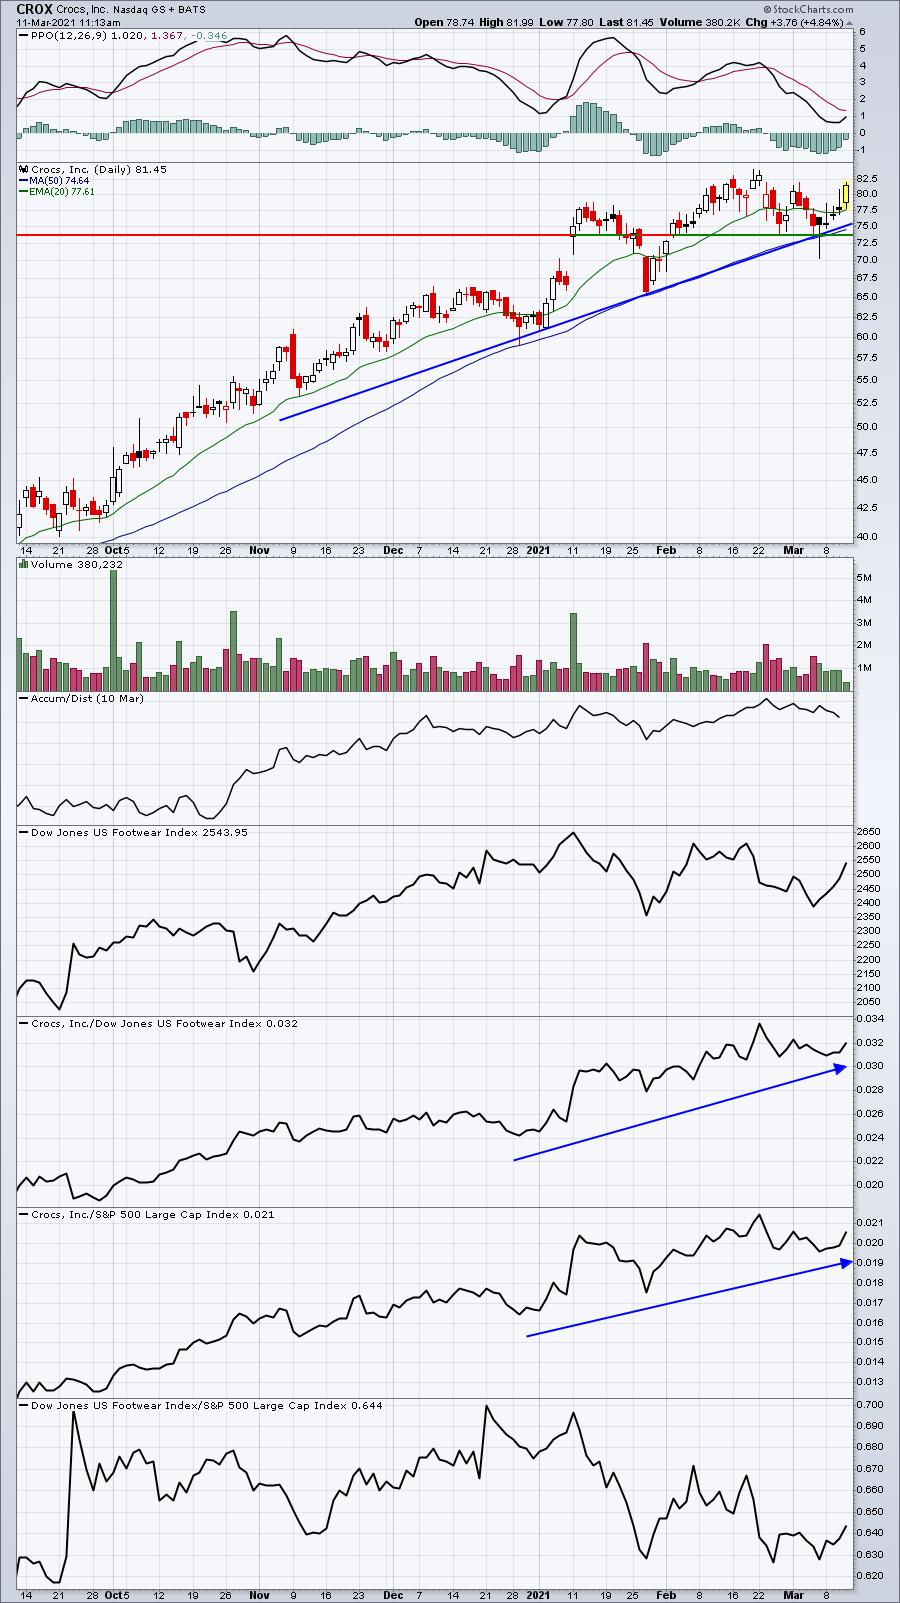
Just a few moments ago, I recorded a "Your Daily 5" segment that will be aired on StockCharts TV at 1:00pm ET today. It's 10 minutes long and it focuses on 5 charts that the host feels are important. I follow our methodology here at StockCharts.com to unveil leading stocks in leading industry groups. In today's episode, I featured 5 stocks from the following 5 consumer discretionary industry groups, along with the individual stock that I selected:
- Clothing & Accessories ($DJUSCF) - KTB
- Apparel Retailers ($DJUSRA) - GOOS
- Travel & Tourism ($DJUSTT) - SABR
- Footwear ($DJUSFT) - CROX
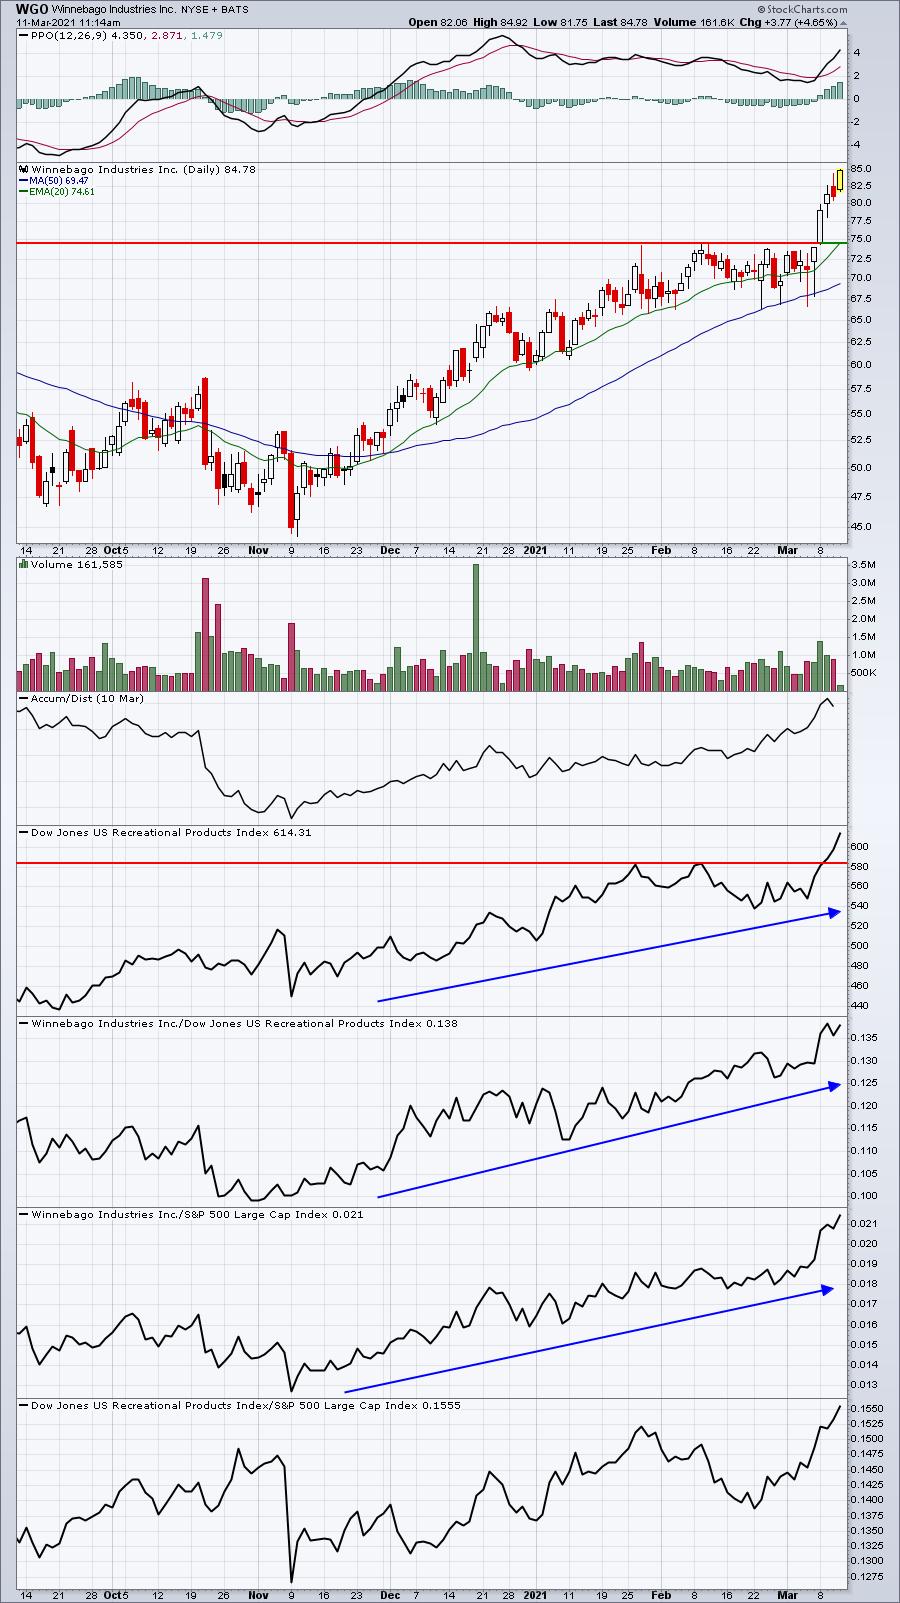
- Recreational Products ($DJUSRP) - WGO
Here is a quick look at a daily chart of each of these 5 stocks:
KTB:
GOOS:
SABR:
CROX:
WGO:
You can tune in to the show later at 1pm ET on StockCharts TV or go to YouTube later today and search for "Your Daily 5 Tom Bowley" and it should appear (give StockCharts some time to edit it and post it). I'd expect that it will be available for review sometime later this afternoon or evening.
I believe this is valuable information, so I wanted to share it with our members before it airs to the public.
Earnings Reports
Here are the key earnings reports for the next two days, featuring stocks with market caps of more than $10 billion. I also include a few select companies with market caps below $10 billion. Finally, any portfolio stocks that will be reporting results are highlighted in BOLD. If you decide to hold a stock into earnings, please understand the significant short-term risk that you are taking. Please be sure to check for earnings dates for any companies you own or are considering owning.
Thursday, March 11:
JD, DOCU, ULTA, STNE, WPM, GDRX, MTN, YSG, EXPI, CELH, DOMO, ZUO, ZUMZ
Friday, March 12:
BKE
Economic Reports
Initial jobless claims: 712,000 (actual) vs. 725,000 (estimate)
Happy trading!
Tom