
EB Daily Market Report - Friday, March 12, 2021
Executive Market Summary
- Futures were strong on the Dow Jones as investors cheered the recent all-time highs
- The S&P 500 was down at the open and the NASDAQ was the worst of all as the 10-year treasury yield ($TNX) gains 10 basis points to close at a 2021 high of 1.63%
- The February PPI headline number was slightly higher than expected, while the core reading was as expected
- The defensive utilities sector (XLU, +1.63%) is the best performing group today
- Industrials (XLI, +1.27%) and financials (XLF, +0.93%) are also leading on the session
- Technology (XLK, -0.98%) is showing the most relative weakness today
- Aerospace ($DJUSAS, +3.68%) continues to strengthen, with Boeing (BA, +6.14%) having a spectacular week
- Commodities are mixed, though crude oil ($WTIC) is down nearly 1%
Market Outlook
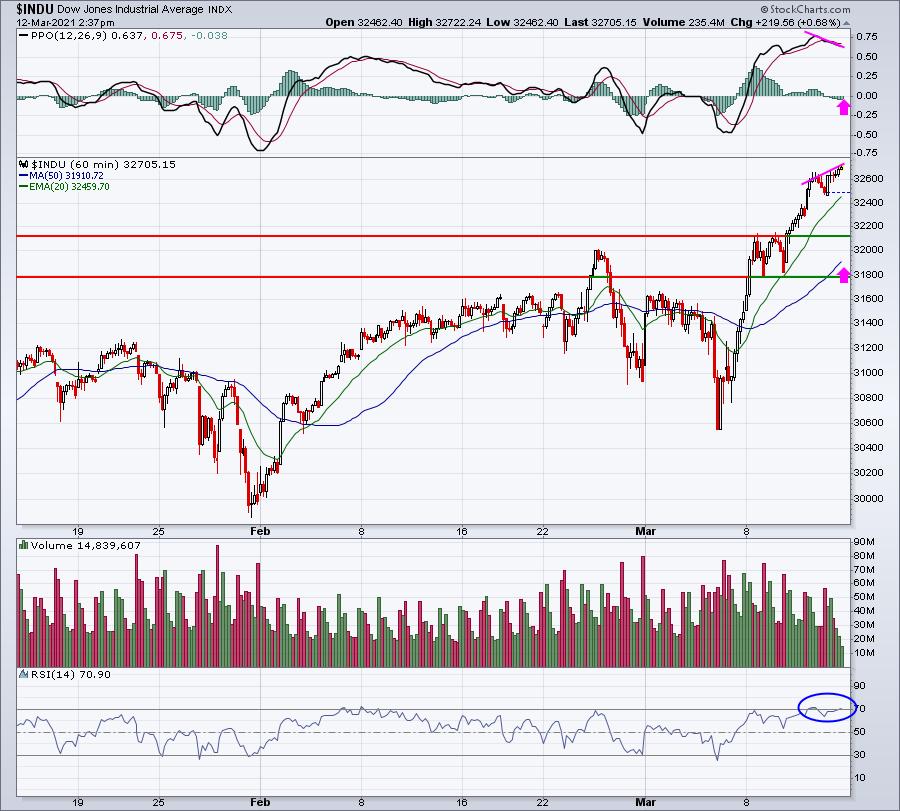
The Dow Jones ($DJI) and the S&P 600 Small Cap Index ($SML) are both showing some momentum issues on their hourly charts:
DJI:
SML:
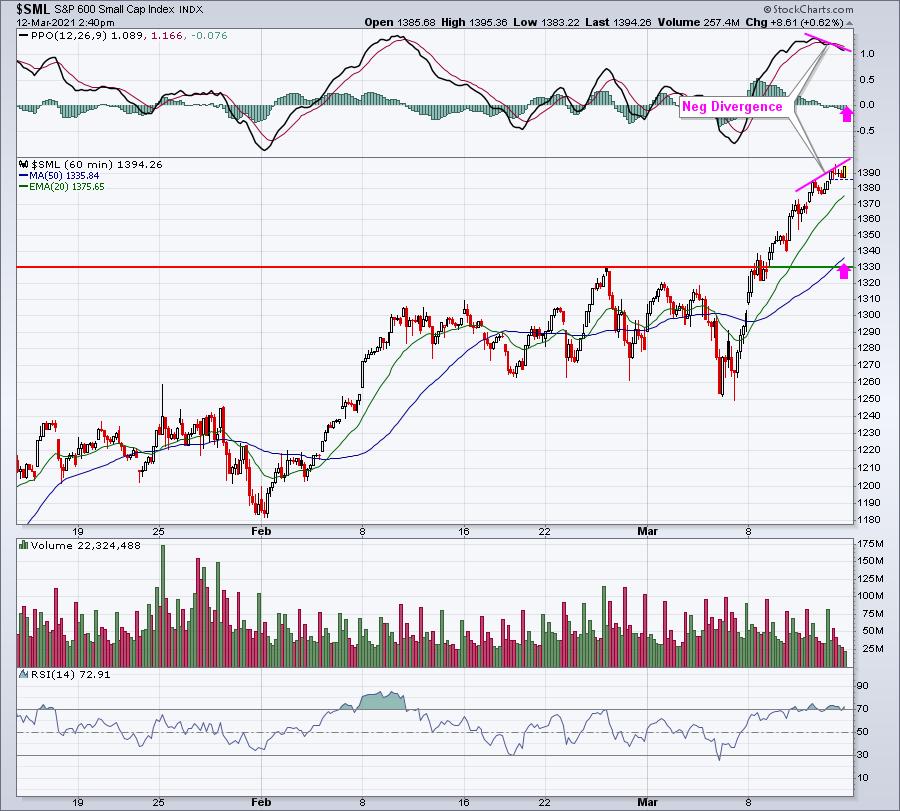
Both indices are short-term overbought on their hourly charts and both show their PPOs rolling over as prices continue to push higher.
Sector/Industry Focus
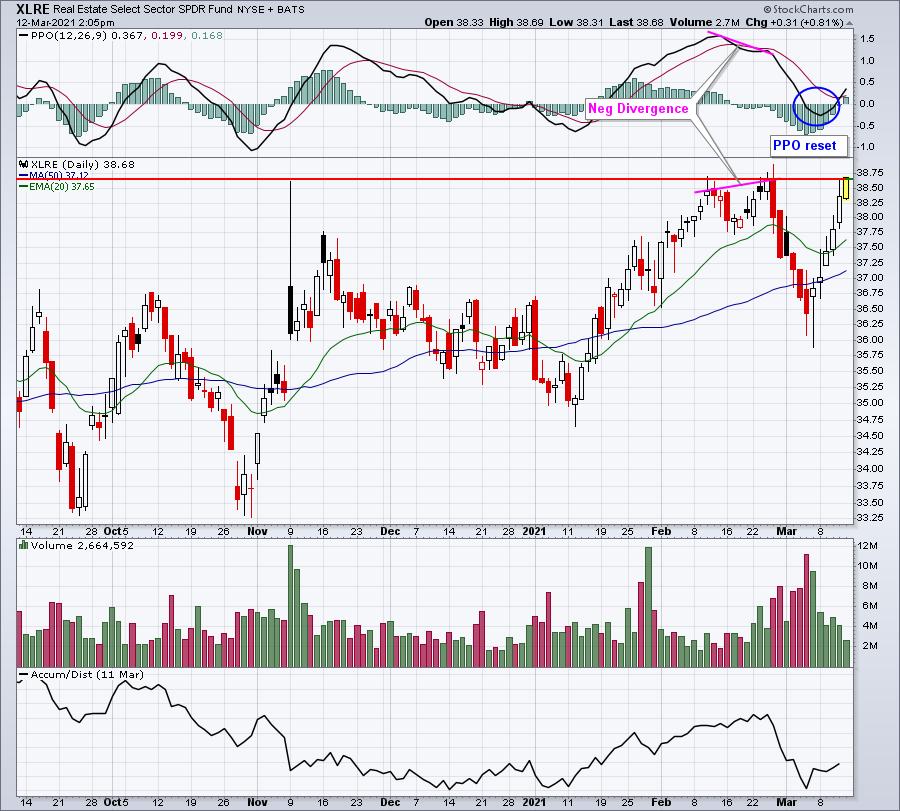
We've flipped in terms of leadership today as financials, industrials, and defensive sectors leading. Among those defensive sectors, real estate (XLRE) is attempting to make a breakout, adding to the long list of breakouts seen in 2021:
The renewed strength recently plays perfectly into the XLRE's seasonal pattern. Over the past 10 years (strong years), the XLRE has mostly underperformed, but as I've posted in recent DMRs, defensive groups tend to do best during the third month of each calendar quarter:
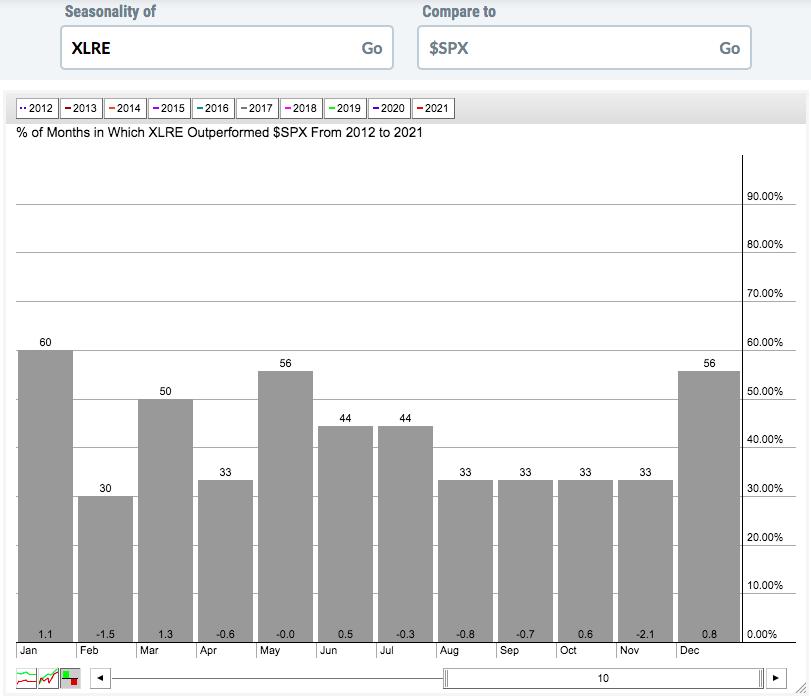
First, you can see that the XLRE's best month for outperformance vs. the S&P 500 is March as it averages beating that benchmark by 1.3% throughout the past decade. Next, let's break down the relative performance of the XLRE by calendar month within each quarter:
- 1st months of calendar quarters (Jan, Apr, Jul, Oct): +0.8%
- 2nd months of calendar quarters (Feb, May, Aug, Nov): -4.4%
- 3rd months of calendar quarters (Mar, Jun, Sep, Dec): +1.9%
Historically, it's typical to see the XLRE show relative strength in March and during those final months of each calendar quarter.
ChartLists/Strategies
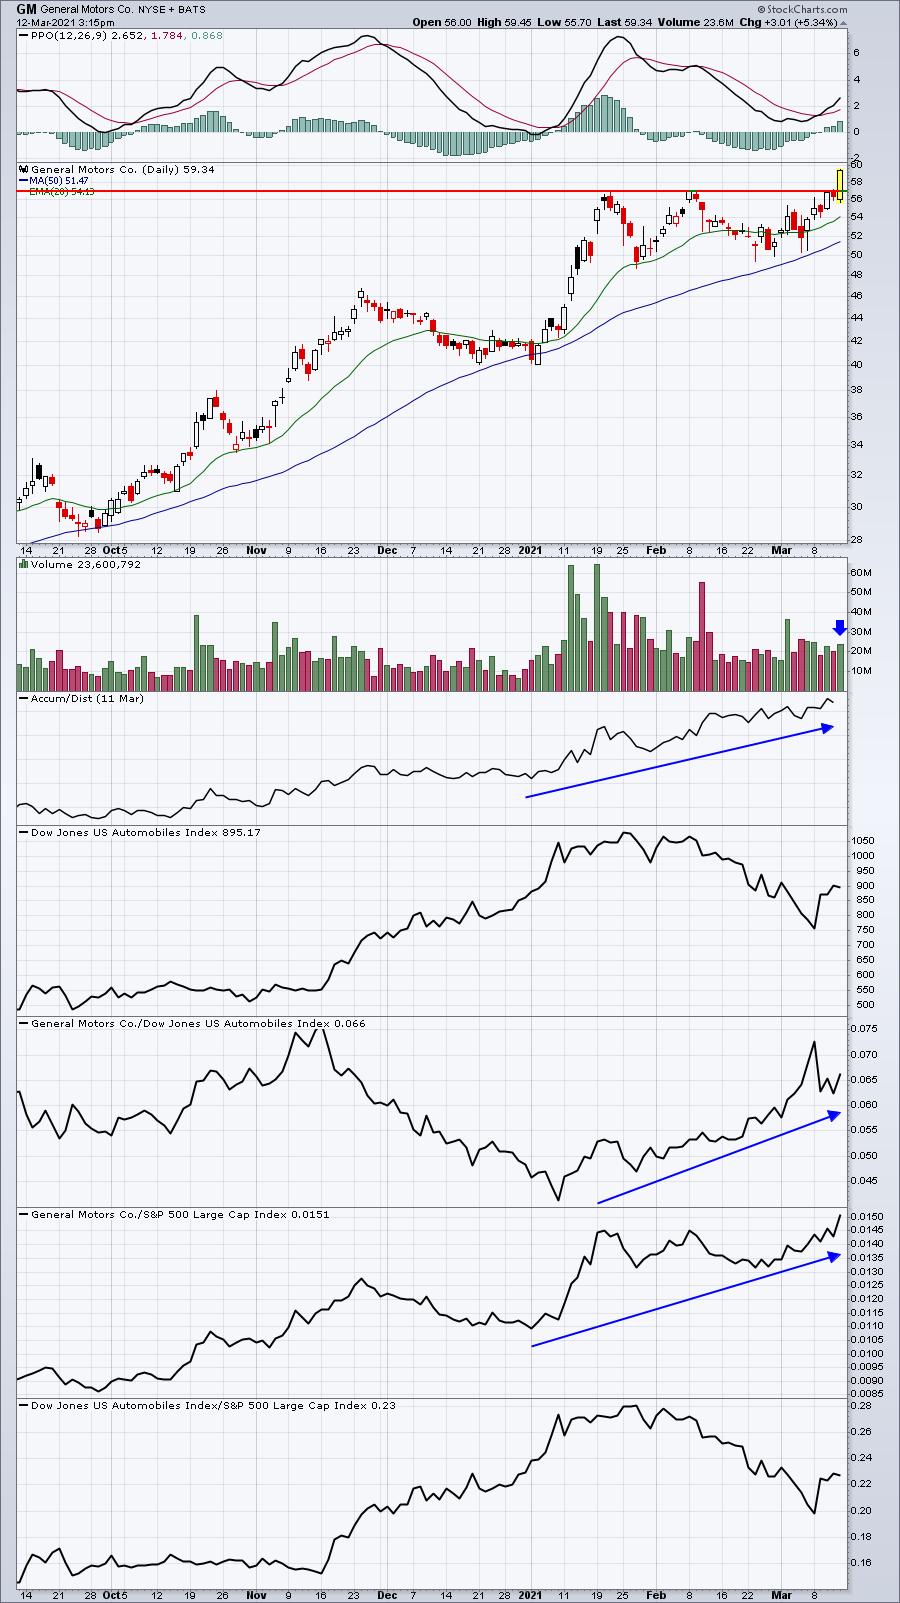
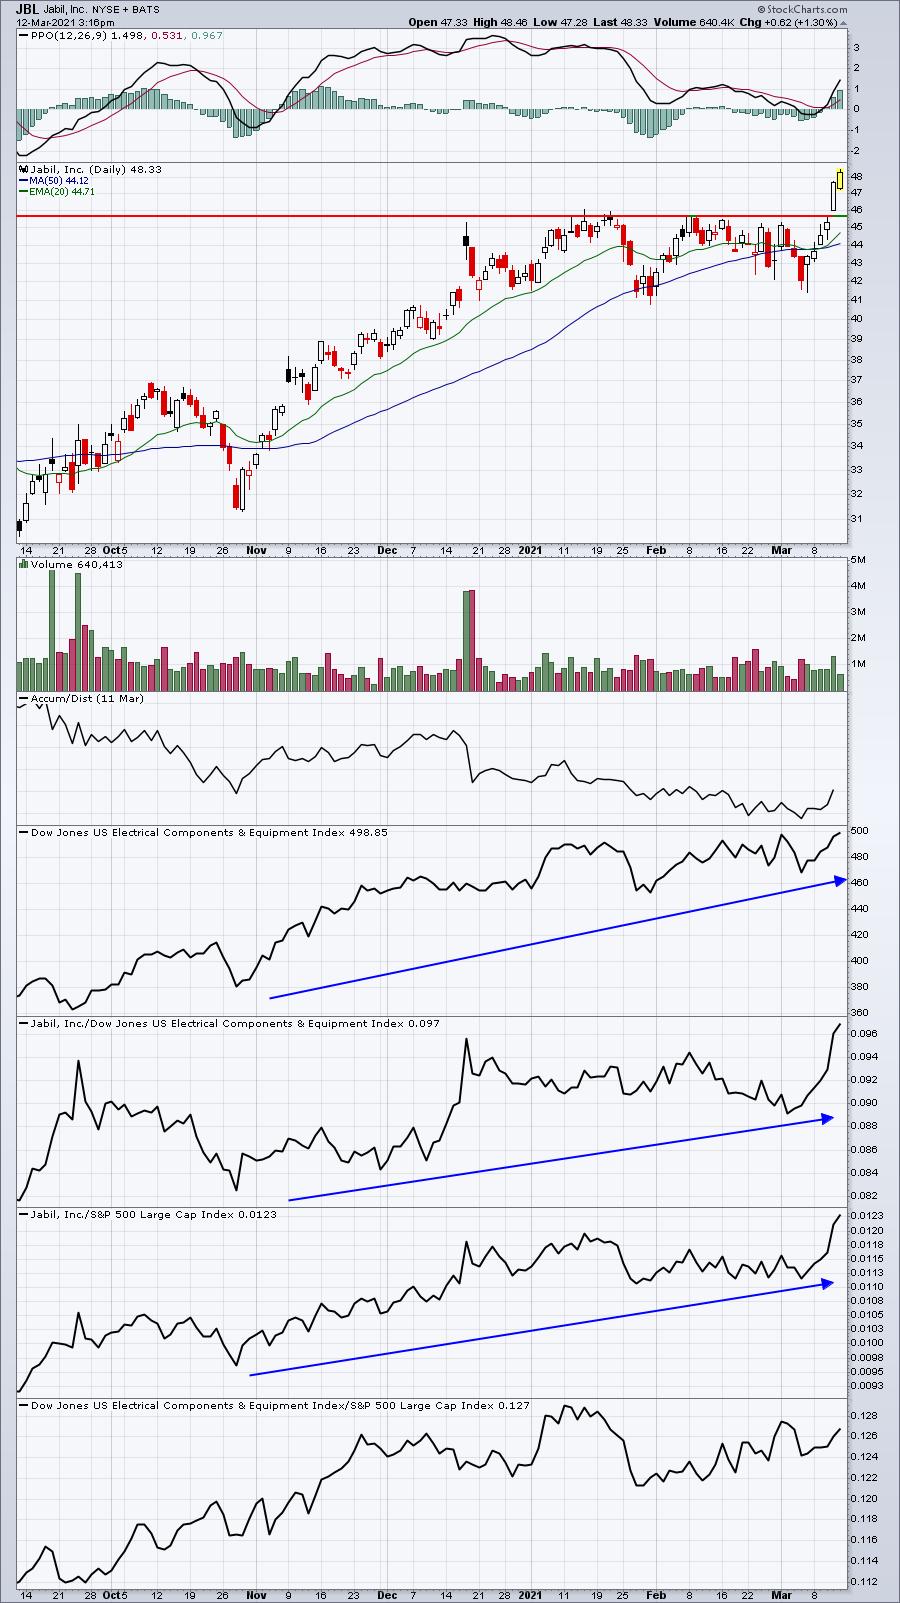
Here are a few breakouts worth noting from our Strong Earnings ChartList (SECL):
GM:
JBL:
BX:
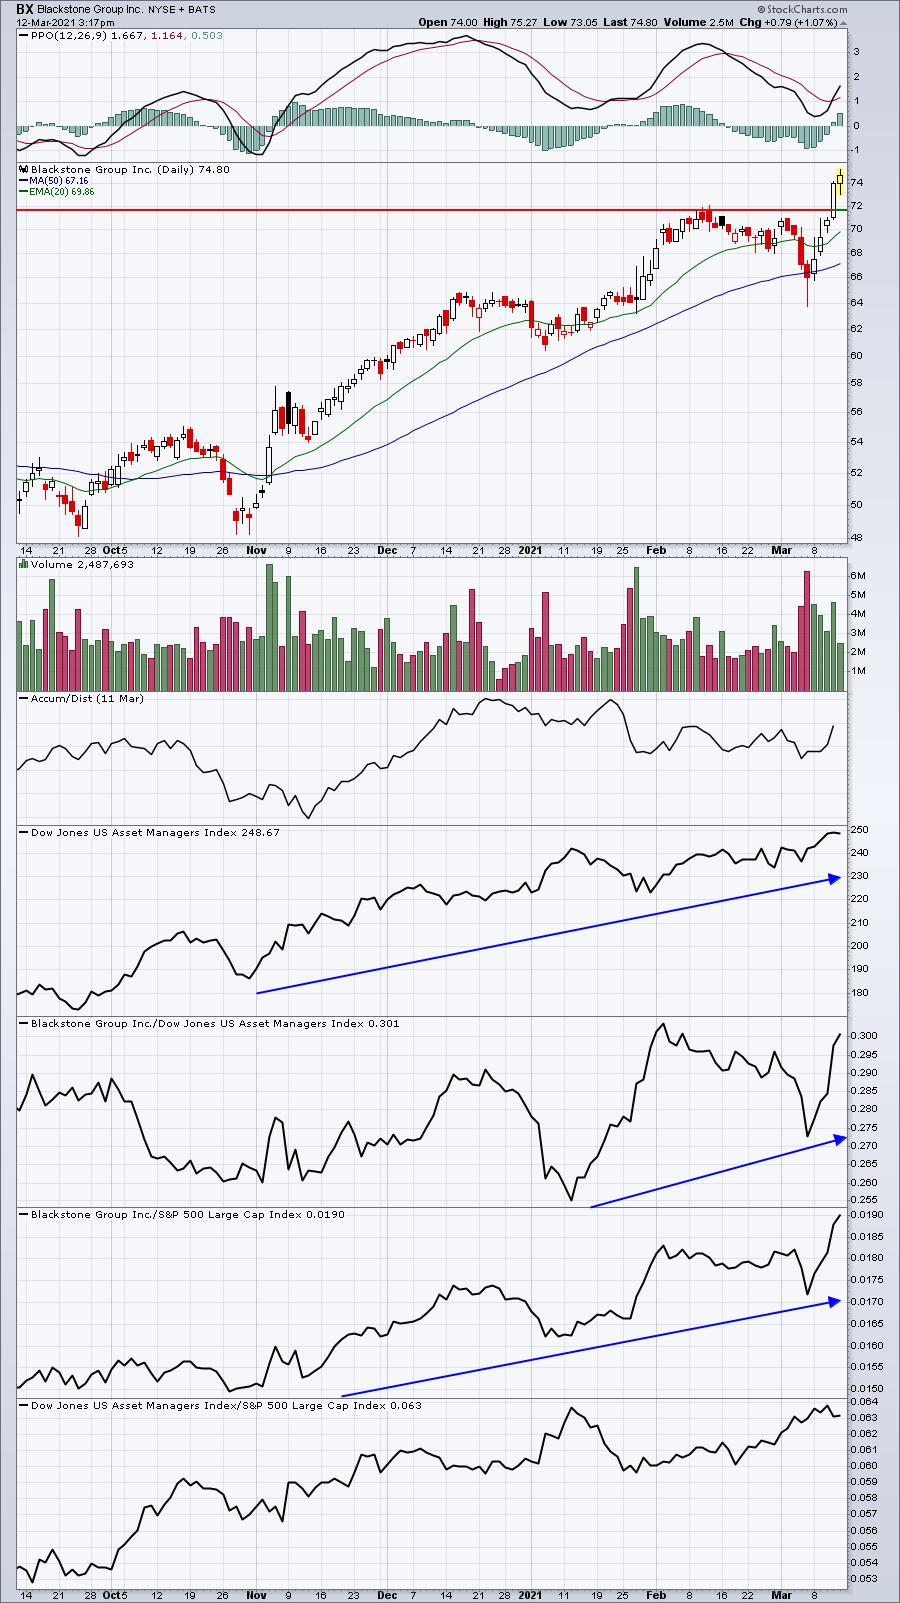
All three of these stocks appear poised to rally higher, though the best entry point on each would be the combination of price support and their respective rising 20-day EMAs.
Earnings Reports
Here are the key earnings reports for the next two days, featuring stocks with market caps of more than $10 billion. I also include a few select companies with market caps below $10 billion. Finally, any portfolio stocks that will be reporting results are highlighted in BOLD. If you decide to hold a stock into earnings, please understand the significant short-term risk that you are taking. Please be sure to check for earnings dates for any companies you own or are considering owning.
Friday, March 12:
BKE
Monday, March 15:
HQY, WPRT, VUZI
Economic Reports
February PPI: +0.5% (actual) vs. +0.4% (estimate)
February Core PPI: +0.2% (actual) vs. +0.2% (estimate)
March consumer sentiment: 83.0 (actual) vs. 78.5 (estimate)
Happy trading!
Tom