
EB Daily Market Report - March 16, 2021
Executive Market Summary
- Futures were mixed at the open with the Dow Jones and small caps lagging, while the NASDAQ regained a leadership role
- Economic reports this morning were lousy, especially February retail sales which showed a big 3% drop after the huge 5% gain in January
- Industrial production and capacity utilization were also much weaker than expected
- The 10-year treasury yield ($TNX) is having nothing to do with it as the yield climbs two basis points to 1.62%
- Despite the rising yield, financials (XLF, -1.16%) is among today's worst performing sectors
- Volatility in energy shares (XLE, -2.68%) continues as crude oil ($WTIC) has faltered a bit
- Communication services (XLC, +1.05%) is the strongest sector today, though we've seen a weakening across the board this afternoon
- The Federal Reserve has begun its two-day meeting with its policy statement due out at 2pm ET on Wednesday
Market Outlook
Like the Dow Jones ($DJI), the S&P 600 Small Cap Index ($SML) is struggling today, but both of these indices have 60 minute negative divergences that suggested we might see some unwinding. Here's an hourly chart of the SML:
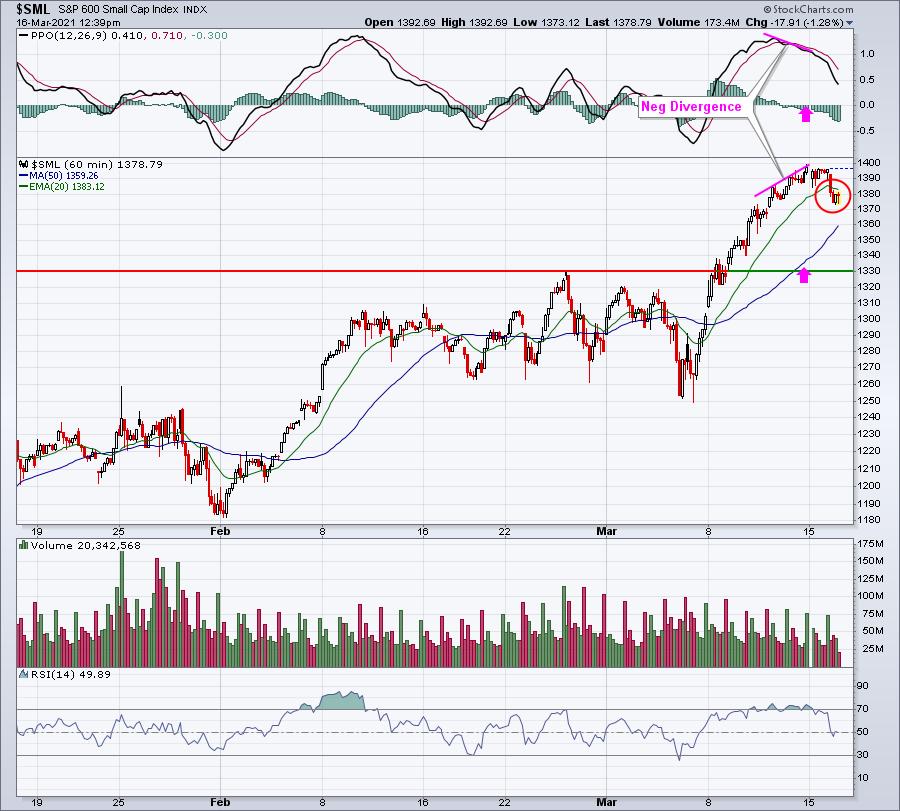
These negative divergences on hourly charts are not meant to make long-term calls. We need to look at daily and weekly charts for that. 60-minute negative divergences generally play out over a few days.
Sector/Industry Focus
Over the past month, the drug retailers ($DJUSRD) have been the best performing industry group. Much of that is likely attributable to the March push into more defensive areas, so I'm not expecting it to last. However, the group is at a 52-week high and is nearing a key price resistance level from November 2019:
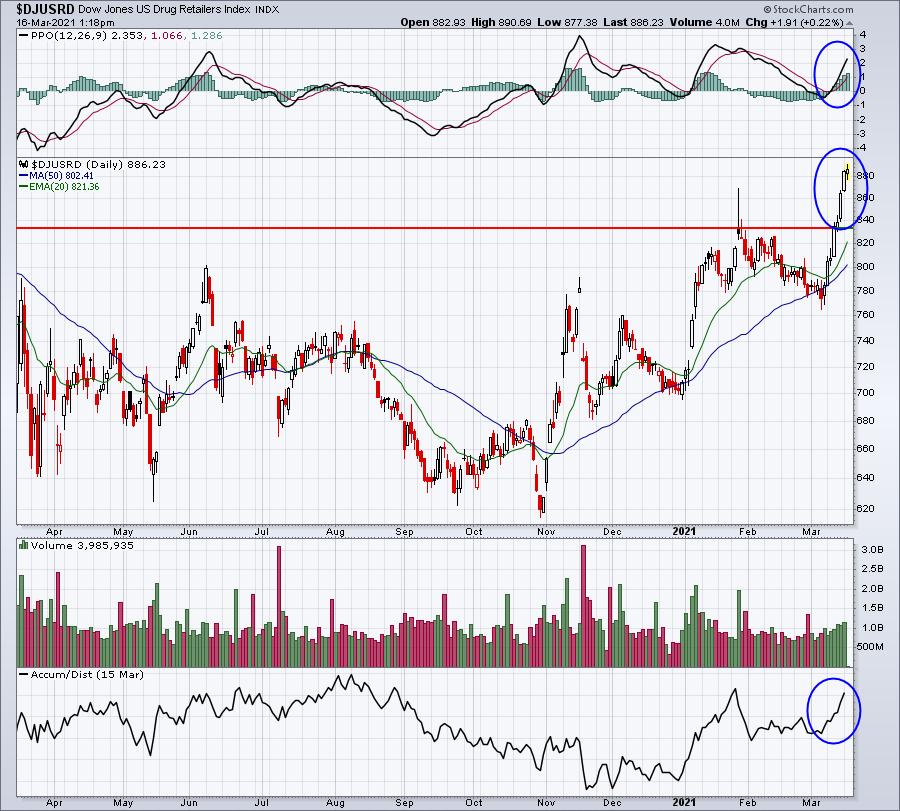
The blue circles highlight the accelerating bullish momentum, rising AD line, and a key breakout. The bad news is that this advance might be a little long in the tooth, options expiration could be a factor for a stock like Walgreens Boots Alliance (WBA), and the weekly chart recognizes more serious overhead resistance approaching:
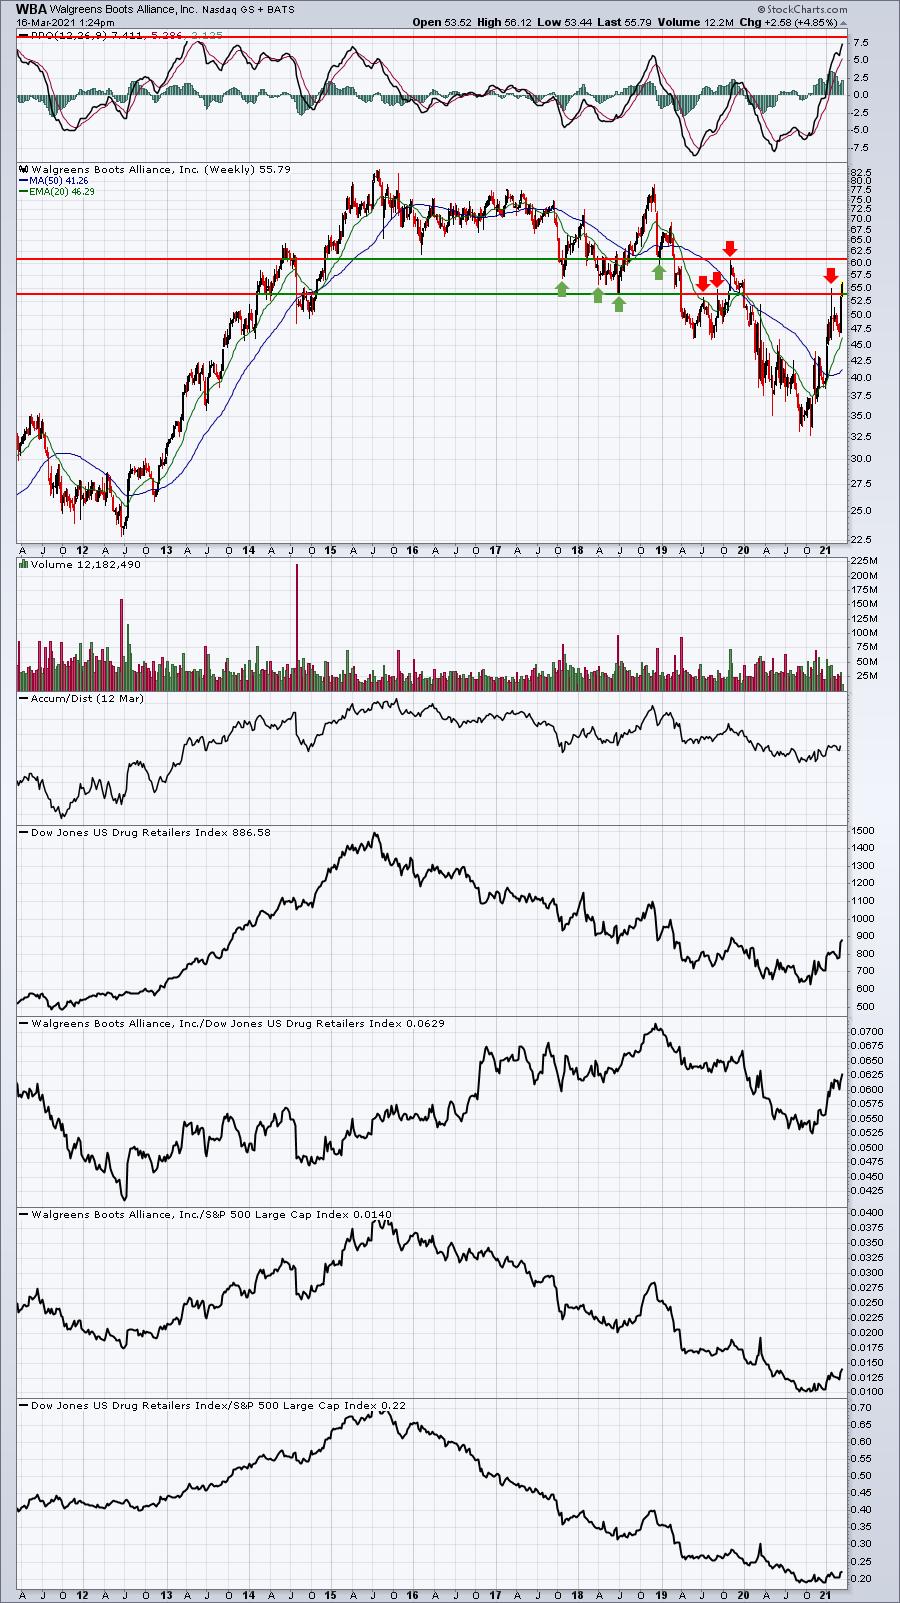
The weekly PPO is nearing a 10-year high, meaning any further advance would begin to move into uncharted waters. Also, we cannot ignore the key resistance zone from 54 to 61. This had served as key support during the decline in 2017-2018. The closer WBA gets to 61, the more ominous this chart looks. Finally, from a short-term perspective, there are a TON of in-the-money calls on WBA that everyone should be aware of as we head towards options expiration this Friday.
ChartLists/Strategies
For those of you that like to short-term trade and keep your risks to a minimum, I occasionally will trade uptrending, solid momentum stocks on morning or intraday pullbacks. A scan that I ran today is similar to the Downtrend Reversal scan, except that I'm looking for stocks that continue to print higher daily lows and I look to buy very close to the prior day's low with the anticipation of that prior low holding and the stock reversing higher. Here's the scan syntax:
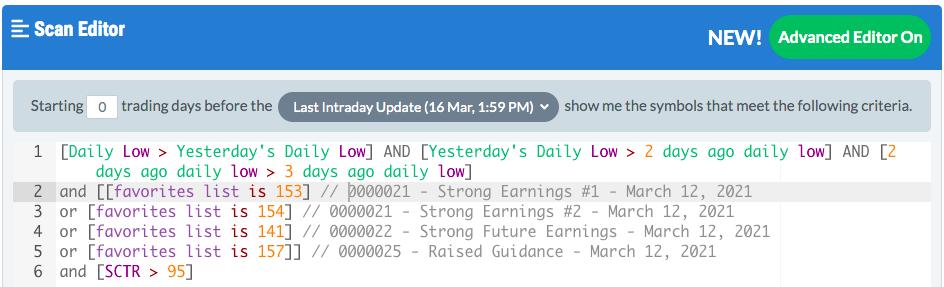
37 stocks were returned. I'll then sort them based on largest daily loss and look at those stocks first:
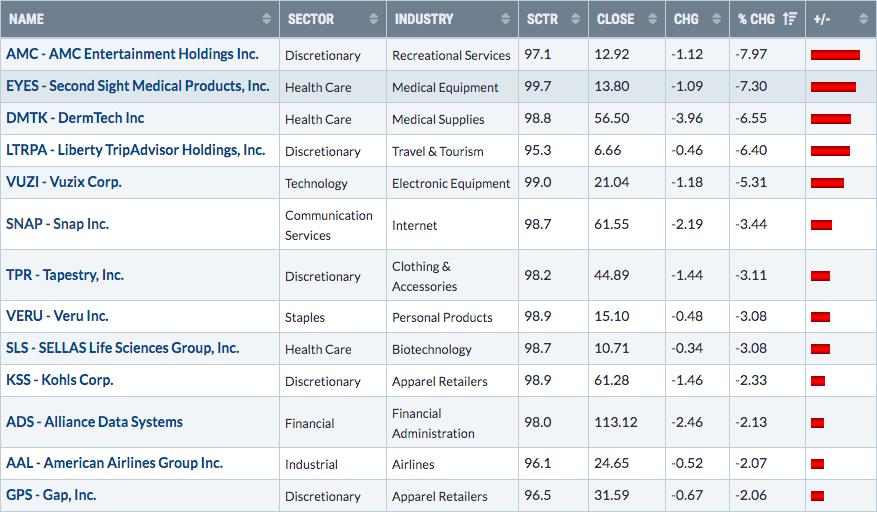
I'll pull up two potential short-term trades off this list:
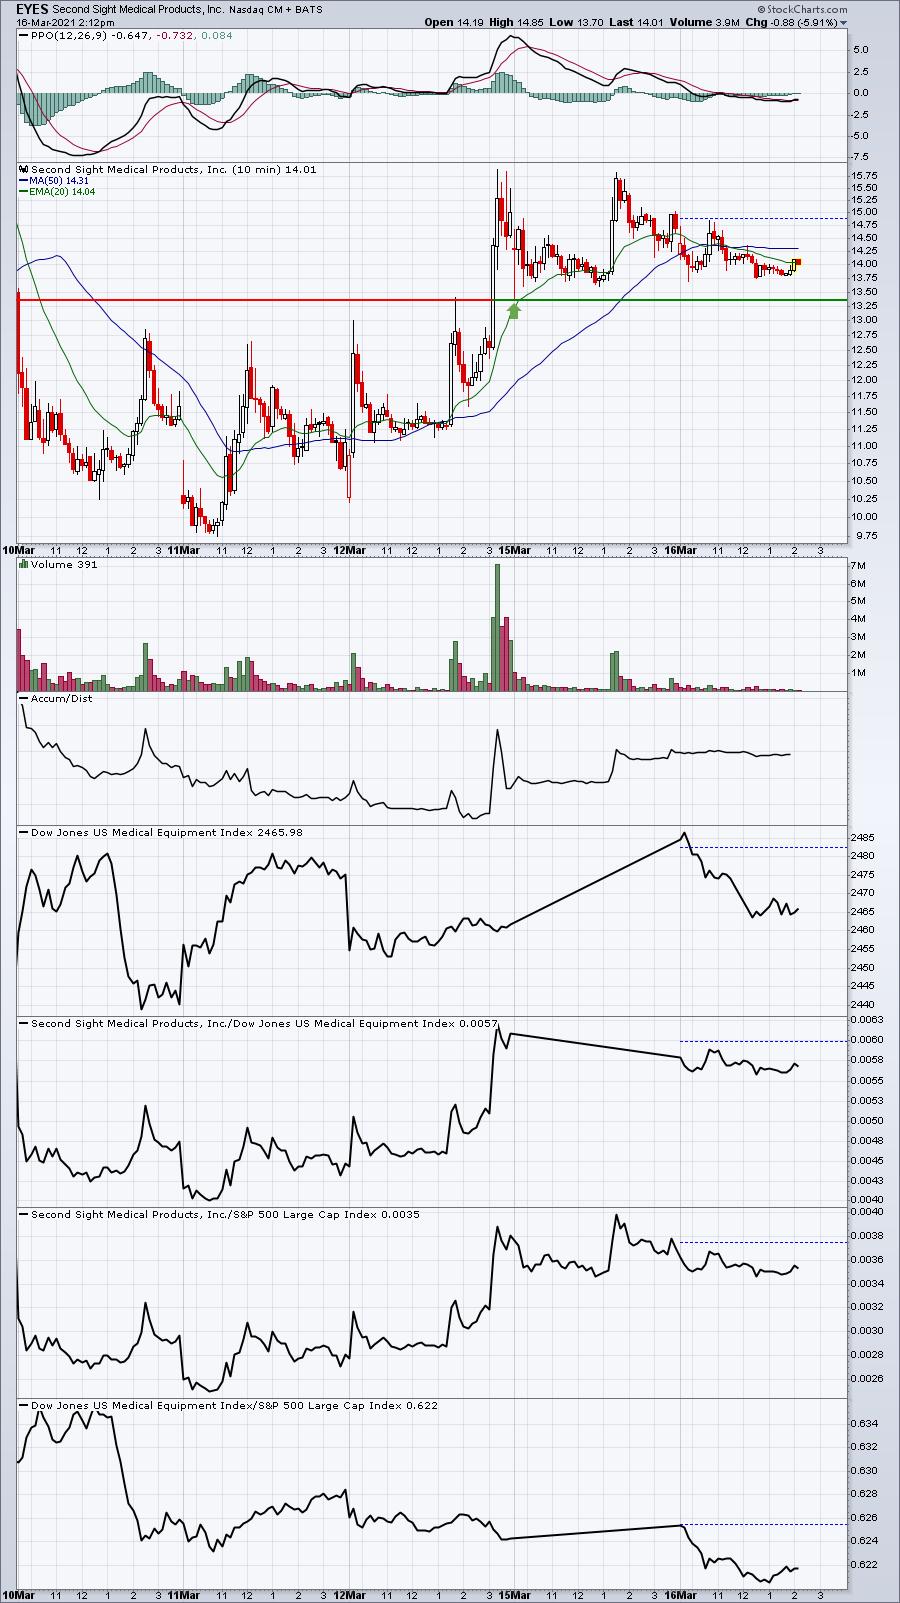
EYES:
LTRPA:
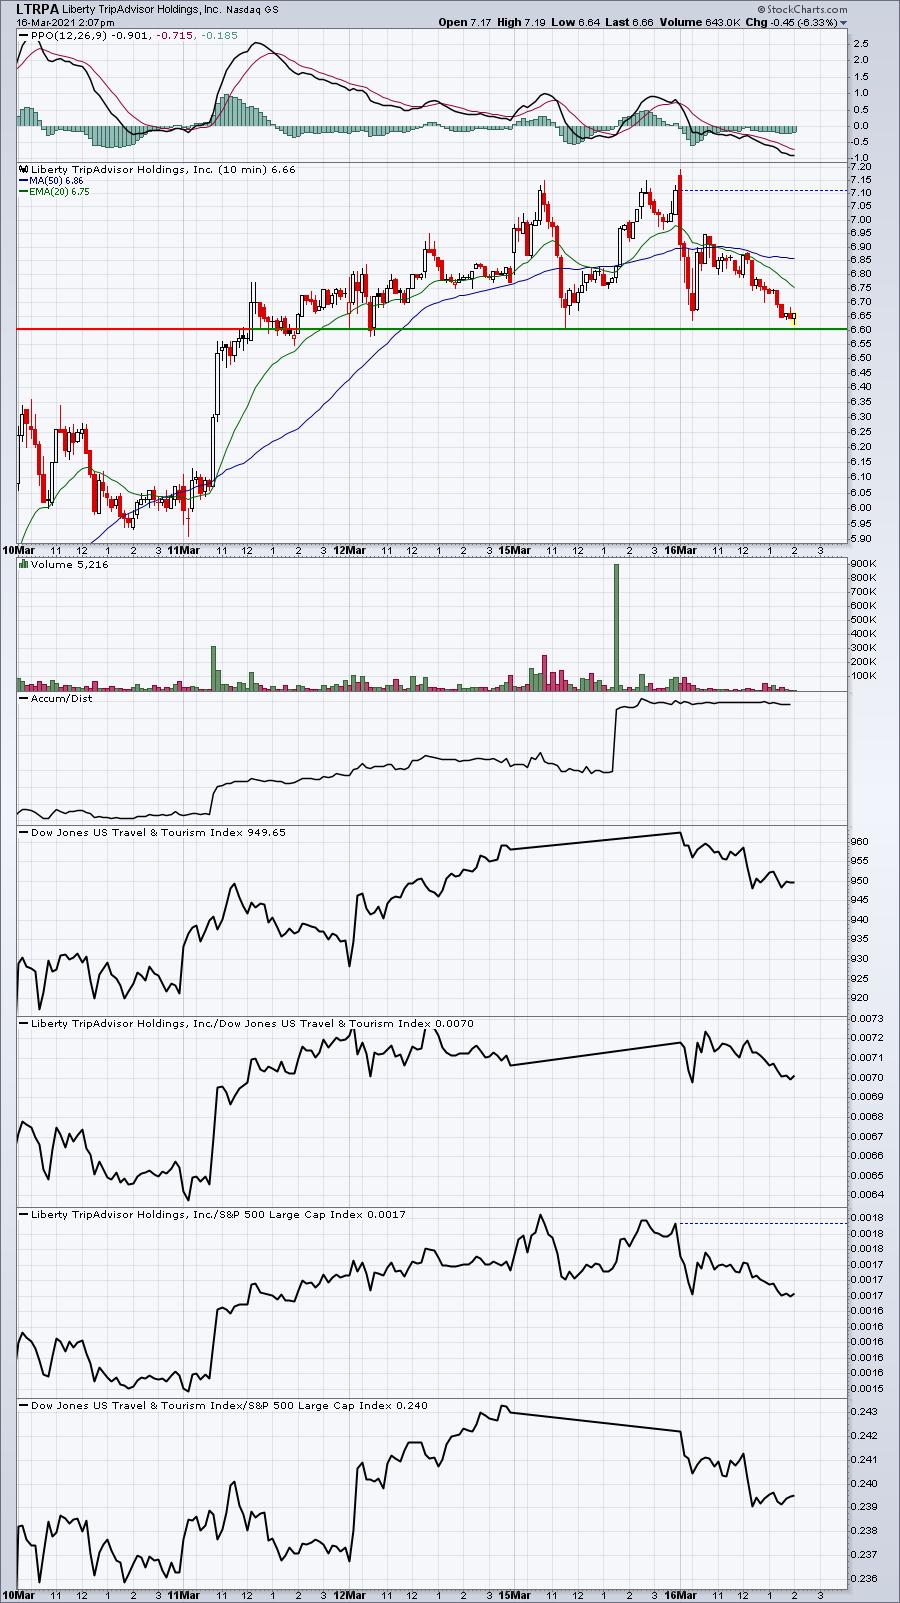
This is not a normal part of my trading strategy, but it's one way to know EXACTLY how much you're risking to the downside because you can immediately place a stop beneath the prior day's low. If it triggers, you lose a small amount, but you're right back out. If it reverses, however, you can later decide how long you want to hold. Remember, the scan is run with one filter being a SCTR score above 95, so these stocks are quite likely to be in excellent uptrends.
I just wanted to pass this along for those of you that may look for potential ways to make short-term gains on an intraday chart. My preference is to find these stocks that are pulling back in the first 60-90 minutes, hold support, and begin to turn back up. Then I can get in, calculate how many shares I want to buy based on my total $ risk on the trade. Based on where you enter the trade, you can back into the number of shares you trade.
Here's an example. Let's say ABC stock trades at 100.50 and the prior day's low was 100.00. If I buy at 100.50, I know the most I'm willing to risk is .51 if I place a stop at 99.99. If I buy 100 shares, my risk is $51. If I want to risk $200, I could potentially buy 400 shares. 400 shares time $.51 = $204.
Earnings Reports
Here are the key earnings reports for the next two days, featuring stocks with market caps of more than $10 billion. I also include a few select companies with market caps below $10 billion. Finally, any portfolio stocks that will be reporting results are highlighted in BOLD. If you decide to hold a stock into earnings, please understand the significant short-term risk that you are taking. Please be sure to check for earnings dates for any companies you own or are considering owning.
Tuesday, March 16:
CRWD, LEN, FUTU, COUP, SMAR, JBL, FCEL, FLNT
Wednesday, March 17:
PDD, CTAS, ZTO, KC, FIVE, WSM, SMTC, PD, SNDL
Economic Reports
February retail sales: -3.0% (actual) vs. -0.5% (estimate)
February retail sales less autos: -2.7% (actual) vs. -0.1% (estimate)
February industrial production: -2.2% (actual) vs. +0.5% (estimate)
February capacity utilization: 73.8% (actual) vs. 75.7% (estimate)
January business inventories: +0.3% (actual) vs. +0.3% (estimate)
March house price index: 82 (actual) vs. 83 (estimate)
Happy trading!
Tom