
EB Daily Market Report - Thursday, March 18, 2021
Executive Market Summary
- Futures were once again mixed with the Dow Jones and S&P 500 in favor
- Given the narrative of higher interest rates and potentially higher inflation, technology (XLK, -2.57%) is being left behind; energy (XLE, -3.63%) is the worst sector (likely options-related)
- Crude oil ($WTIC, -7.8%) is getting crushed and is a big problem for energy stocks today
- The 10-year treasury yield ($TNX) has jumped 9 basis points to 1.73%, triggering more buying of financial stocks (XLF, +1.05%)
- Many oil names - OXY, MRO, APA, VLO, DVN - are littering the S&P 500 laggards
- Williams Sonoma (WSM, +18.79%) has avoided the sellers after crushing EPS estimates, $3.95 vs. $3.39
- Home construction ($DJUSHB, -5.04%), one day after soaring higher, is giving back most of its gains and trails only renewable energy ($DWCREE, -5.23%) as today's weakest industry group
Market Outlook
I know that many market pundits want to bury technology stocks and the NASDAQ Composite ($COMPQ) in general, but I'd be careful about doing so. Here's a 5-year weekly chart that shows the rising 20-week EMA holding as support many times during a secular bull market advance. It's difficult trying to follow what you're seeing on the charts when hundreds of media "experts" are pointing out all the reasons why the stock market will go down. I follow the charts every single time and this is what the $COMPQ looks like right now:
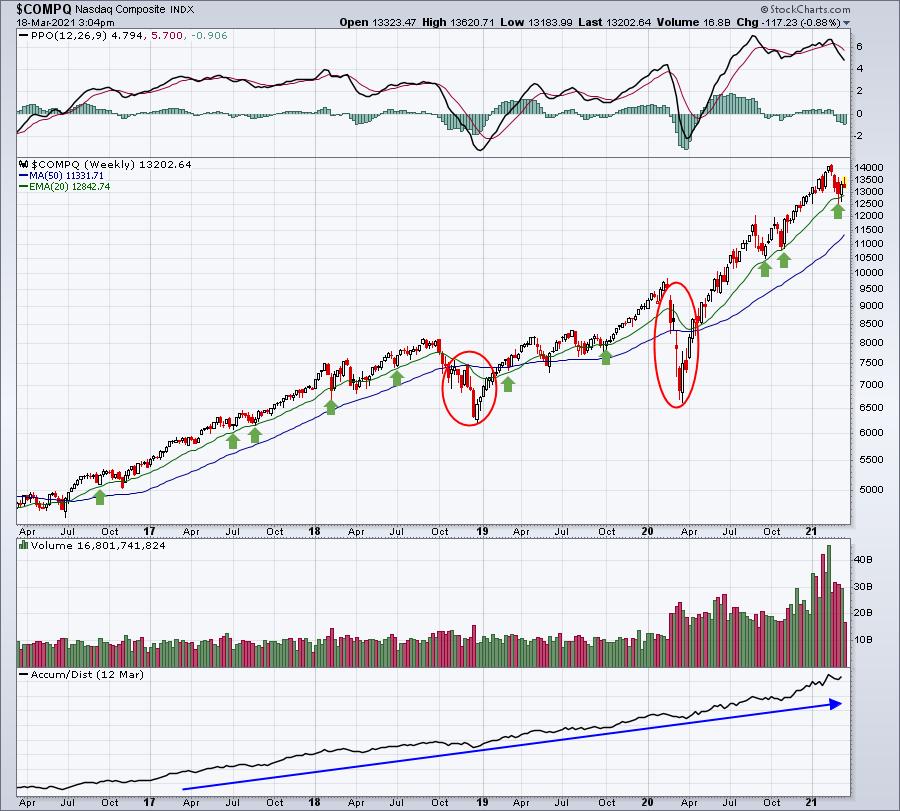
We've had two meaningful breaks below the 20-week EMA in the past 5 years. One was the trade war with China in Q4 2018 and the other was a 100-year pandemic. That's it. Other than that, every other trip to the 20-week EMA has been a buy signal. But this time is different?
I feel like March is historically a difficult month for aggressive areas of the market and this March's excuse is high interest rates and inflation. Next March it'll be something else.
I remain bullish, despite the options-related and interest-related selling taking place currently.
Sector/Industry Focus
Given that the TNX is jumping 9 basis points to 1.73%, the sector leaderboard isn't too surprising:
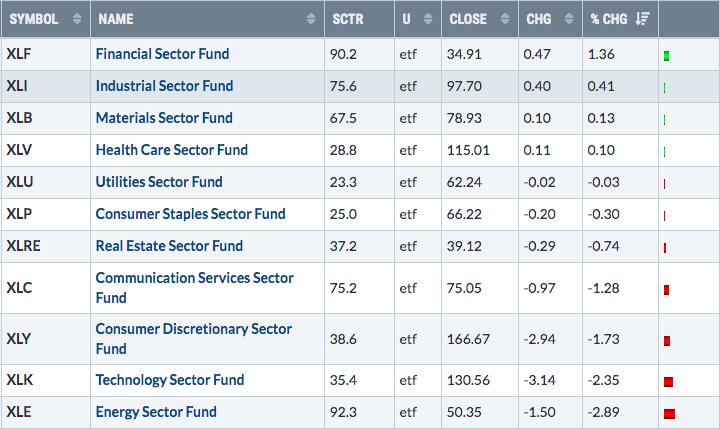
Energy is being hit the hardest, but this group had been the strongest over the past month, so dropping like this into options expiration is almost to be expected. Technology, consumer discretionary, and communication services are weak as that's been the storyline of late. Higher interest rates spell doom for these groups (sarcasm). I believe we still have a couple more weeks of March to deal with, then I expect we'll see money rotate right back to high growth areas. This hasn't been a rush to safety (bonds, consumer staples, gold, etc.). It's simply been the rotation that I've discussed for months was eventually coming. Financials and industrials are now breaking out and leading.....for now. I remain extremely bullish the overall market and the growth stocks for the balance of 2021 and beyond.
ChartLists/Strategies
There's still no need to rush any trades at this point. As you can see, just during the past hour or two, a sudden bout of selling appeared out of nowhere. Well, except that we know it's not out of nowhere. It's likely market makers using their capital to drive down prices into options expiration. If you listen closely, you can hear the "Ka-Ching" as market makers rake in their $billions of profits.
Note that our potential long trades from our March max pain webinar aren't performing badly at all. Miracle, right?
BABA:
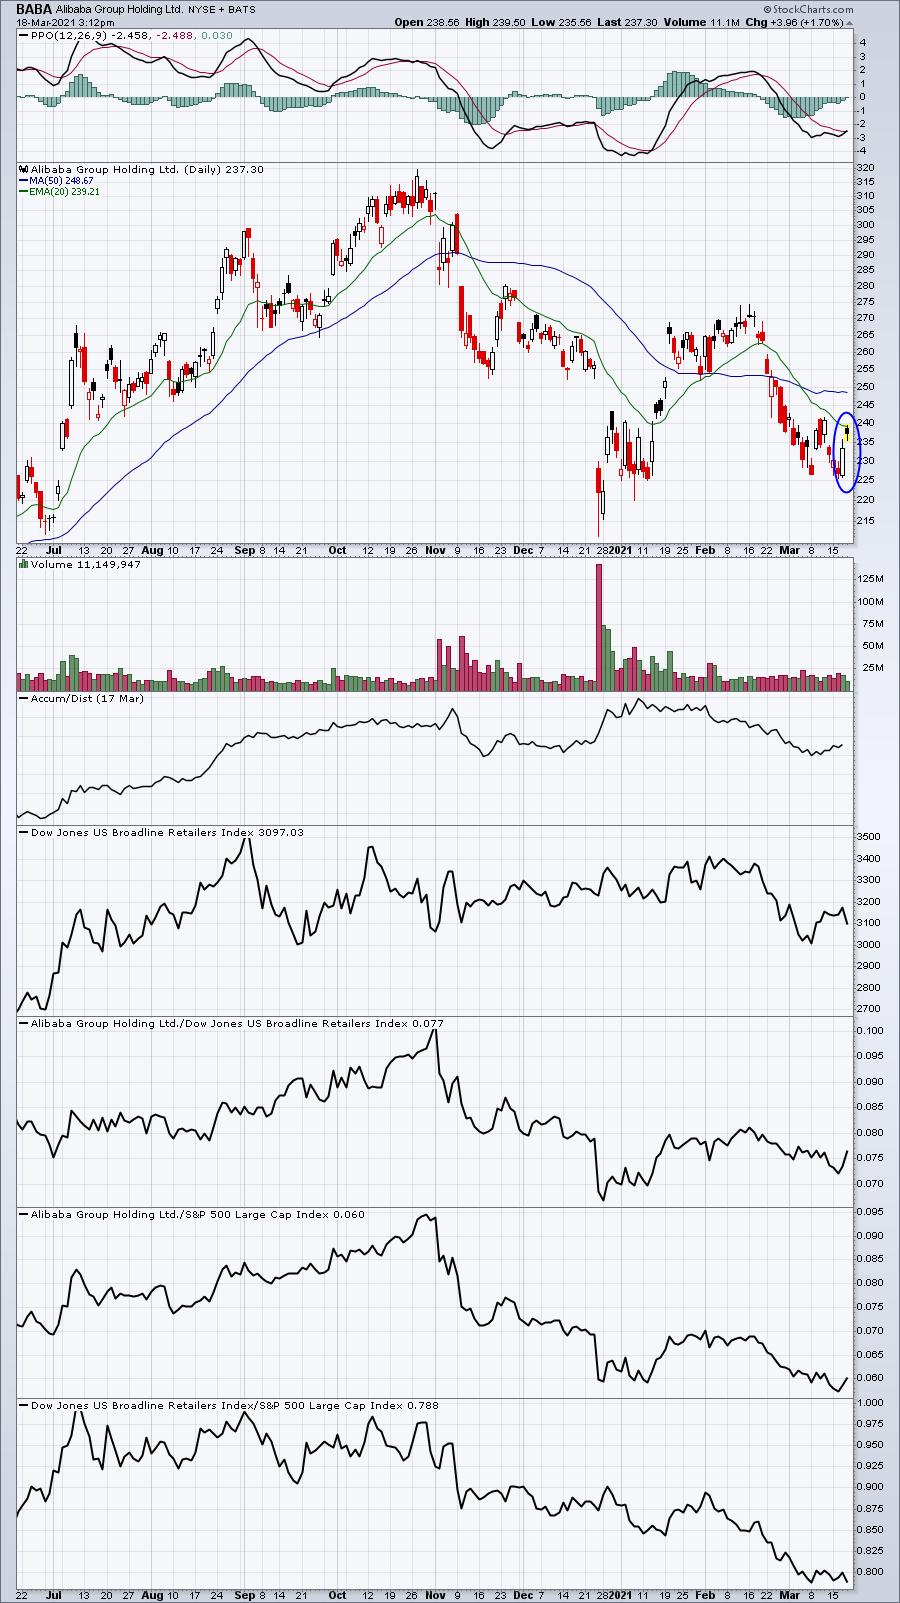
From a financial standpoint, BABA was the stock where market makers had the absolute most at risk (among the stocks I discussed at our Max Pain webinar). If you recall, there was $466 million of net in-the-money put premium. Market makers pocket some of that if BABA moves higher. Despite the heavy selling today on the NASDAQ, BABA somehow (miraculously!) has managed to avoid the selling. Imagine that!
JD:
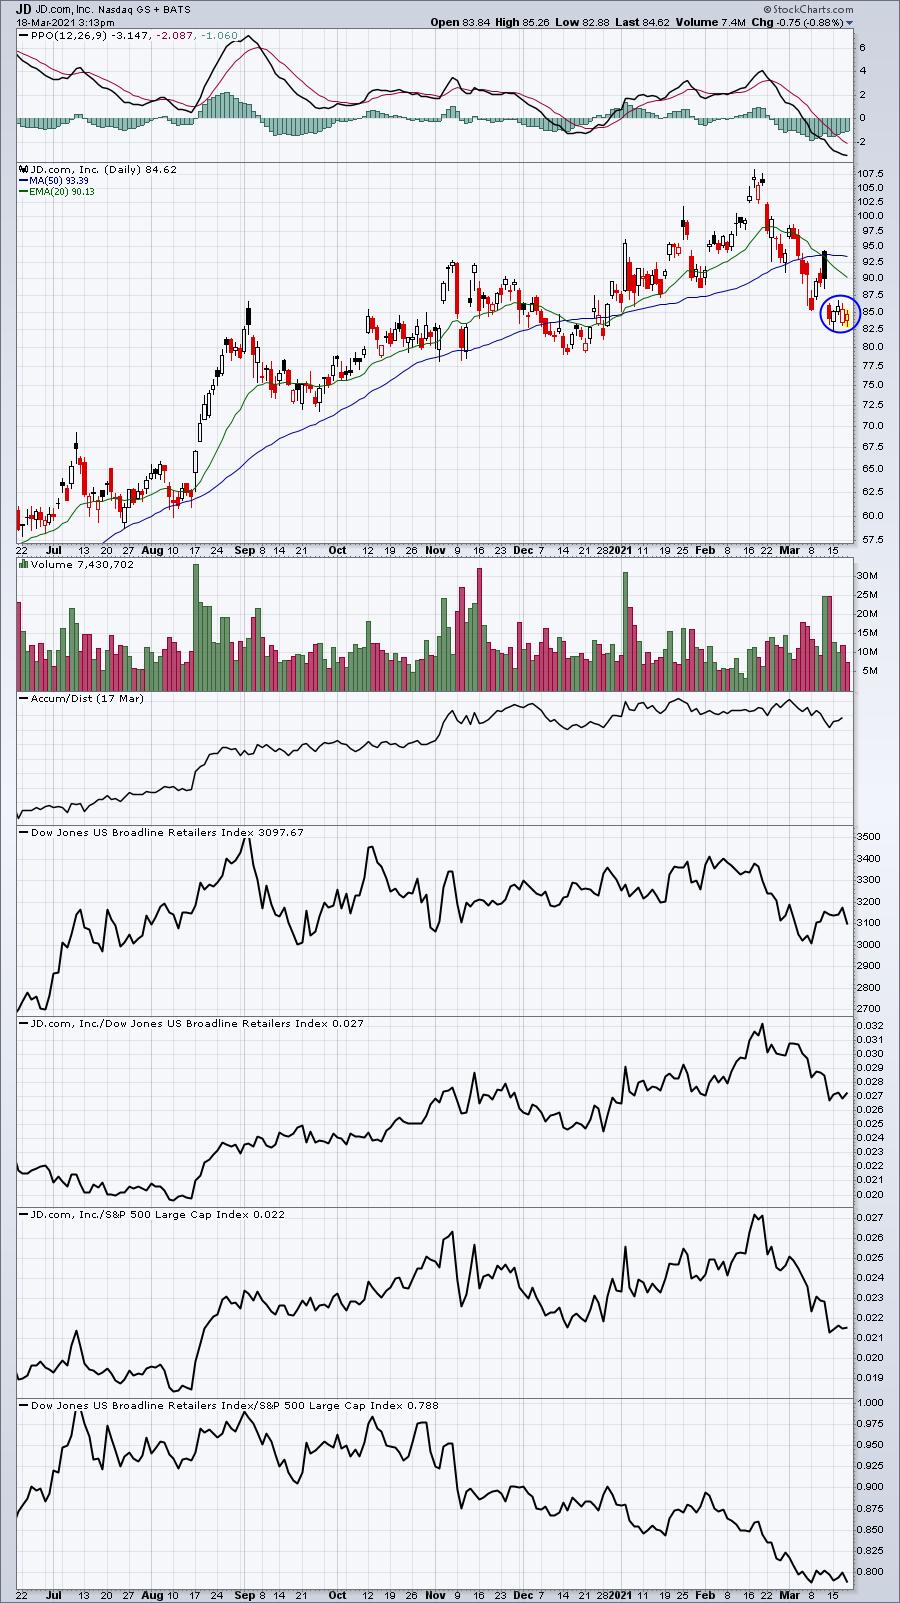
Check out those hollow candles. We've seen gaps lower the past two days, but buying throughout the day. It's in the best interest of market makers to see JD rise, so those early gaps down aren't sticking.
Earnings Reports
Here are the key earnings reports for the next two days, featuring stocks with market caps of more than $10 billion. I also include a few select companies with market caps below $10 billion. Finally, any portfolio stocks that will be reporting results are highlighted in BOLD. If you decide to hold a stock into earnings, please understand the significant short-term risk that you are taking. Please be sure to check for earnings dates for any companies you own or are considering owning.
Thursday, March 18:
NKE, ACN, FDX, DG, WB, LAZR, OLLI, JOBS, CMC, SIG, CSIQ, GIII
Friday, March 19:
ERJ
Economic Reports
Initial jobless claims: 770,000 (actual) vs. 725,000 (estimate)
March Philadelphia Fed manufacturing index: 51.8 (actual) vs. 24.0 (estimate)
February leading indicators: +0.2% (actual) vs. +0.3% (estimate)
Happy trading!
Tom