
EB Daily Market Report - Friday, March 19 2021
Executive Market Summary
- Futures were lower, though the NASDAQ was spared at the open
- We've seen mostly strength after a bit of morning weakness
- Options expire at the close today, so we are seeing a bit of manipulation in my opinion
- Commodities are mostly on the rise, with crude oil ($WTIC) gaining 2.65% on the session thus far
- The 10-year treasury yield ($TNX) opened lower, but has worked its way back to breakeven at 1.73%
- Communication services (XLC, +1.23%) is the strongest sector today, while financials (XLF, -0.98%) are the weakest
- FedEx Corp (FDX) is up nearly 6% after reporting better than expected quarterly results yesterday after the close
Market Outlook
The media would have all of us believe that rising treasury yields are bad for NASDAQ stocks. During this secular bull market, I want you to see the PROOF of how NASDAQ stocks perform relative to the benchmark S&P 500 vs. the direction of treasury yields. Fortunately, we can do this at StockCharts.com by using the correlation coefficient:
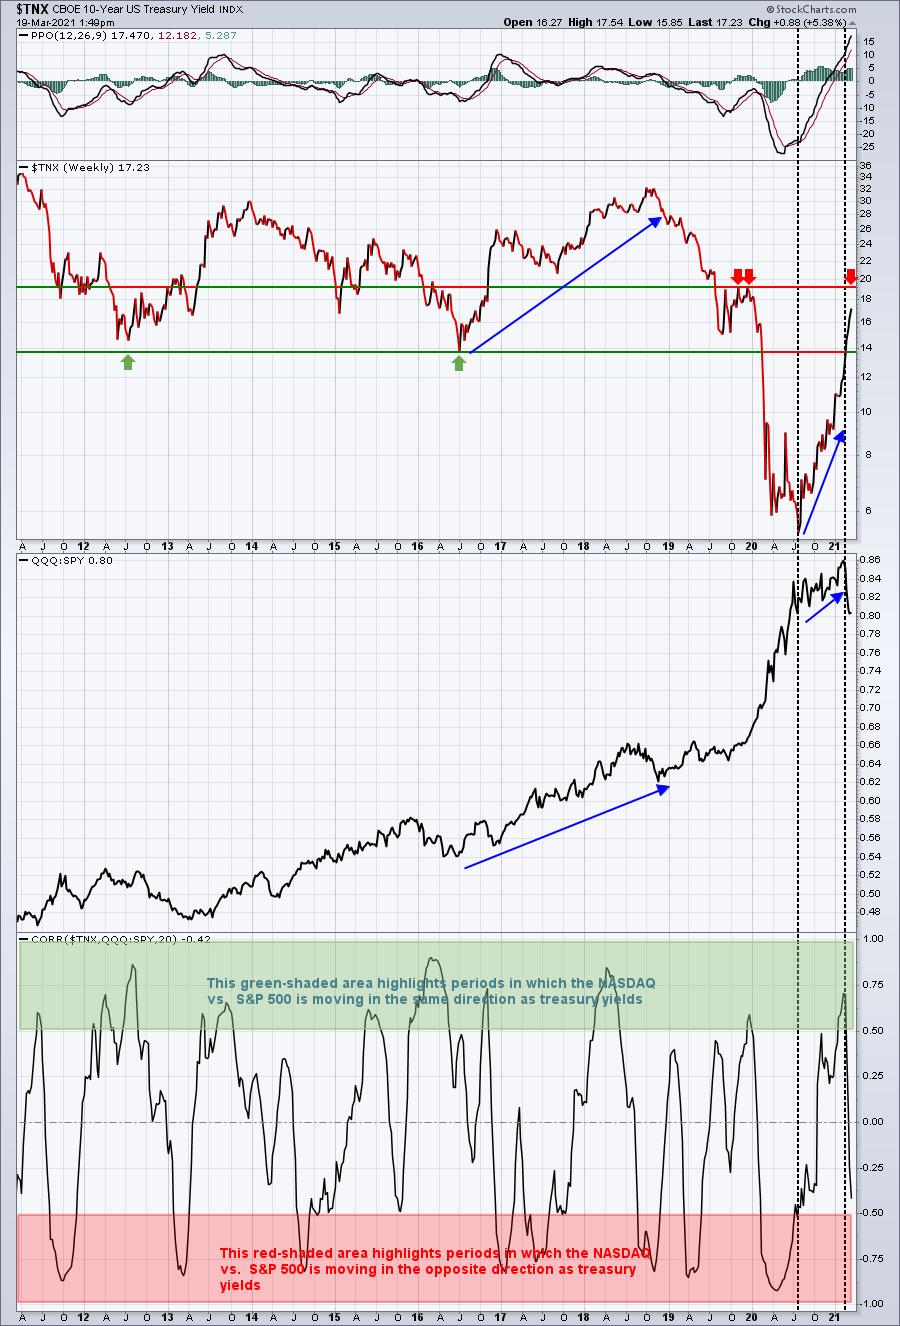
What this chart tells me is that the direction of treasury yields has no consistent correlation with how NASDAQ stocks perform vs. the S&P 500. So all of this "talk" about technology shares being in trouble as treasury yields rise has no chart support whatsoever. Look at the huge relative move by the NASDAQ from 2016 through 2018. It occurred with the 10-year treasury yield ($TNX) rising from 1.40% to 3.20% with GDP substantially lower than what we're expecting in 2021.
Sector/Industry Focus
For those expecting this bull market to come to an end, the XLY:XLP ratio, one of the most positively-correlated ratios to the S&P 500, would completely disagree:
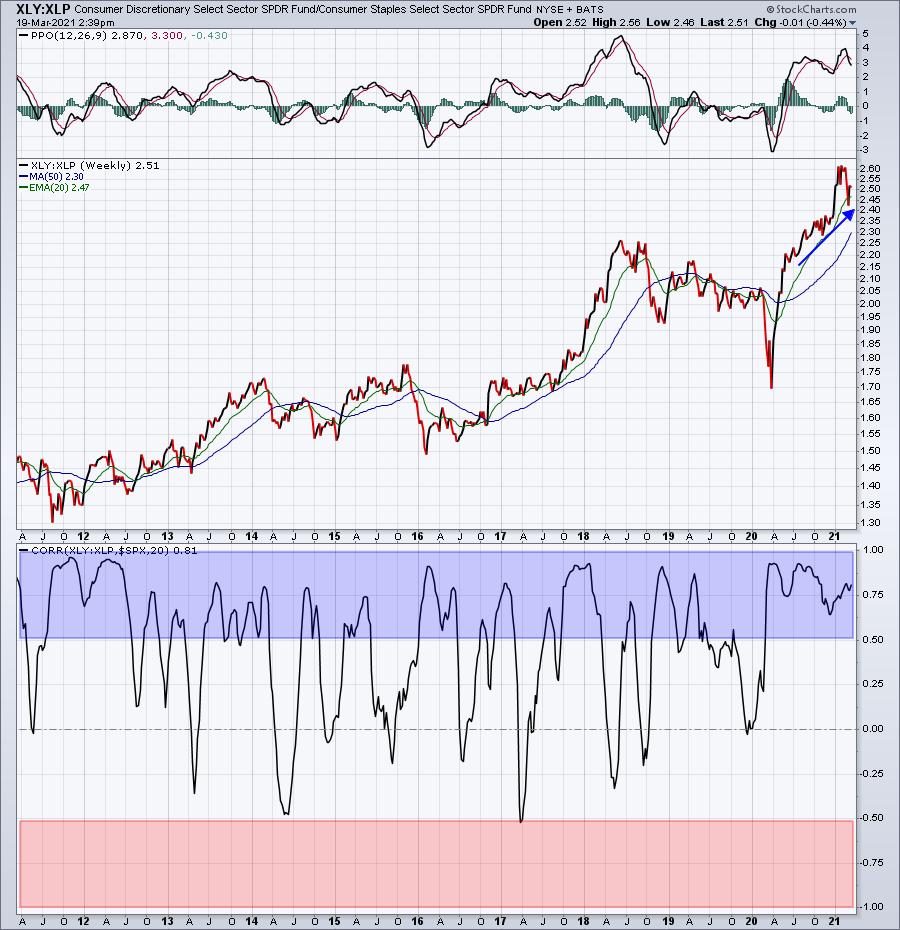
Unlike the QQQ:SPY chart earlier, can you see what positive correlation looks like? There are ZERO trips below -0.50 negative correlation. Yet the ratio nearly lives in the blue-shaded area that represents very strong positive correlation. While the XLY:XLP ratio has definitely pulled back in 2021, the overall uptrend is indisputable. In my opinion, this is one of the most, if not the most, important ratio to watch.
ChartLists/Strategies
Options expire today. One of our portfolio stocks - ZBRA - looks interesting to me as options expiration winds down today:
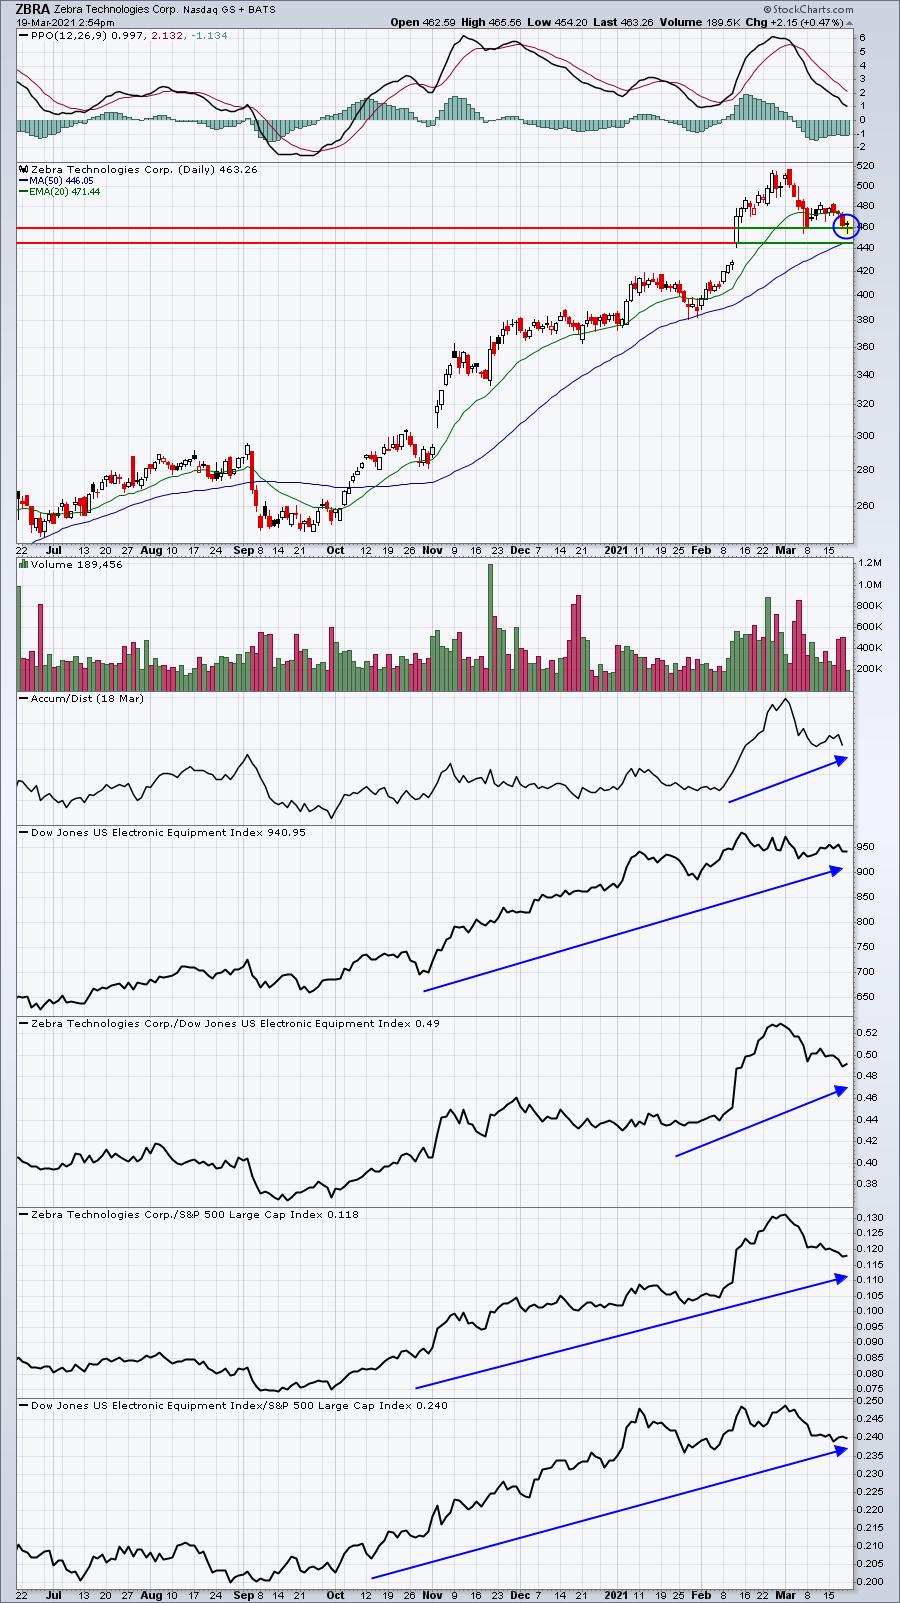
ZBRA has been a big winner, but has suffered from the selling in the technology area. I expect we'll see a rebound sooner rather than later.
Earnings Reports
Here are the key earnings reports for the next two days, featuring stocks with market caps of more than $10 billion. I also include a few select companies with market caps below $10 billion. Finally, any portfolio stocks that will be reporting results are highlighted in BOLD. If you decide to hold a stock into earnings, please understand the significant short-term risk that you are taking. Please be sure to check for earnings dates for any companies you own or are considering owning.
Friday, March 19:
ERJ
Monday, March 22:
TME, SNX
Economic Reports
None
Happy trading!
Tom