
EB Daily Market Report - Monday, March 22, 2021
Executive Market Summary
- Futures were mixed as the Dow Jones opened lower, while NASDAQ stocks showed strength
- That theme has continued as technology (XLK, +2.21%) leads all sectors
- The 10-year treasury yield ($TNX) is down 5 basis points to 1.68%, putting pressure on financial stocks (XLF, -1.54%)
- Consumer stocks - both discretionary (XLY, +1.07%) and staples (XLP, +0.69%) - are outperforming
- Commodity prices are mostly lower, albeit fractionally, despite a lower dollar
- Tesla (TSLA, +6.51%) and Applied Materials (AMAT, +4.85%) are 2 of the top 3 S&P 500 components
- Kansas City Southern (KSU, +11.62%) is soaring after Canadian Pacific (CP, -4.59%) announced plans to acquire the railroad for $29 billion in stock and cash
Market Outlook
Banks ($DJUSBK) are struggling today for two reasons. First, treasury yields are down and that typically results in bank selling pressure. Second, many banks had net in-the-money calls last week and a good portion of them likely were exercised, meaning that market makers take short positions. Well, we know where stocks tend to move short-term if market makers are shorting. But as I show the chart below, focus on the spread between the 10-year treasury yield and the 2-year treasury yield, as this is the primary driver of bank stocks from a longer-term perspective:
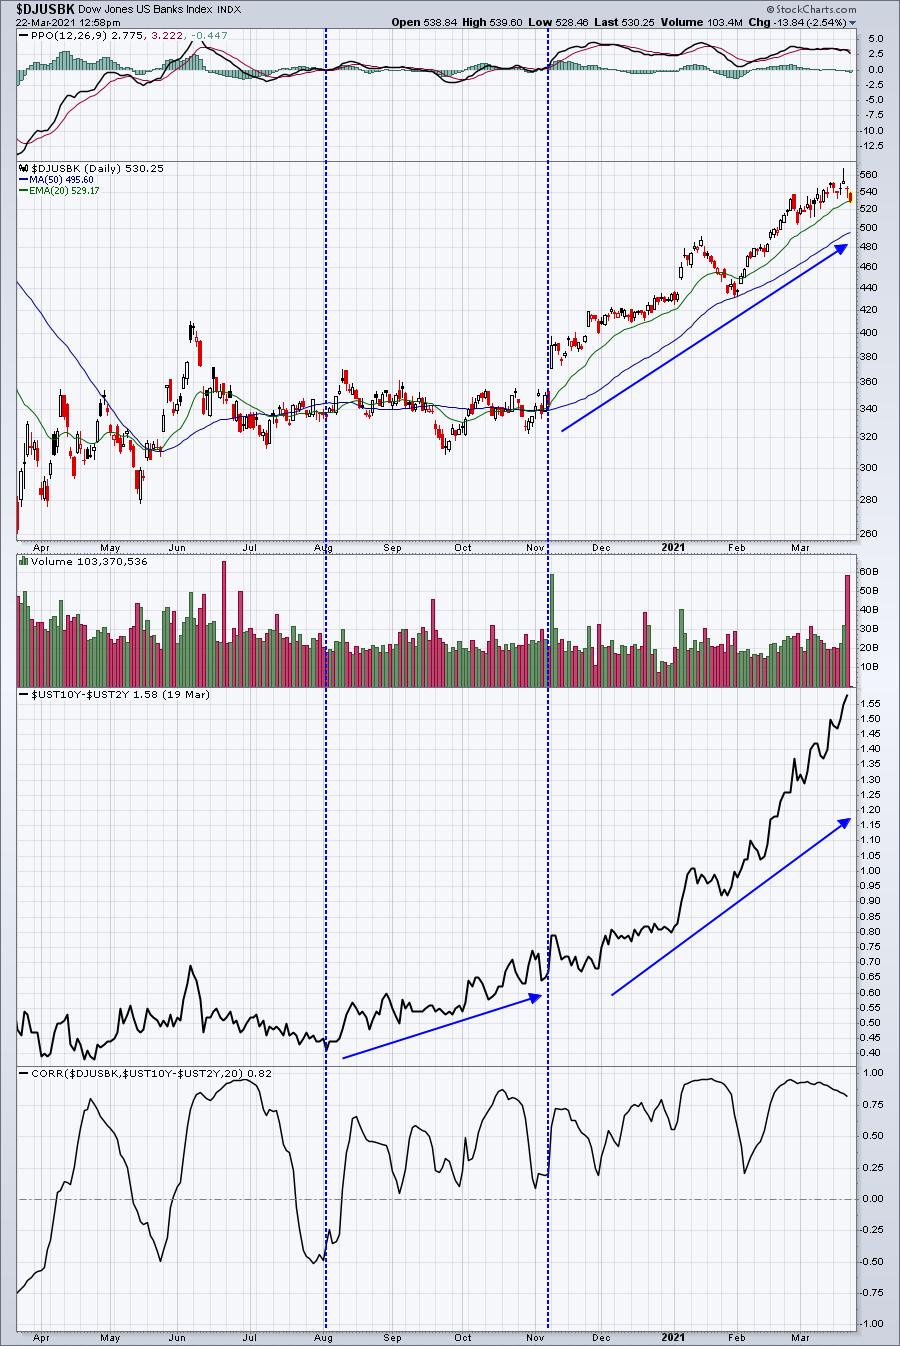
Banks got rolling with two pieces of its puzzle coming together. First, beginning in August, the spread between the 10-year and 2-year treasuries increased. Second, the positive vaccine news in November resulted in significant rotation into stocks that had struggled during the pandemic. I expect that we'll see higher yields down the road, which will, in turn, aid financials on a relative basis. I'd look for continuing outperformance in 2021, though the short-term could be a bit dicey given the recent advance.
Sector/Industry Focus
Both the NASDAQ and technology show very bullish inverse head & shoulders patterns in play. They don't confirm until the neckline is cleared. However, in a secular bull market, I always look for bullish outcomes, so I'm expecting to see this neckline cleared - probably sooner rather than later given that earnings season is rapidly approaching:
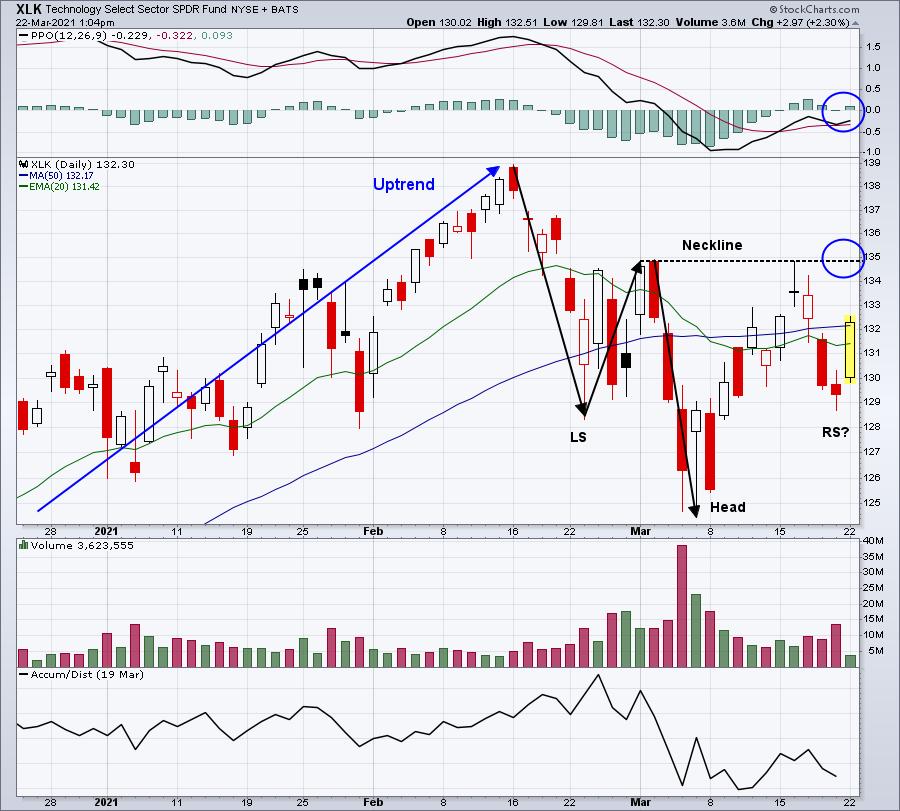
While this pattern is certainly promising, there are absolutely no guarantees we see the pattern confirm with a breakout. We absolutely could make another trip down to 125 and a rectangular consolidation pattern could result. I am beginning to feel like the low during the first week of March is THE intermediate-term low. I'm doubting that we see another move below that level.
ChartLists/Strategies
Here are two stocks from our Strong Earnings ChartList that are testing key short-term support:
BYD:
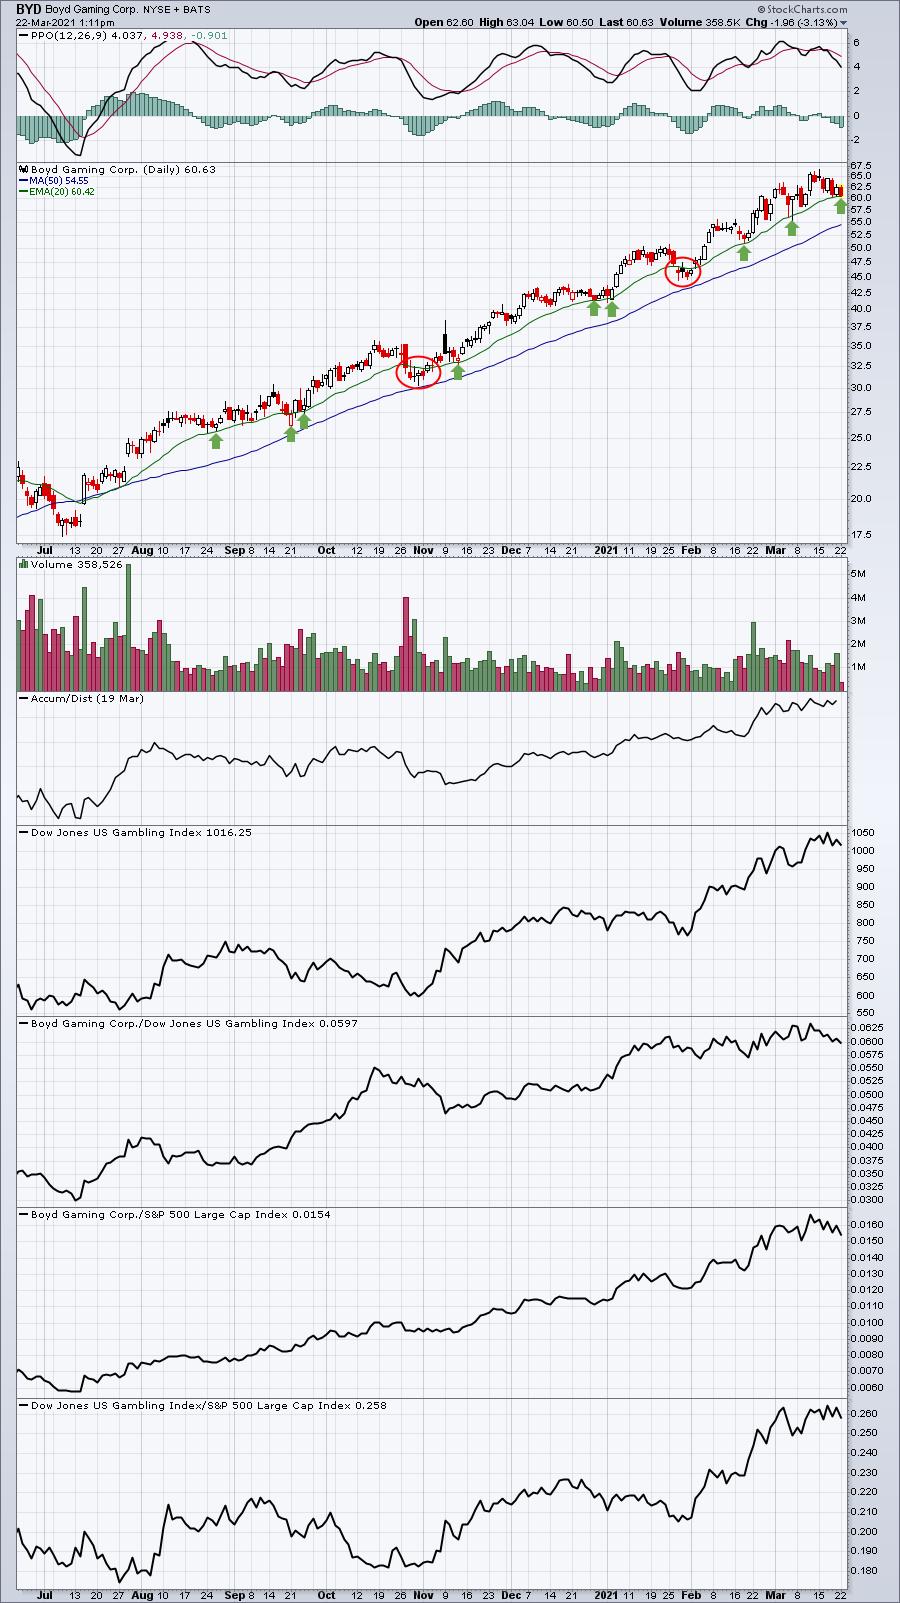
It's always difficult to predict whether a key support level will hold, but the rising 20 day EMA has a solid track record for BYD. I've circled in the red the two times in recent memory where BYD traded below its 20 day EMA temporarily, but the green arrows mark all the successful tests.
TPR:
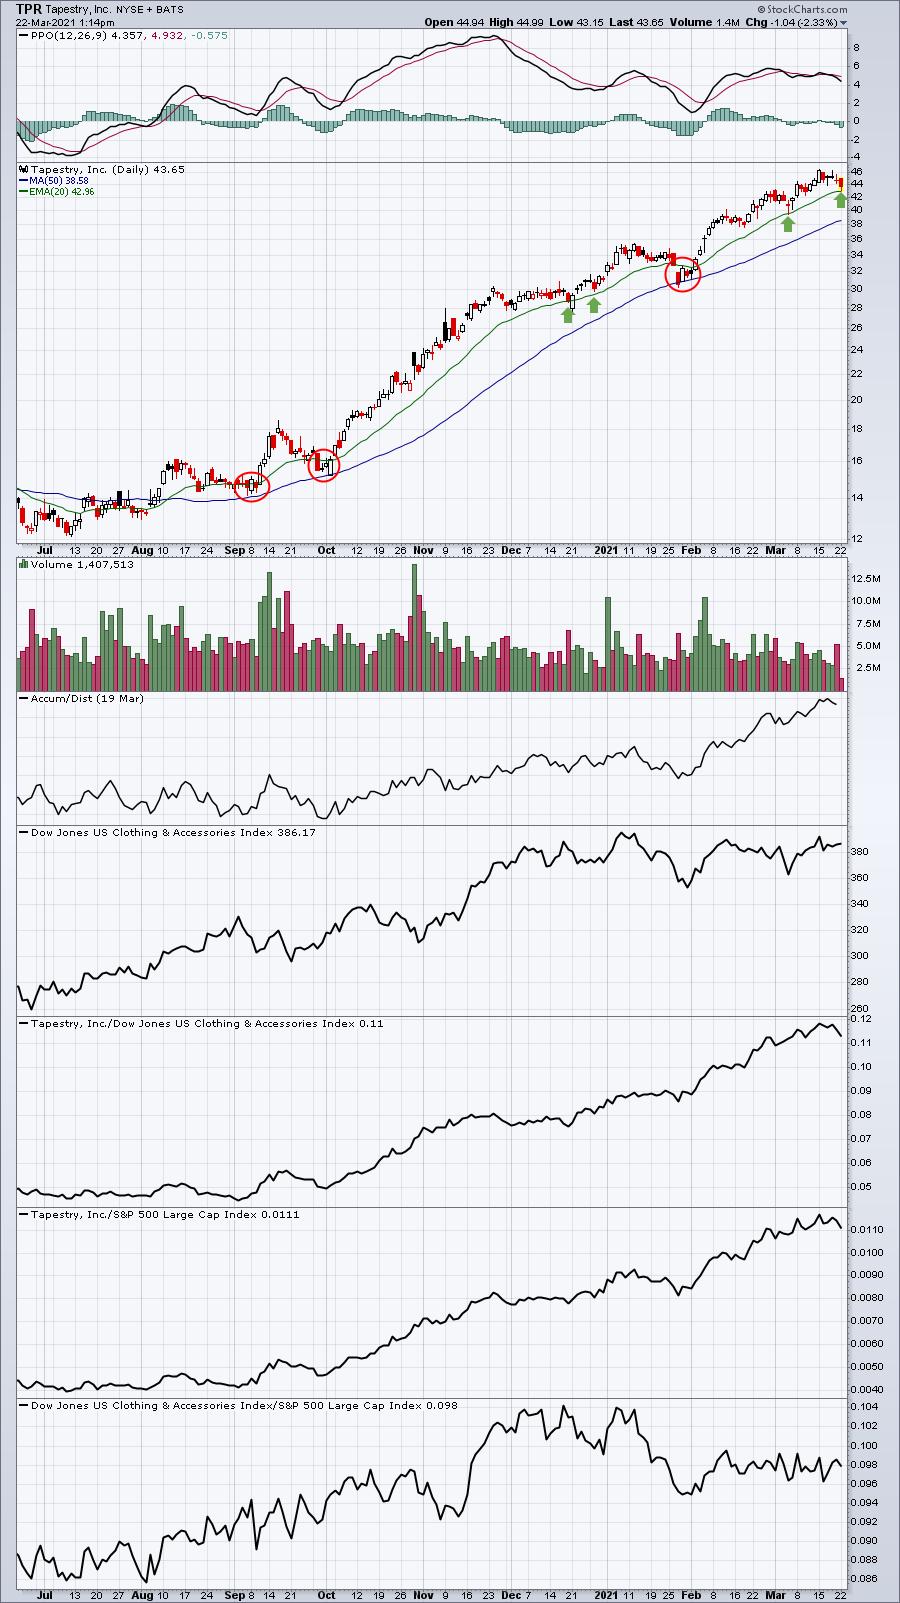
TPR is one of our portfolio stocks. It's been so strong that it's had few 20 day EMA tests. The red circles highlight a few occasions where we've seen 50 day SMA tests. Nonetheless, the AD line here is strong and relative strength has been undeniable. I'd expect a bounce, but a closing stop beneath the 20 day EMA could be used to keep any loss minor.
Earnings Reports
Here are the key earnings reports for the next two days, featuring stocks with market caps of more than $10 billion. I also include a few select companies with market caps below $10 billion. Finally, any portfolio stocks that will be reporting results are highlighted in BOLD. If you decide to hold a stock into earnings, please understand the significant short-term risk that you are taking. Please be sure to check for earnings dates for any companies you own or are considering owning.
Monday, March 22:
TME, SNX
Tuesday, March 23:
ADBE, INFO, GME, VNET, HOME, AIR
Economic Reports
February existing home sales: 6,220,000 (actual) vs. 6,500,000 (estimate)
Happy trading!
Tom