
EB Daily Market Report - Tuesday, March 23, 2021
Executive Market Summary
- Futures were mixed with the Dow Jones and S&P 500 lower this morning, while the NASDAQ gained slightly
- That relative strength on NASDAQ stocks has held throughout much of the day, though bulls have had little success building on any intraday strength
- February new home sales were much weaker than expected, one day after a similar fate for existing home sales
- Home construction ($DJUSHB, -0.41%), surprisingly, is down just fractionally despite those two bad reports
- The U.S. Dollar (UUP, +0.57%) is strong again today as materials (XLB, -1.97%) and energy (XLE, -1.24%) both struggle on a relative basis
- Strength is found in defensive areas today with consumer staples (XLP, +0.82%) breaking out and trailing only utilities (XLU, +1.85%) on the session
- Cruise lines dominate the S&P 500 laggard board as CCL and NCLH are both lower by more than 7%
Market Outlook
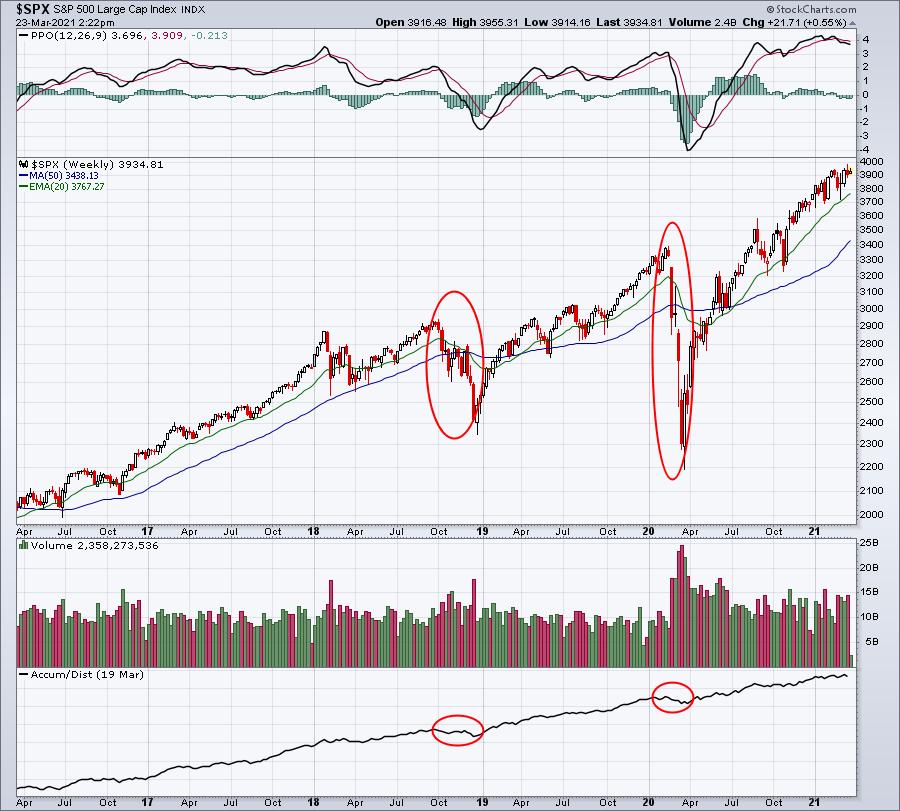
Today marks the 1-year anniversary of the COVID-induced low on the S&P 500 of 2191.86. We're now some 1740 points higher, or approximately 80%. The NASDAQ 100 ($NDX) has gained nearly 100% over the past year. The following long-term weekly charts of each shows the 2020 selloff, which is becoming more and more of a distant memory:
S&P 500:
NASDAQ 100:
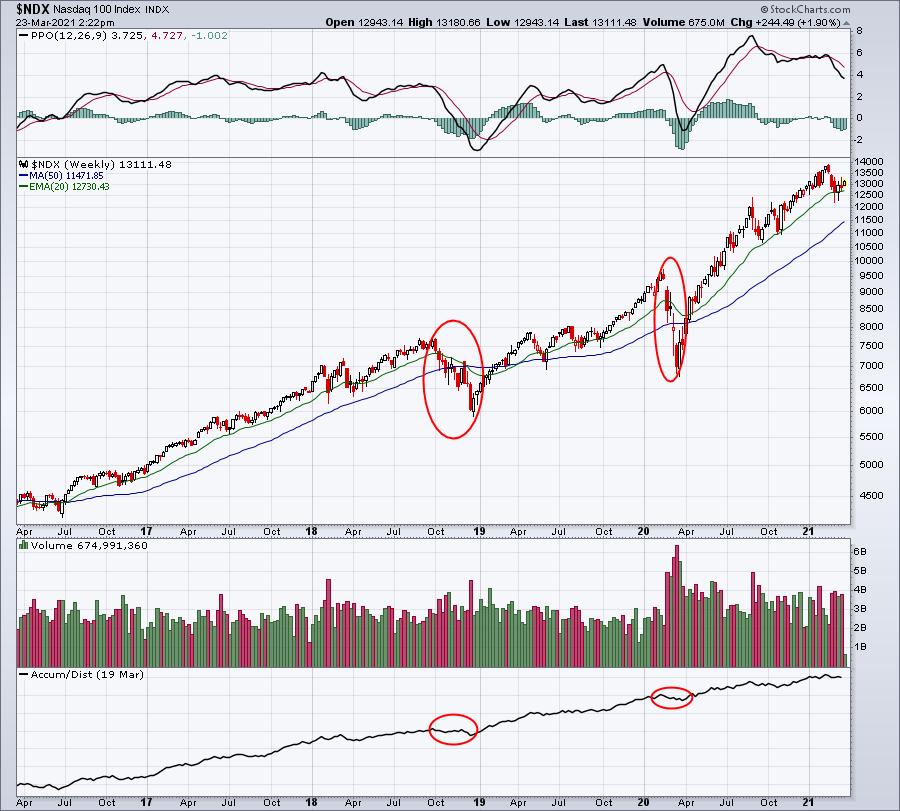
One of our biggest clues that the selling in March 2020 would not stick and lead to a deeper bear market was the fact that the AD line on both indices shrugged off the selling as institutions were gladly buying the shares of panicked sellers.
Sector/Industry Focus
The bulls and bears have drawn their lines in the sand when it comes to specialty retailers ($DJUSRS):
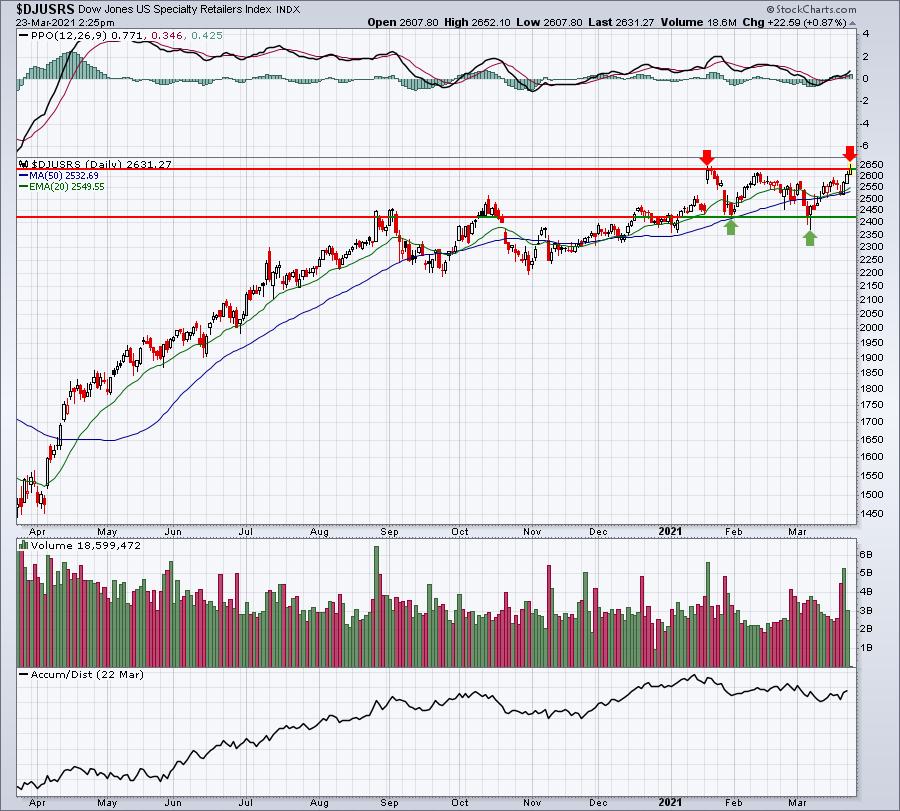
The key closing resistance level is 2628.90. The DJUSRS touched 2652, but has fallen back to 2631. While a false breakout means little longer-term, I would view failure today to signal a pullback near-term. The current trading range is from roughly 2420 to 2628.
ChartLists/Strategies
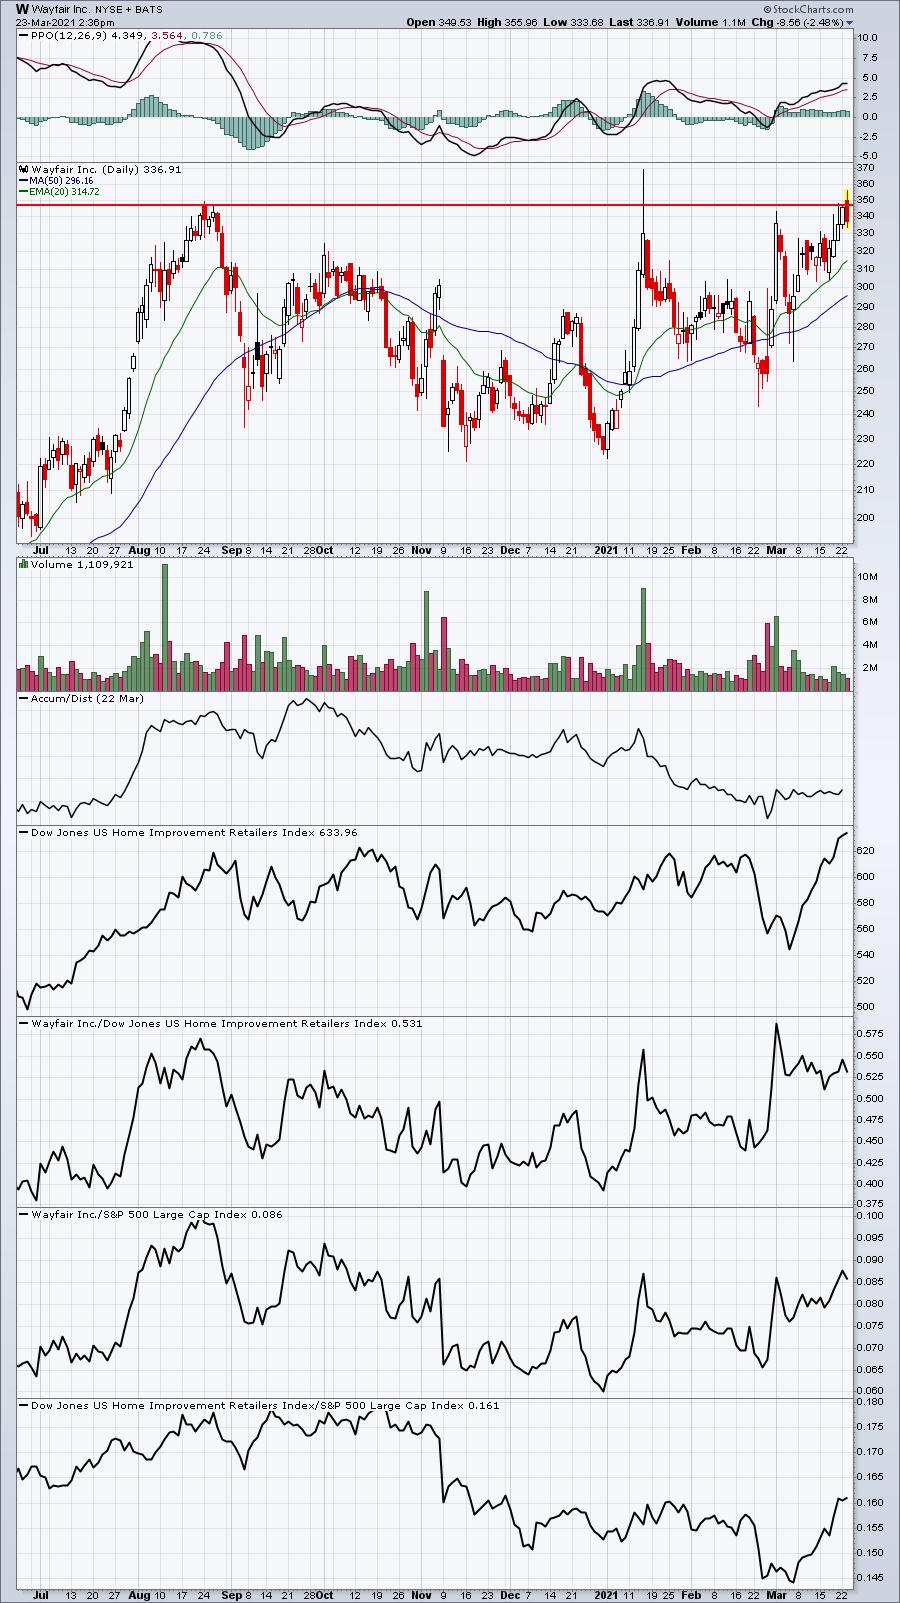
Barring final hour recoveries, here are two stocks that are showing false breakouts today:
W:
TXN:
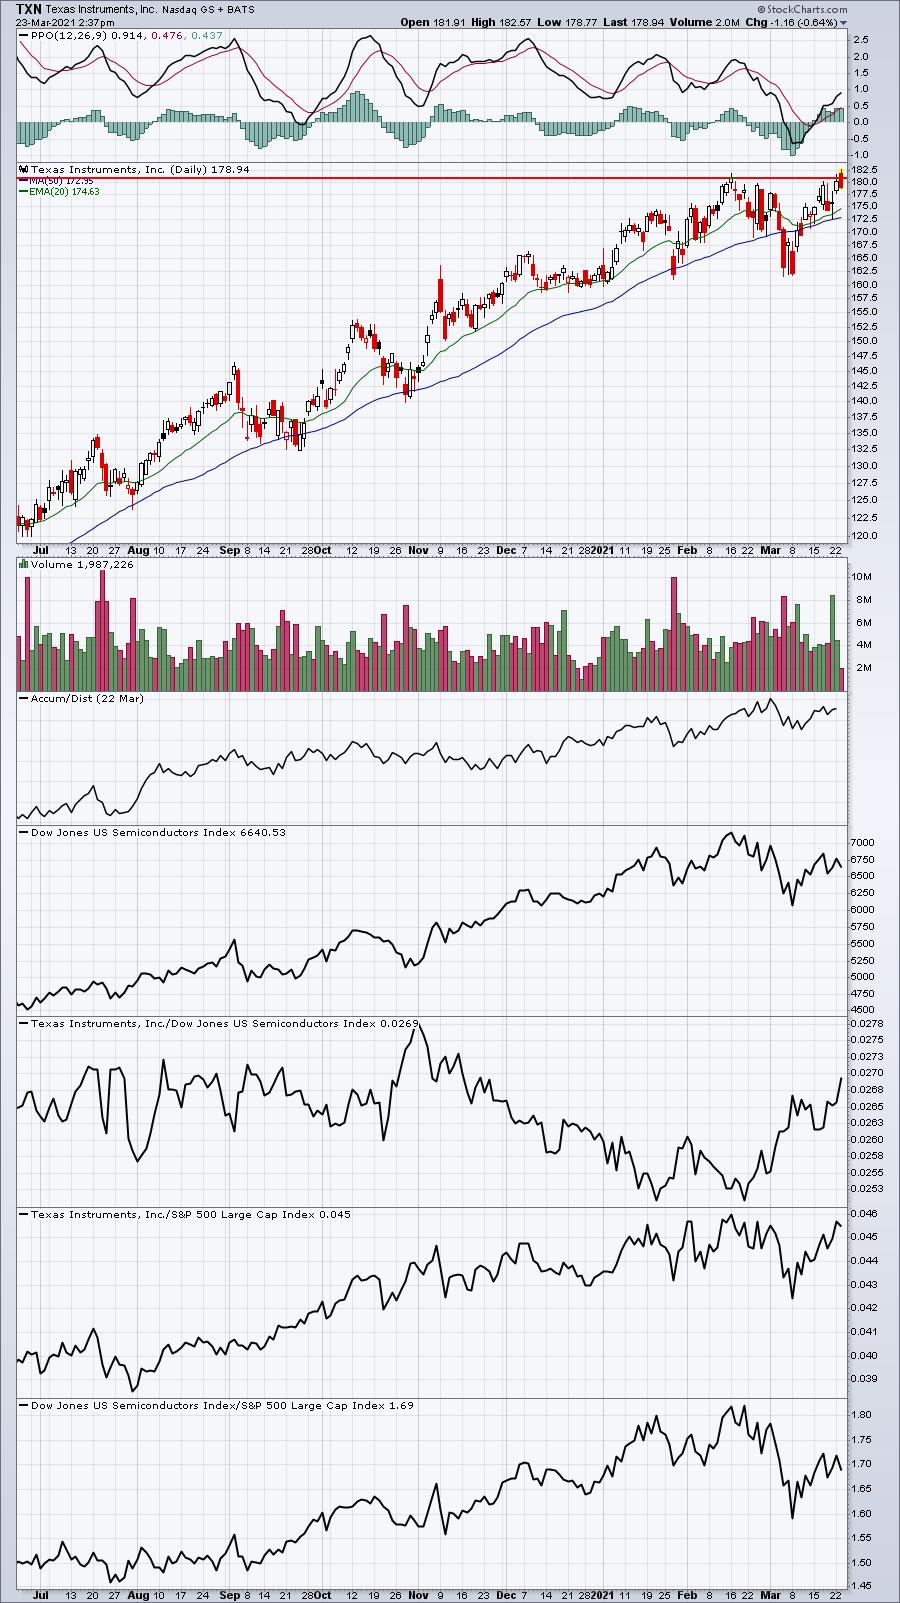
If you notice, both of these stocks gapped up above prior high candle bodies. A strong final-hour finish on either or both of these stocks would be bullish. But weakness in the final hour would result in a bearish reversing candlestick. I believe both of these stocks eventually goes higher, but a short-term trader looking to commit capital elsewhere during a short-term pullback should be watching these two closely in the final 60 minutes.
Earnings Reports
Here are the key earnings reports for the next two days, featuring stocks with market caps of more than $10 billion. I also include a few select companies with market caps below $10 billion. Finally, any portfolio stocks that will be reporting results are highlighted in BOLD. If you decide to hold a stock into earnings, please understand the significant short-term risk that you are taking. Please be sure to check for earnings dates for any companies you own or are considering owning.
Tuesday, March 23:
ADBE, INFO, GME, VNET, HOME, AIR
Wednesday, March 24:
GIS, HTHT, RH, KBH, WOR, FUL, WGO, GRWG
Economic Reports
February new home sales: 775,000 (actual) vs. 875,000 (estimate)
Happy trading!
Tom