
EB Daily Market Report - Wednesday, March 24, 2021
Executive Market Summary
- Futures were higher as we opened this morning
- We've seen mostly weakness since the open, particularly among NASDAQ stocks and growth names
- Communication services (XLC, -1.84%) is the worst performing sector, followed by consumer discretionary (XLY, -0.69%), and technology (XLK, -0.55%)
- The 10-year treasury yield ($TNX) has fallen another 2 basis points to 1.61%, so it appears that recent selling in aggressive areas has something to do with seasonality as well as interest rates
- ViacomCBS (VIAC, -22.37%) is by far the worst S&P 500 performer after announcing a secondary offering
- Applied Materials (AMAT, +6.13%) is benefiting from Intel's (INTC, -1.20%) announcement that they're planning to invest $20 billion in two Arizona factories to boost capacity
- Crude oil ($WTIC, +5.47%) has jumped $3 and is now back above $60 per barrel, helping to lift energy shares (XLE, +2.82%)
Market Outlook
The U.S. Dollar (UUP) is making another high today and pushing to a 4-month high, likely reflecting the stronger economic activity expected later this year. The 10-year treasury yield ($TNX) here in the U.S. vs. the German 10-year treasury yield has been suggesting that a rise in the dollar was coming. Now we're beginning to see it manifest. As I've pointed out on many occasions, a rising dollar is not good for materials and energy on a relative basis. They've both been strong year-to-date, especially energy, but just be aware of the rising dollar. Sticking with energy, in particular, on a short-term basis is fine. However, if the group begins to break down, I'd exit. Here's a 10-year weekly chart to illustrate the relative weakness in both sectors when the dollar is rising:
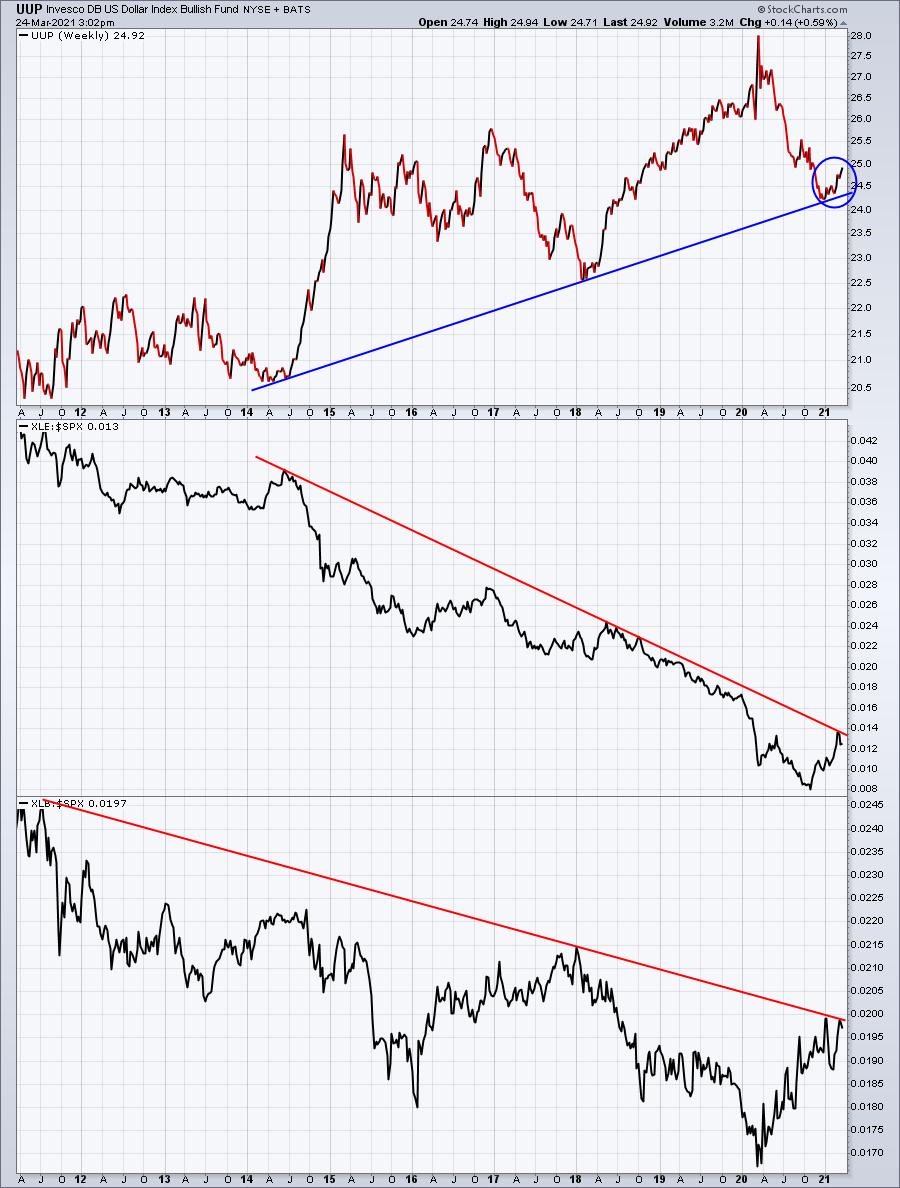
I don't own any energy or materials stocks personally, but if I did, I'd simply make sure I kept my stops in place. I expect that we'll see most sectors, industry groups, and individual stocks move higher over the next year, but relative strength will be key. At this point in time, and based on all the information currently available, I'm expecting both energy and materials to underperform on a relative basis.
Sector/Industry Focus
I want to follow up on the specialty retailers ($DJUSRS) chart from yesterday as the difference between a breakout and a false breakout depends on where we close. The DJUSRS had a closing high of 2628.90 on January 20th and yesterday hit a high of 2652.10. At the time of yesterday's DMR, the DJUSRS was trading just above that breakout level and I suggested that we watch to see what happened into the close. A false breakout USUALLY results in further short-term selling as market makers are likely the sellers that create that false breakout. As prices decline, market makers buy back into that decline. Here's what that chart looks like today:
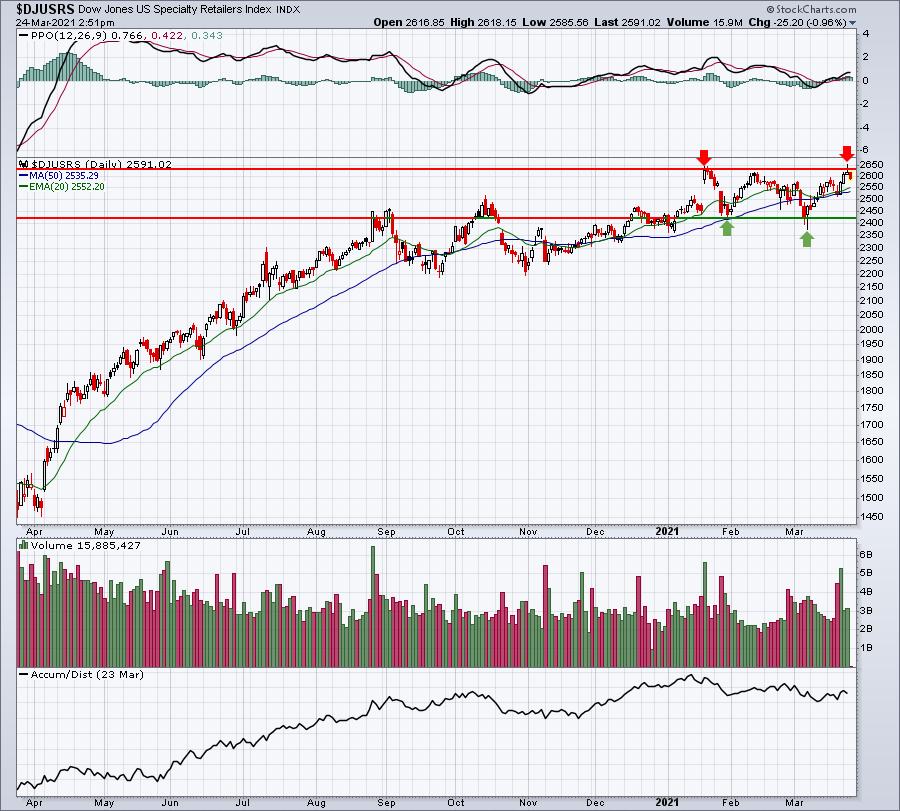
Today, it's much more obvious to see that "tail" where price action exceeded the prior high candle body. But after the failure into the close, we're seeing more selling in the specialty retail space. If it continues to pull back, the next critical support level will be the rising 20 day EMA, currently at 2552.
ChartLists/Strategies
I haven't discussed the Short Squeeze ChartList, so I ran through the 40 charts in our current list and found the following charts interesting:
CLVS:
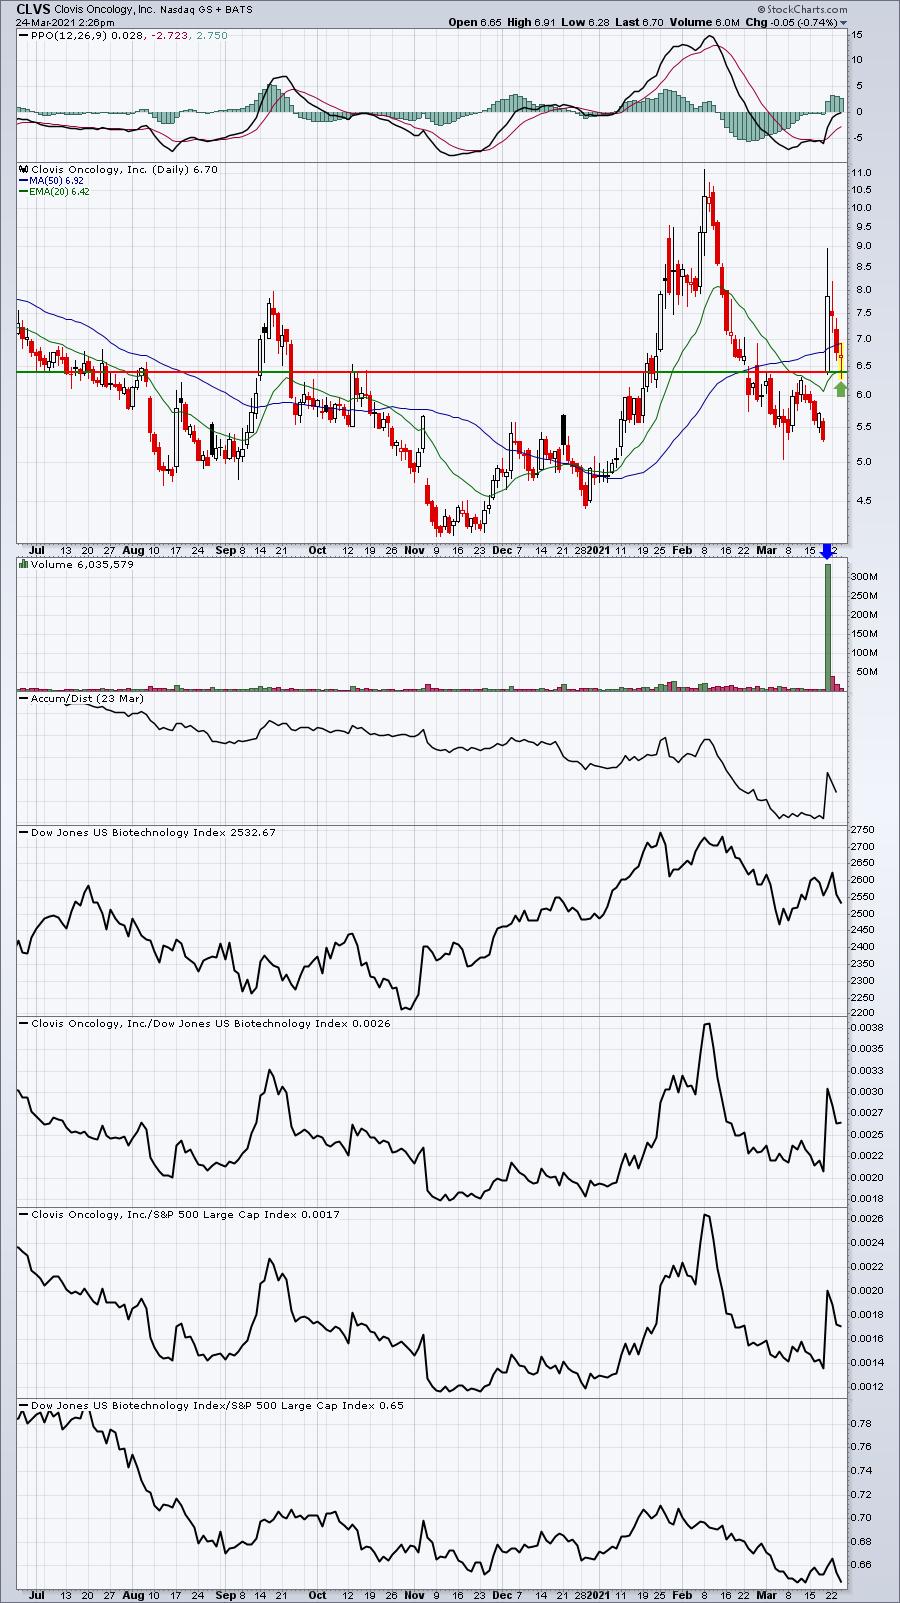
Ordinarily, I prefer buying short squeeze stocks on breakouts, but there are honestly none on our list that really qualify right now, other than perhaps RUBY, which broke out a week or so ago. So CLVS and the others are being considered on key tests of support. CLVS traded over 300 million shares last Friday, opening at 6.40 before trading as high as 8.95 later that day. It's worked its way all the way back to 6.40 (actually just below) before reversing today. It would seem to have more upside from its currently level, although a close beneath 6.40 would bother me.
GSX:
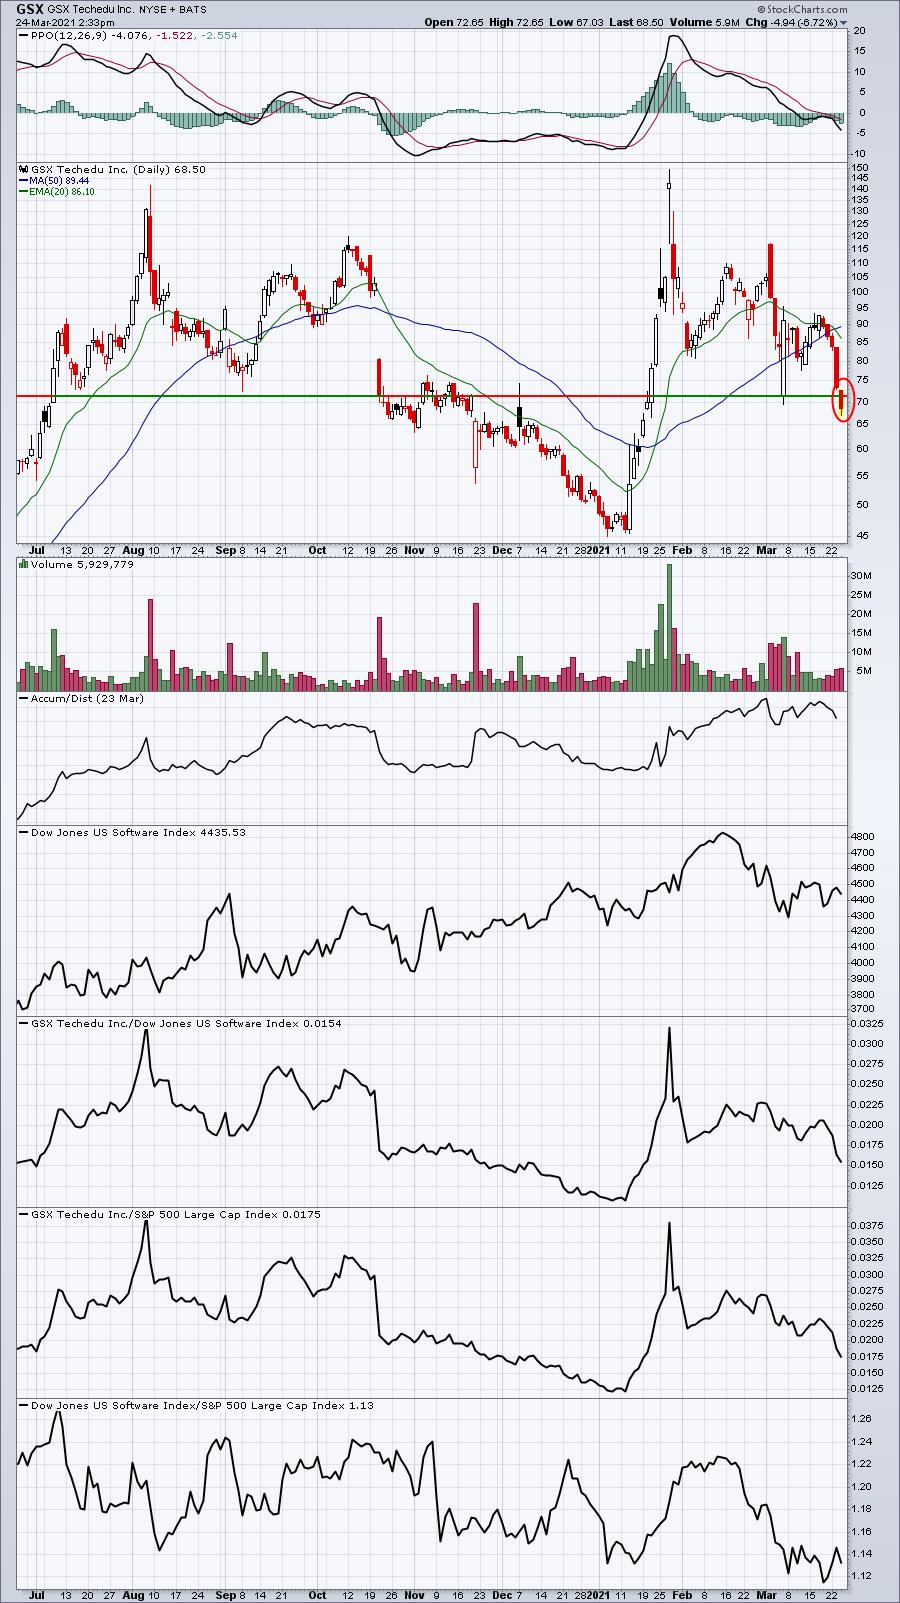
GSX is breaking down intraday, but the key will be where it closes. It's already cleared that prior low from March 5th at 69.44. If it were to reverse in the final hour and close back above 71.50, it could mark a significant short-term low. A close below, however, could lead to further selling.
APT:
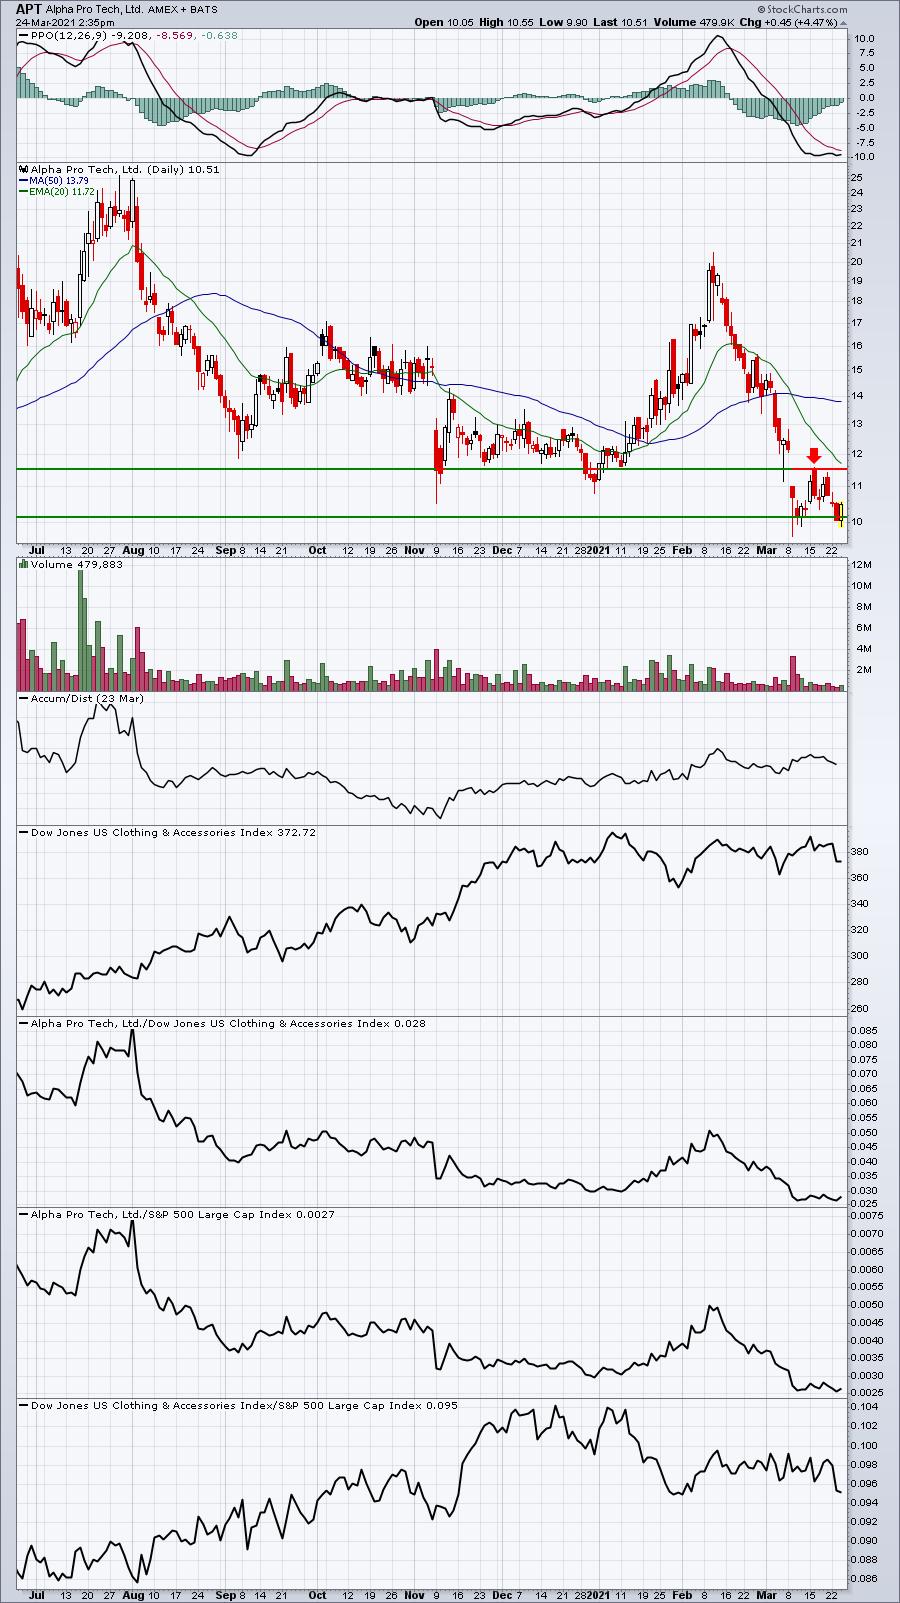
APT closed yesterday at 10.06, which was beneath the prior candle body low of 10.17. It's rebounded back above that level today, however, and is poised for a further run to the 11.25-11.50 area. Be very careful on any close beneath 9.87, though, as that was a key closing low back on June 5th (not reflected on above 9 month chart).
All of these potential trades are high risk and not suited for everyone. Please consider your own risk tolerance before trading.
Earnings Reports
Here are the key earnings reports for the next two days, featuring stocks with market caps of more than $10 billion. I also include a few select companies with market caps below $10 billion. Finally, any portfolio stocks that will be reporting results are highlighted in BOLD. If you decide to hold a stock into earnings, please understand the significant short-term risk that you are taking. Please be sure to check for earnings dates for any companies you own or are considering owning.
Wednesday, March 24:
GIS, HTHT, RH, KBH, WOR, FUL, WGO, GRWG
Thursday, March 25:
DRI, YY, SAIC, MOMO, PRGS, BLNK
Economic Reports
February durable goods: -1.1% (actual) vs. +0.8% (estimate)
February durable goods ex-transports: -0.9% (actual) vs. +0.6% (estimate)
March PMI composite: 59.1 (actual) vs. 59.0 (estimate)
Happy trading!
Tom