
EB Daily Market Report - Friday, April 9, 2021
ChartLists Updated
The Strong Earnings ChartLists, Strong Future Earnings ChartList, and Raised Guidance Chartlists have all been updated. We should have the links on our website updated later today, or over the weekend at the latest.
Executive Market Summary
- Futures were mixed with relative weakness on the NASDAQ at the opening bell
- Our major indices have moved mostly higher throughout the session, ignoring short-term negative divergences on hourly charts
- Commodities are lower today with silver ($SILVER) down slightly more than 1%
- The 10-year treasury yield ($TNX) continues to consolidate in a 1.63%-1.75% range; it's higher by 3 basis points to 1.67%
- In an odd twist, health care (XLV, +0.62%) is atop the sector leaderboard, while energy (XLE, -0.66%) is weak again
- Home construction ($DJUSHB, +2.64%) is the best performing industry group, helping to lead consumer discretionary (XLY, +0.54%) higher
- Honeywell (HON, +2.82%) and Unitedhealth Group (UNH, +2.70%) are today's leading stocks on the Dow Jones
Market Outlook
The following is an update of the growth vs. value chart (IWF:IWD). We've seen money rotate back towards growth stocks thus far in April. I expect that to continue as we move throughout earnings season:
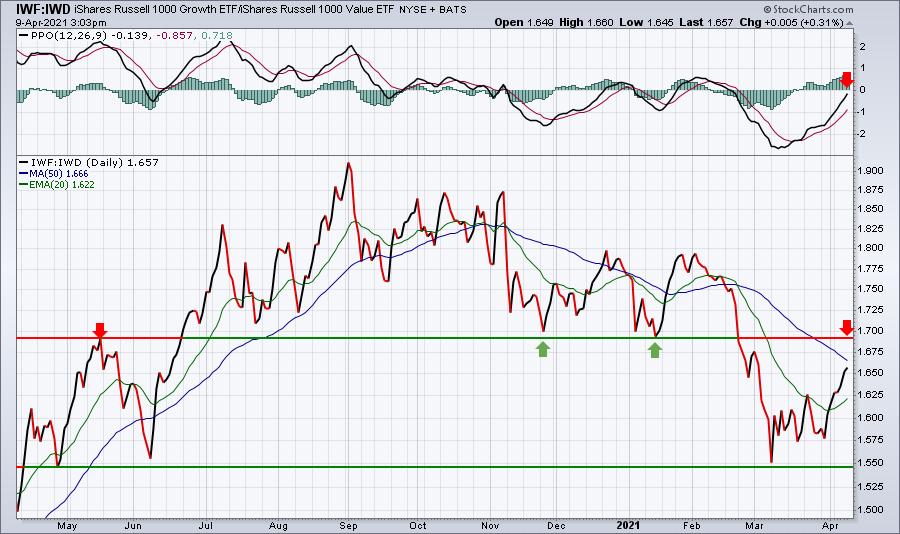
If you recall, it was the 1.69 relative ratio support level that we were watching a few months ago. Well, we're making a run back toward that level from underneath now. A definitive break above 1.69-1.70 would be very bullish for equities, particularly growth stocks.
Sector/Industry Focus
I also like to follow the consumer stocks ratio - discretionary (XLY) vs. staples (XLP) - as it provides us a clue as to whether the market is in a risk-on mode (XLY:XLP ratio rises) or risk-off mode (XLY:XLP ratio declines). Here's the latest on this ratio:
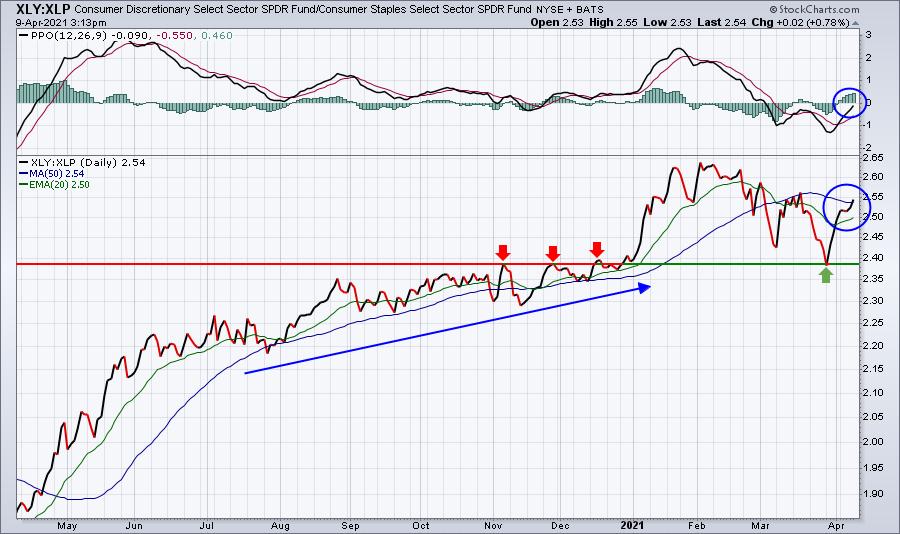
Relative resistance was approximately 2.39 as we tested that level multiple times in late 2020 before finally breaking out definitively above it. In March, when value and defensive stocks were in favor, this ratio fell back to test that breakout level. It's now recovering strongly as the relative PPO threatens a centerline breakout.
This is very bullish action and a breakout above the February high would be the ultimate bullish signal.
ChartLists/Strategies
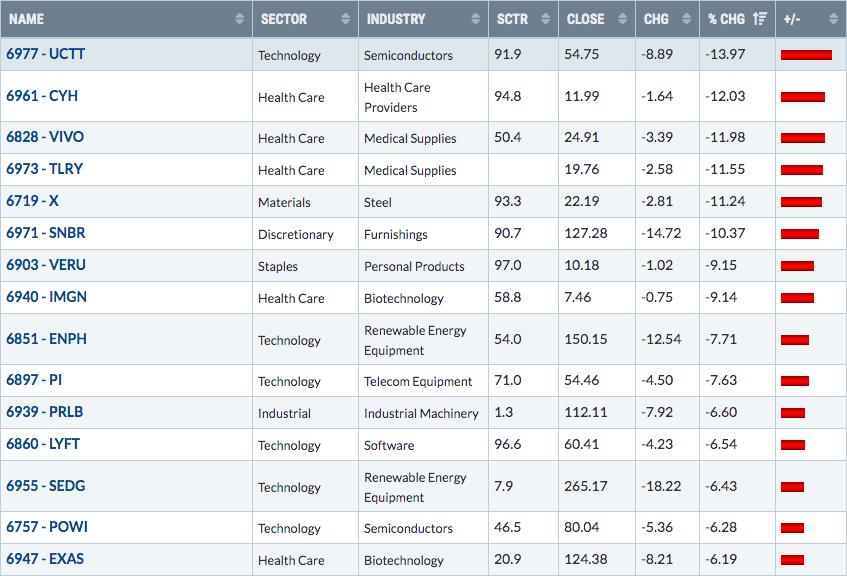
I used the Summary feature on StockCharts.com to analyze the worst performing stocks on our two Strong Earnings ChartLists over the past week to see if any of these recent underperformers are setting up as a solid reward to risk trade. Here were the worst performers on each ChartList:
SECL #1:
SECL #2:
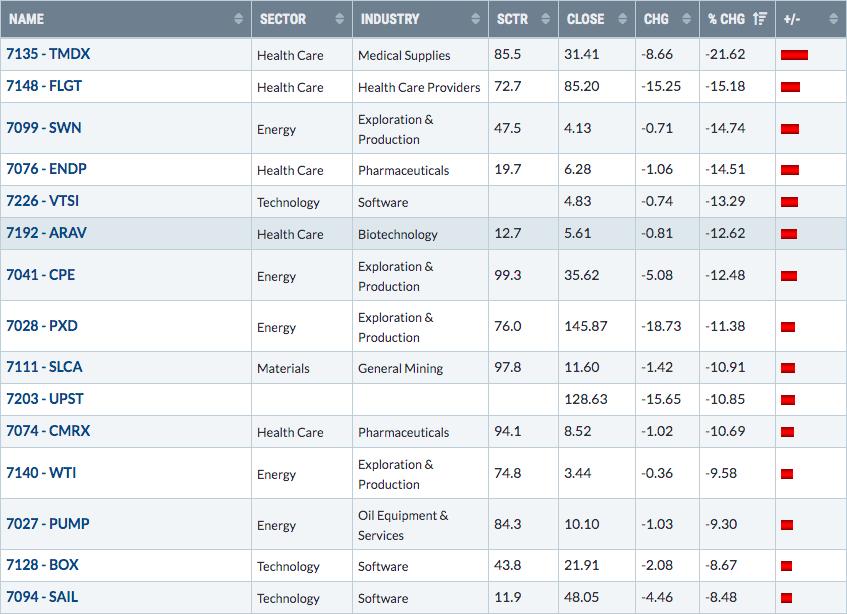
These are the worst 15 performers on each ChartList over the past week. I looked at all 30 charts and found the following as possible trade candidates, looking for a rebound sooner rather than later:
WTI:
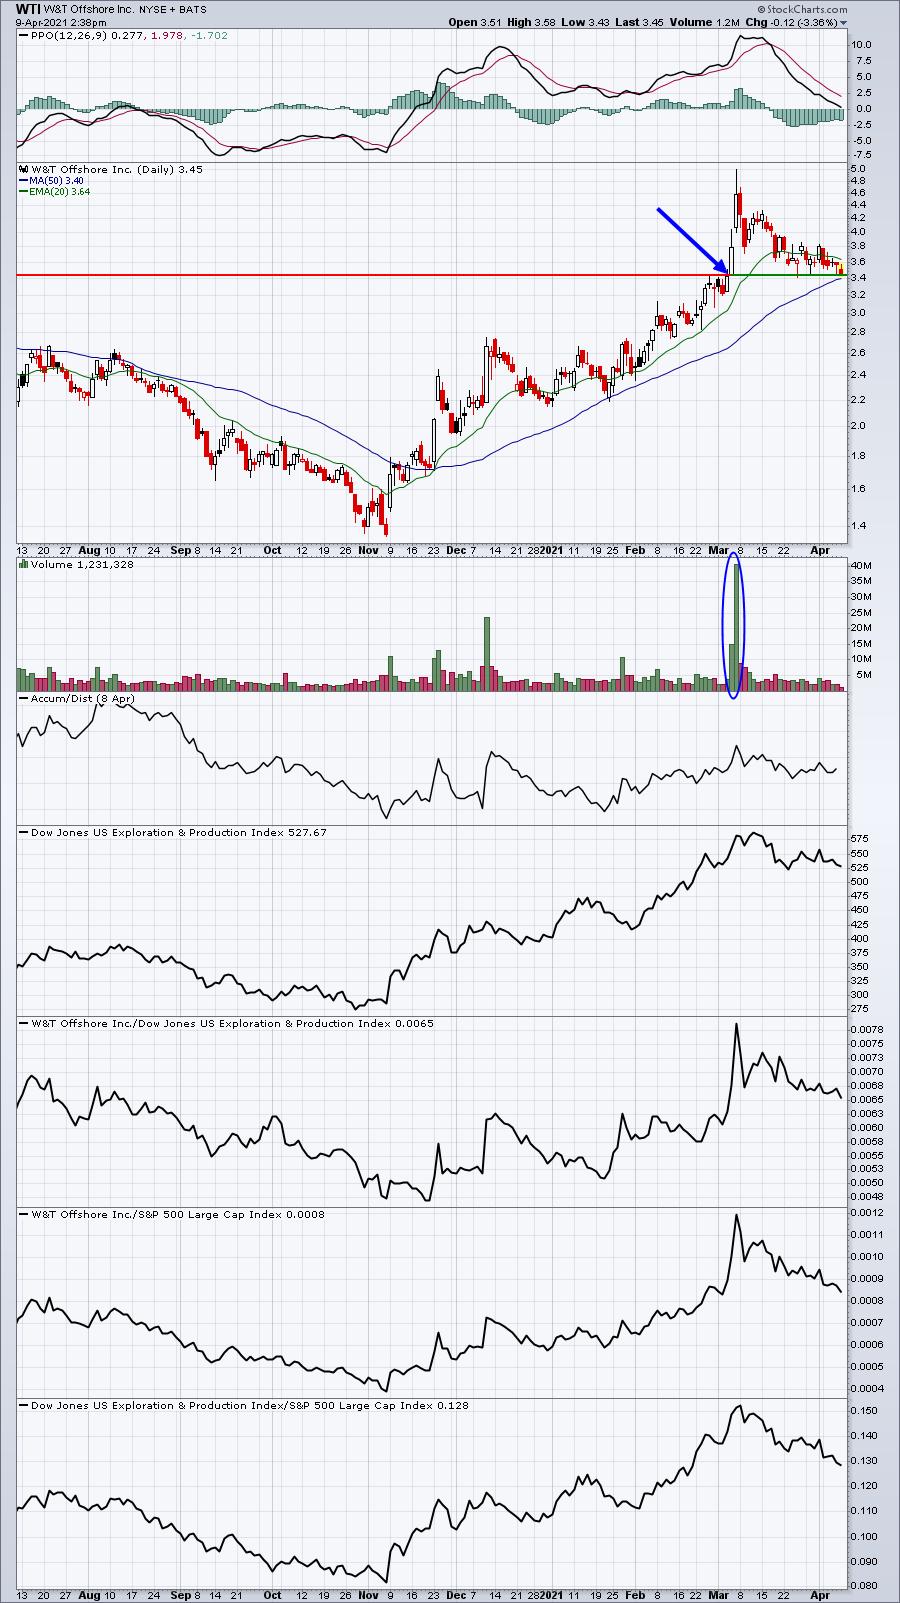
Volume had poured into WTI from roughly 3.45 to 5.00, but it has since pulled back to that 3.45 level again on much lighter volume. The 50 day SMA, currently at 3.40, should also offer up some support for longs.
FLGT:
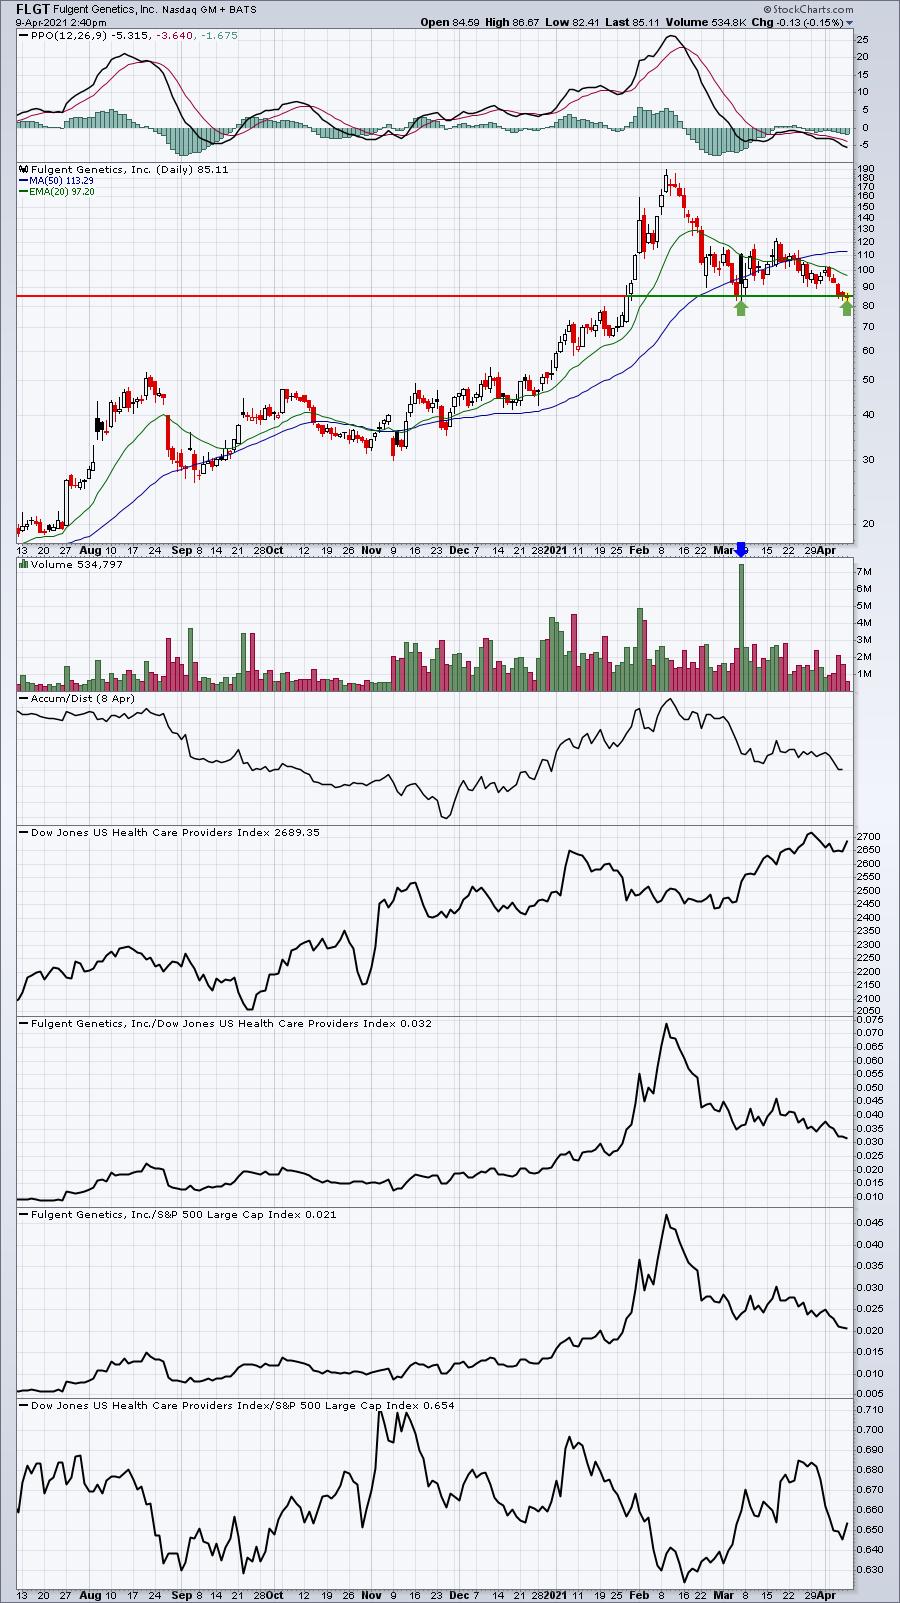
Note the early gap higher in March on very heavy volume. FLGT has worked its way back to gap support. I'd look for a turn here or exit quickly.
VTSI:
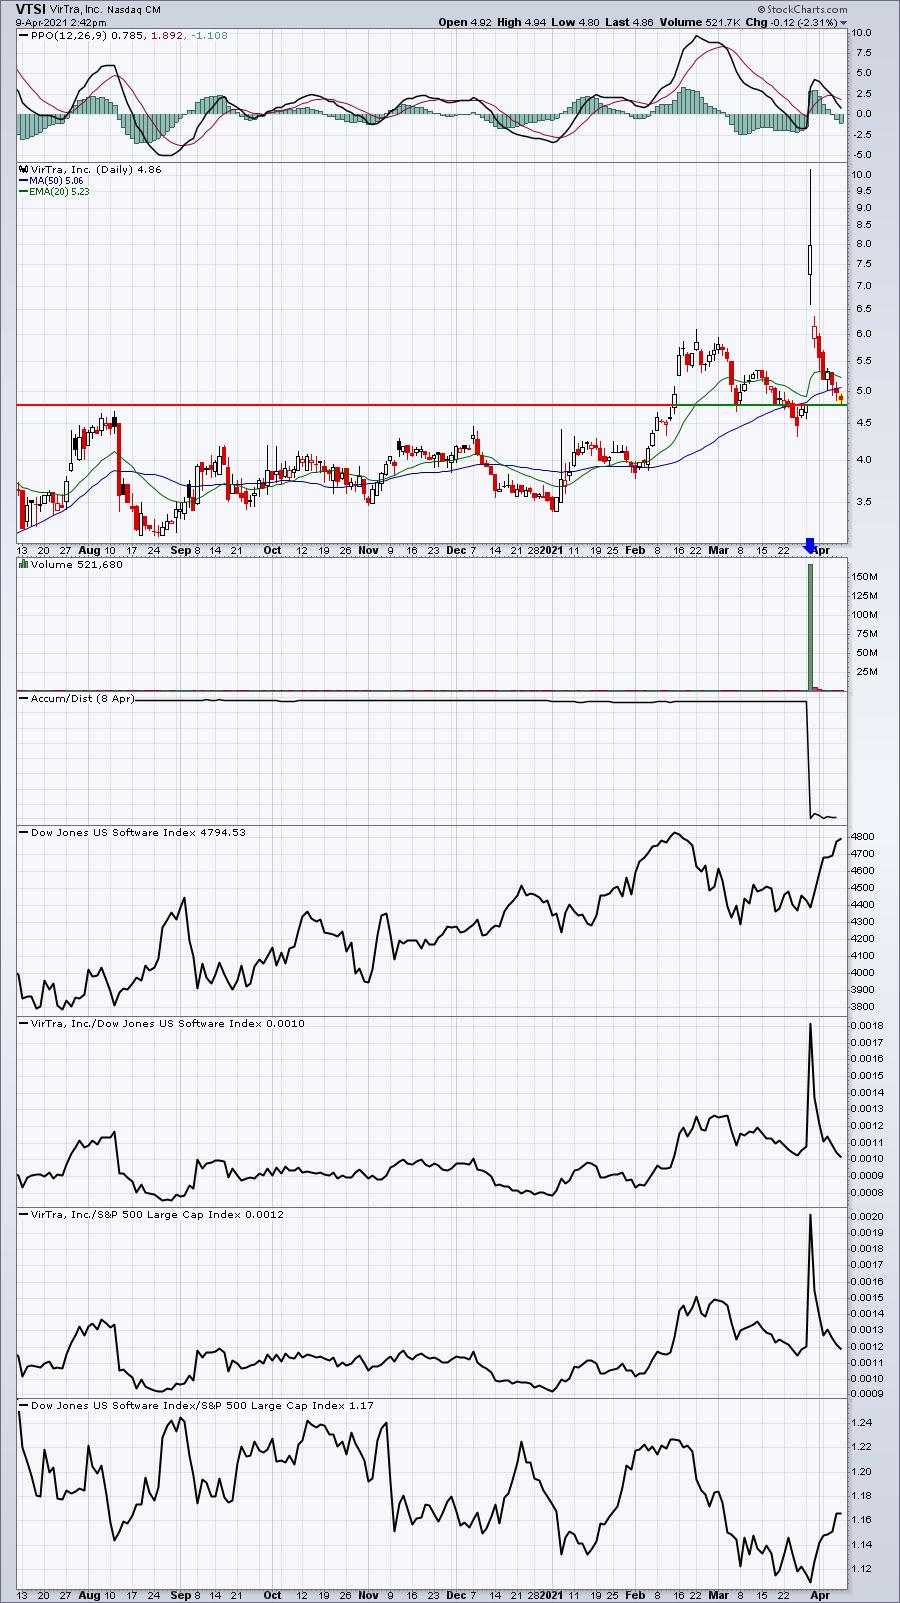
VTSI surged in late March with a blowout earnings report, running from 4.75 to more than 10. Like WTI, however, it's worked its way nearly back down to gap support.
PRLB:
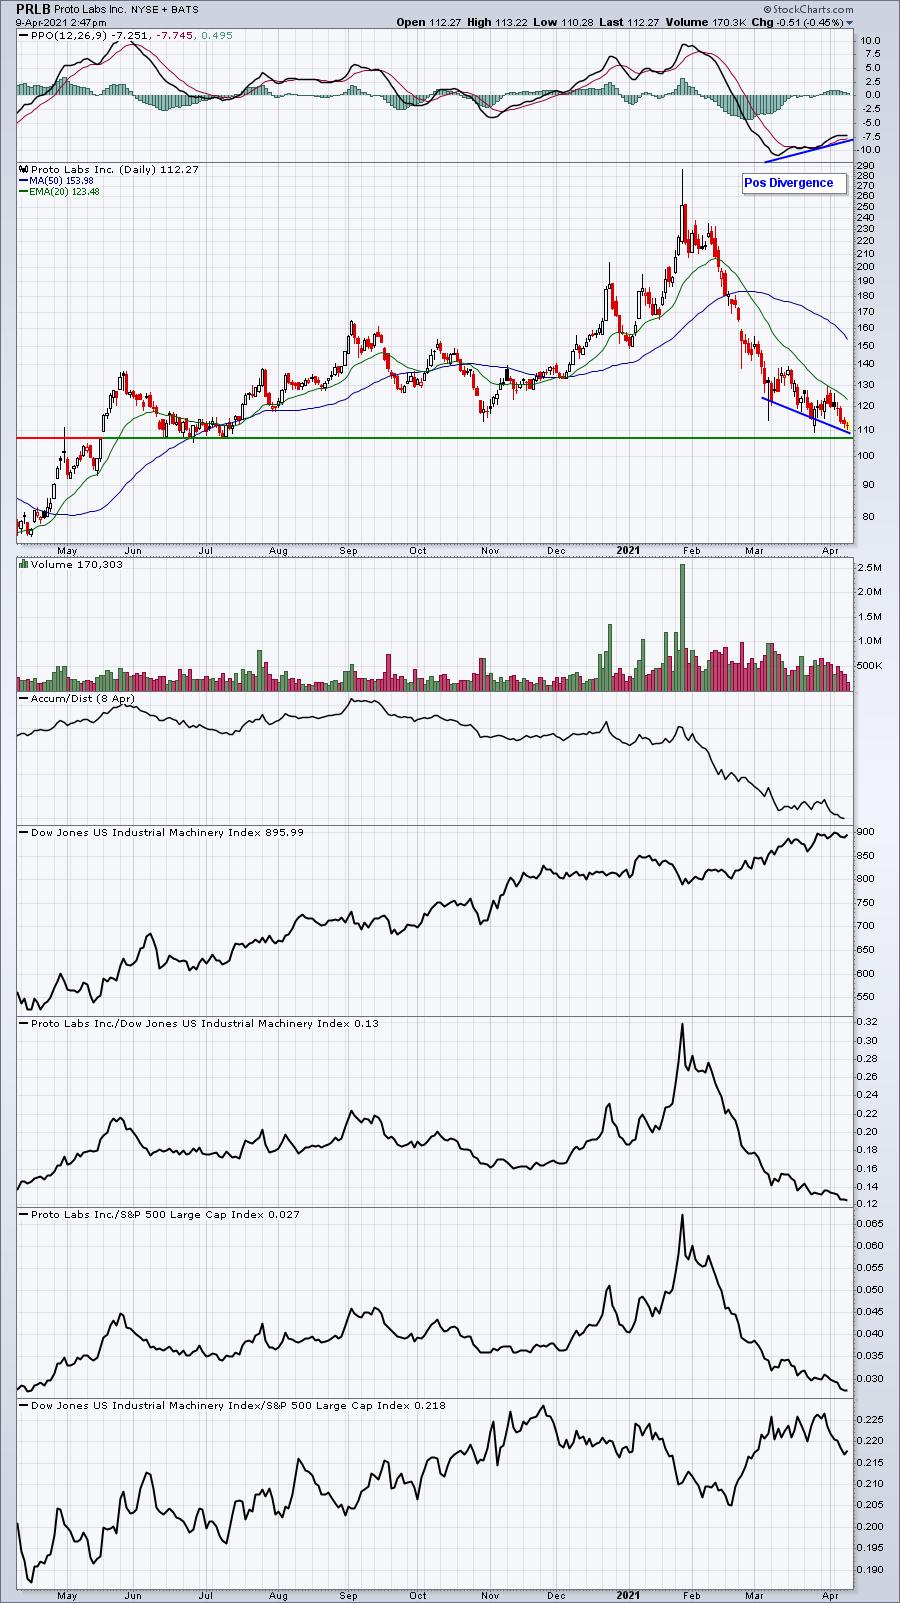
PRLB is nearing a key support level an is showing slowing selling momentum in the form of a negative divergence. While the technical outlook here has been weak, it wouldn't be a surprise at all to see at least a short-term pop from the current level or as it gets closer to price support.
LYFT:
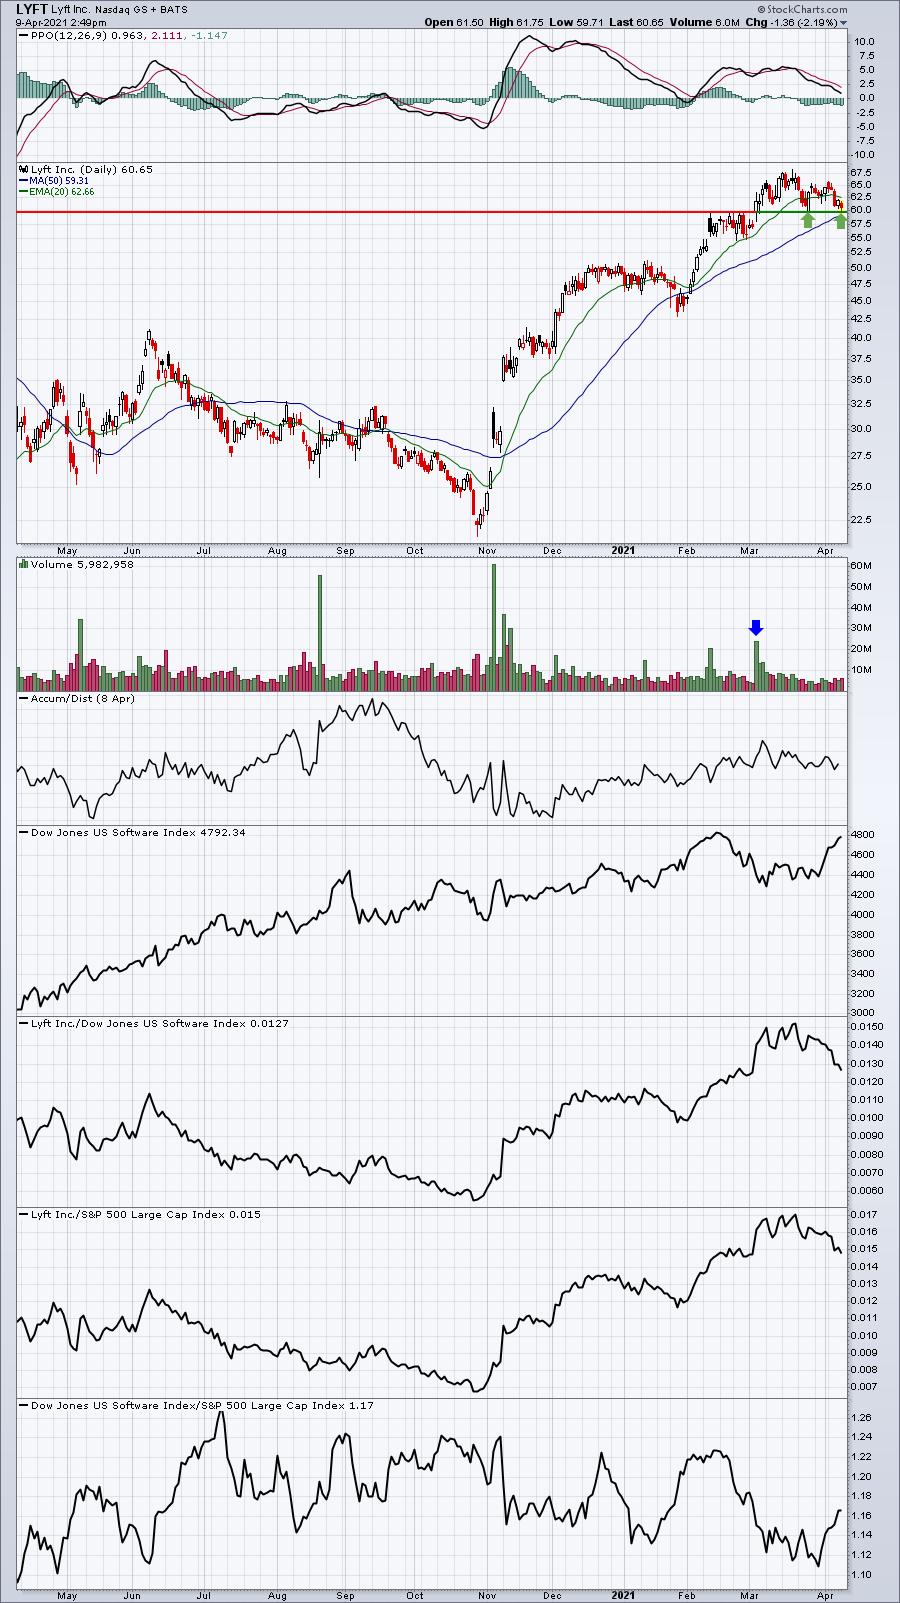
Since gapping higher in early March on strong volume, we've already seen LYFT bounce off of gap support near 60. We're back at that level once again.
Earnings Reports
Here are the key earnings reports for the next two days, featuring stocks with market caps of more than $10 billion. I also include a few select companies with market caps below $10 billion. Finally, any portfolio stocks that will be reporting results are highlighted in BOLD. If you decide to hold a stock into earnings, please understand the significant short-term risk that you are taking. Please be sure to check for earnings dates for any companies you own or are considering owning.
Friday, April 9:
JKS
Monday, April 12:
APHA, SLP
Economic Report
March PPI: +1.0% (actual) vs. +0.5% (estimate)
March Core PPI: +0.7% (actual) vs. +0.2% (estimate)
February wholesale inventories: +0.6% (actual) vs. +0.5% (estimate)
Happy trading!
Tom