
EB Daily Market Report - Tuesday, April 13, 2021
Strong ETF ChartList Update and Max Pain Event Today
The Strong ETF ChartList was updated yesterday and a link was provided on our website. Unfortunately, the link didn't work and we're still trying to troubleshoot the problem. I apologize and will continue to work on this fix. However, the fix will likely be delayed as I need to prep for today's Max Pain webinar for April. This webinar begins at 4:30pm ET and you can join the webinar any time after 4:00pm ET by clicking this link:
https://earningsbeats.zoom.us/j/88357527242
Executive Market Summary
- Futures were mixed overnight and into today's opening bell
- NASDAQ stocks are showing leadership, while Dow Jones stocks struggle on a relative basis
- March CPI and Core CPI both were reported higher than expected and year-over-year CPI (headline number) rose from 1.7% in February to 2.6% in March
- U.S. equities are handling the higher inflation number in stride
- The 10-year treasury yield ($TNX) is tumbling 4 basis points back to 1.63%, aiding growth stocks on today's session
- Commodities are higher today, likely due to the U.S. Dollar (UUP) trading down 0.24% and touching its 3-4 weekly low
- The Dow Jones is seeing profit taking in IBM shares, which is down nearly 3%
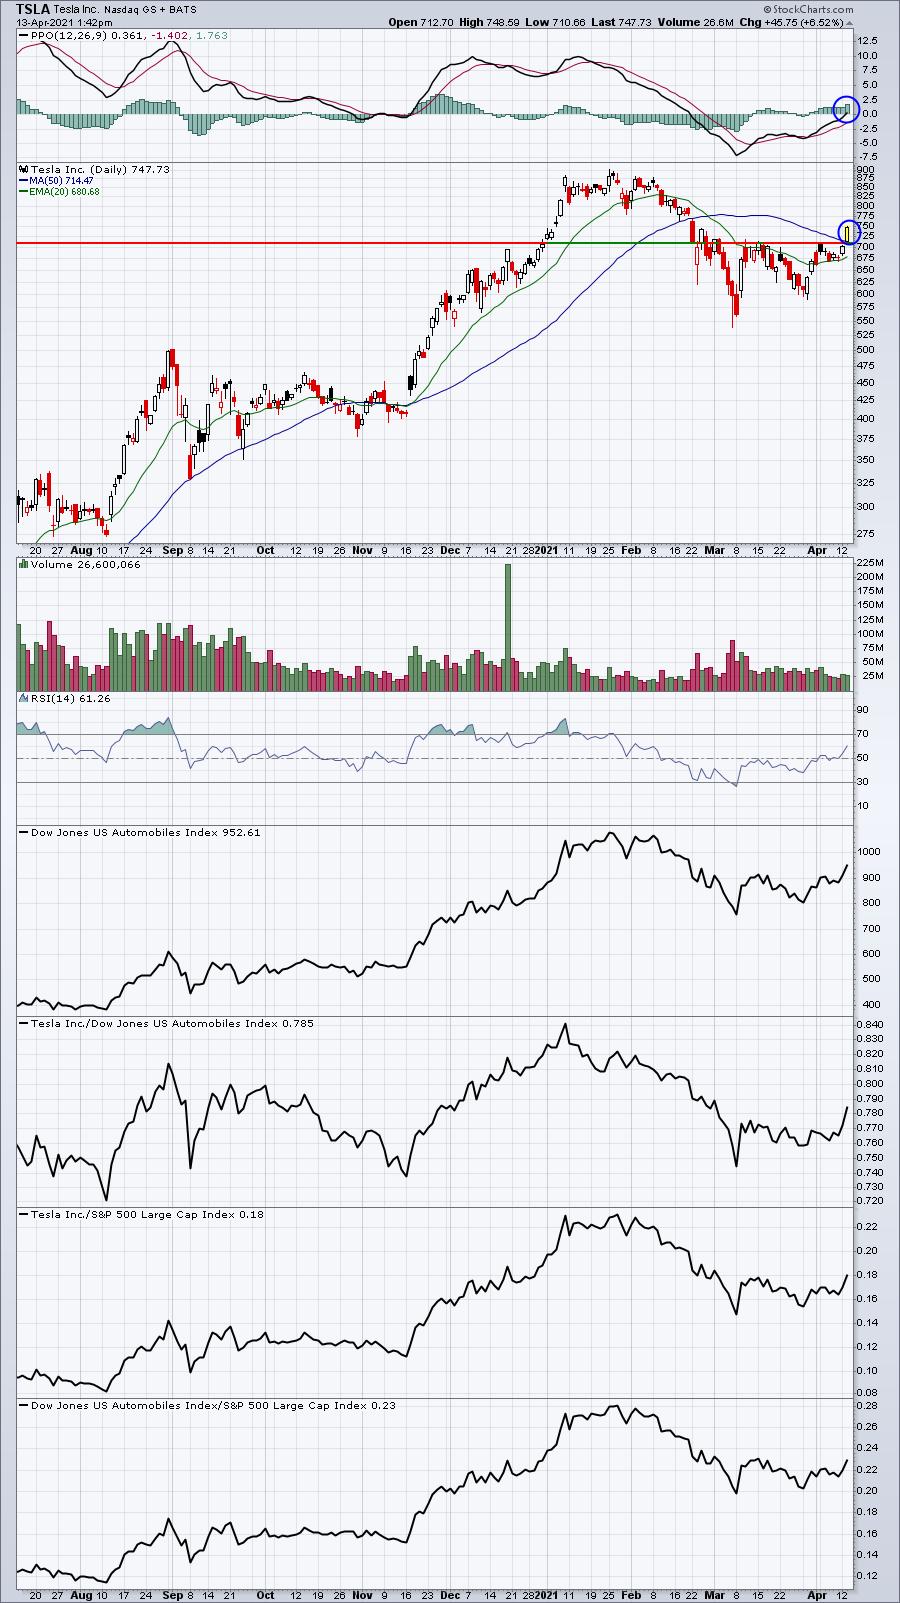
- Meanwhile, Tesla (TSLA, +5.78%) is soaring back above its 50 day SMA to lead the S&P 500 higher
Market Outlook
The return to growth stocks is prompting a very nice relative rally in NASDAQ 100 shares (QQQ) vs. the S&P 500 (SPY):
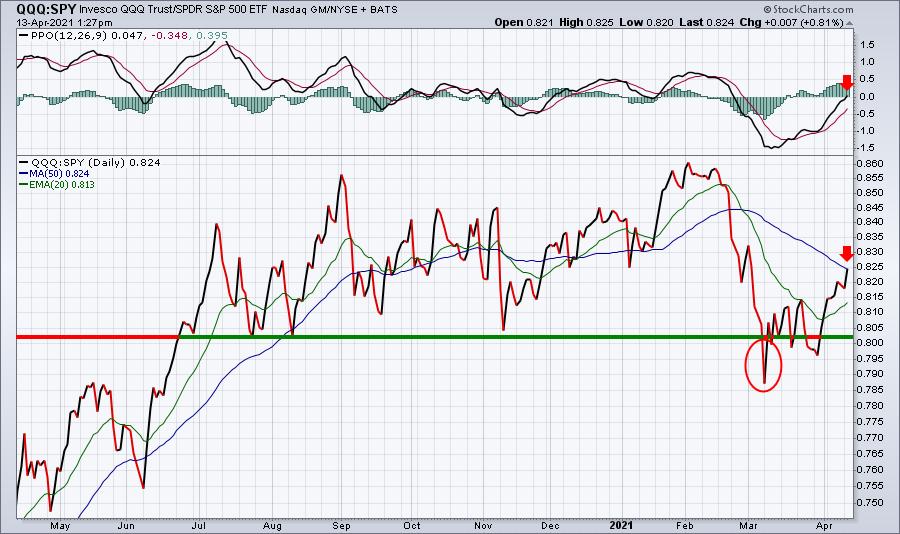
The breakdown here in March (red circle) was not nearly as severe as the IWF:IWD breakdown shown in the Sector/Industry Focus section below, but it was a breakdown nonetheless. We're now recovering back to a critical area on this relative chart. The red arrows highlight both a relative 50 day SMA test and a relative PPO centerline test. Breaking above both these levels would be extremely bullish for NASDAQ 100 stocks and for U.S. equities in general.
Sector/Industry Focus
Growth stocks (IWF) have been solidly outperforming their value stock counterparts (IWD) of late and, from the chart below, you can see we're at a key pivot level on this IWF:IWD relative chart:
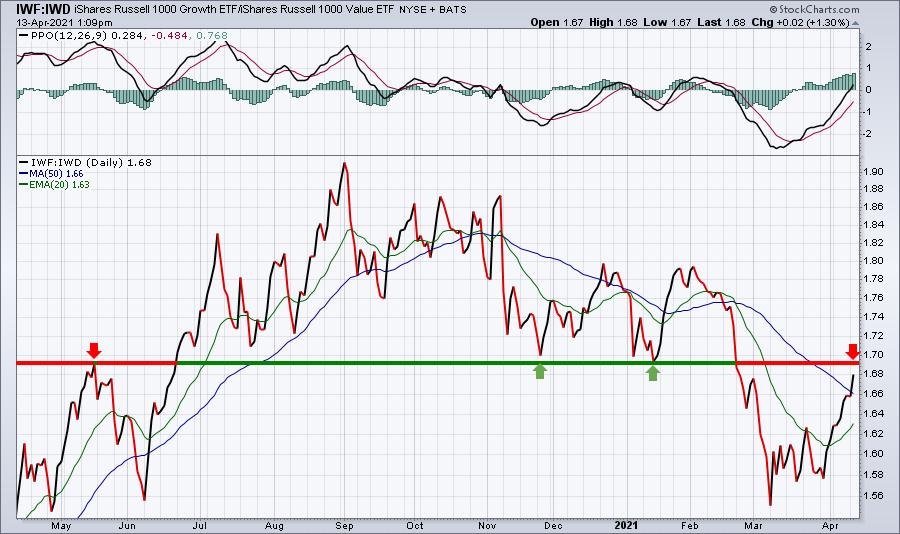
It's great to see growth stocks gaining ground on value stocks again, but there's still much work ahead. And it all starts with this 1.69 relative resistance. A break above and that would be a very bullish signal for growth stocks.
ChartLists/Strategies
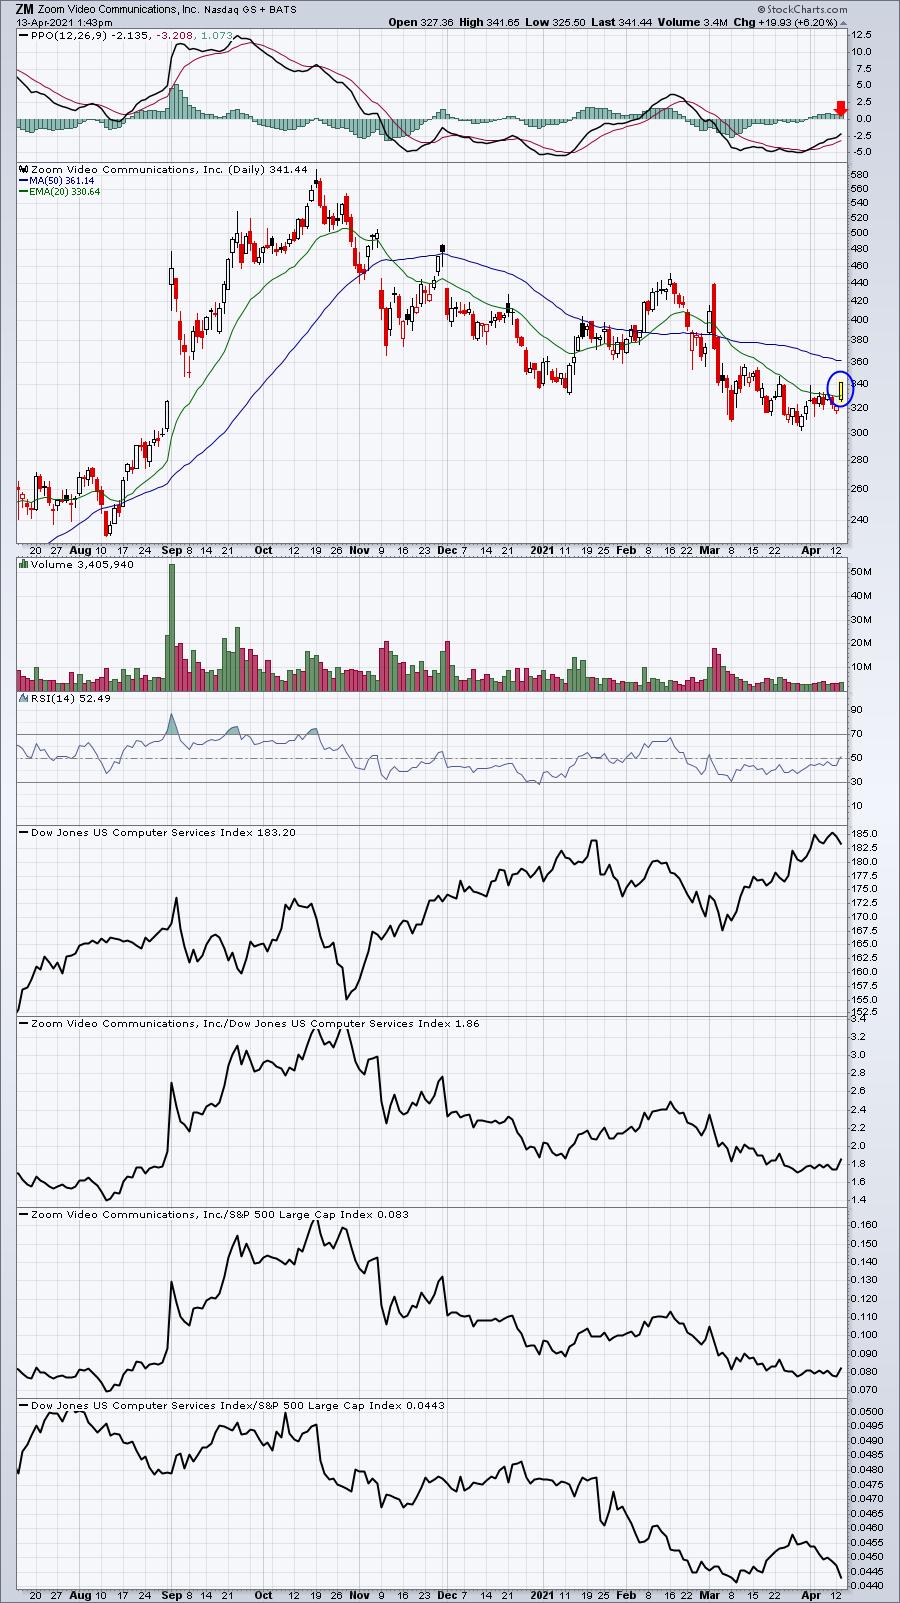
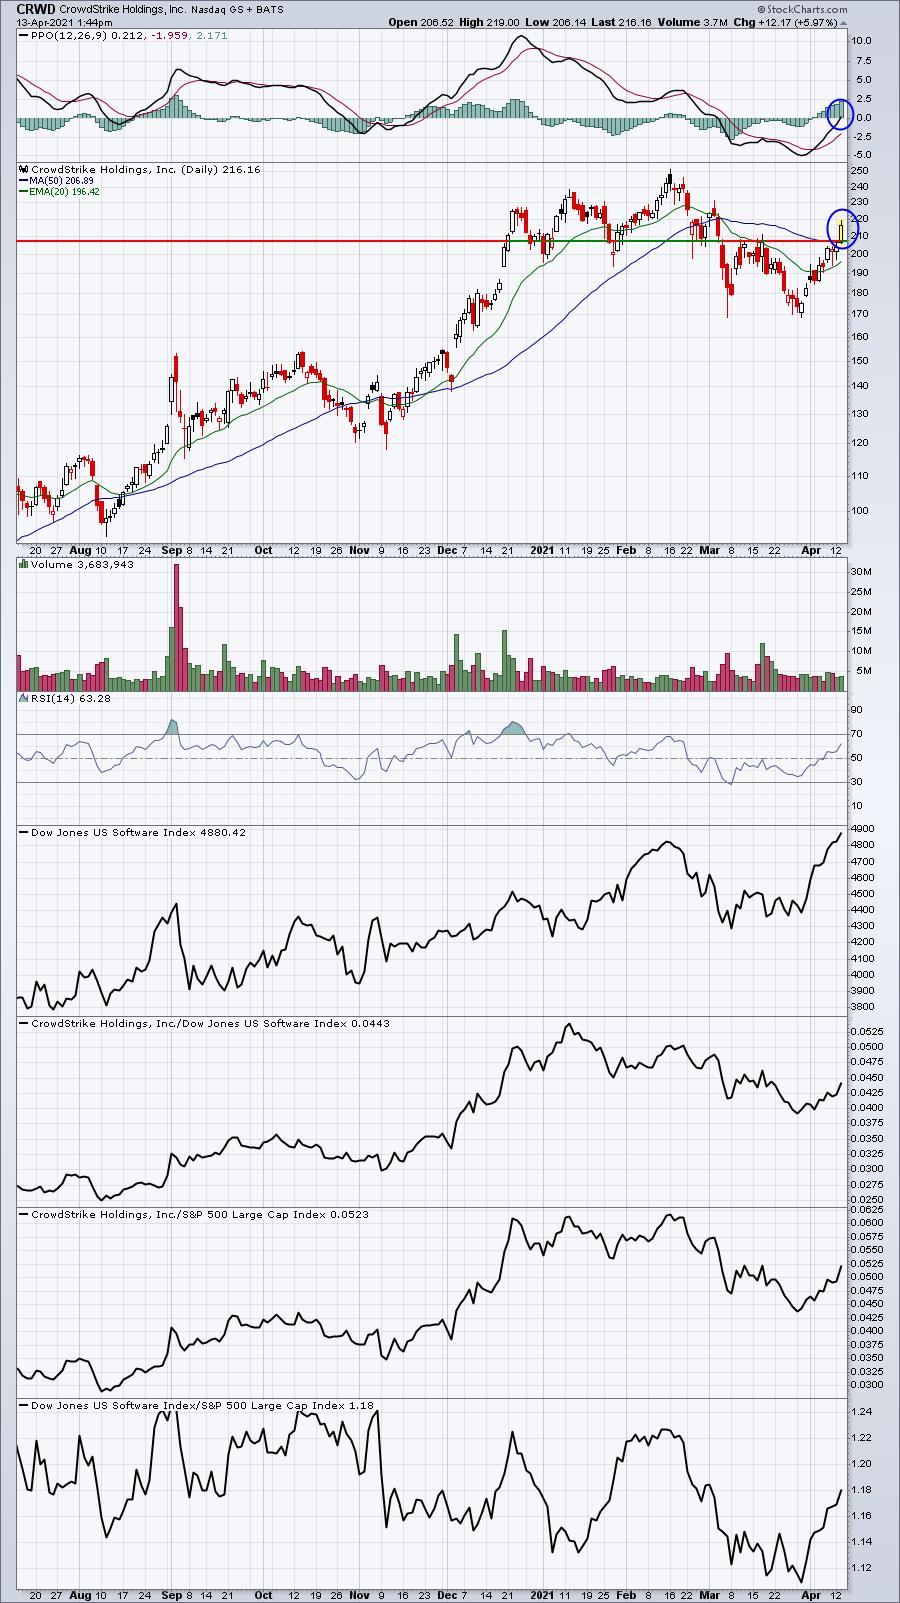
I love the action in so many technology stocks right now. They're bouncing back with gusto. As I've discussed in recent articles, moving back above key moving averages is paramount, when trying to establish a renewed uptrend. Check out these stocks doing just that:
TSLA:
ZM:
CRWD:
ESTC:
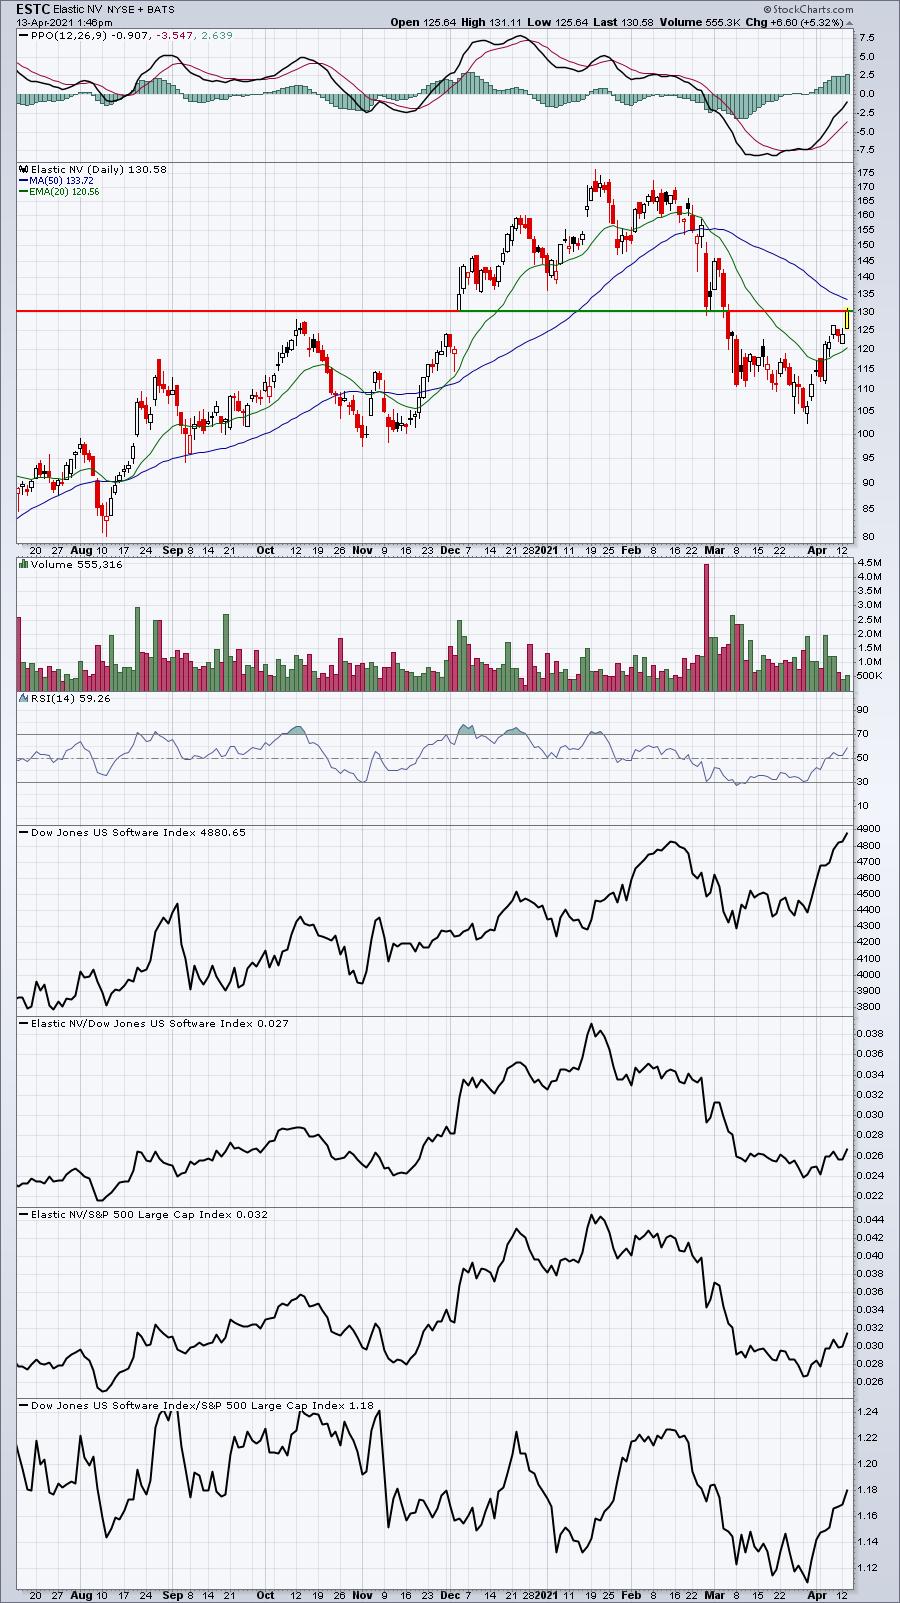
Of these 4, I'd say that TSLA and CRWD are showing more confirming signs of major reversals back to the upside. I'd buy either of these stocks on any future rising 20-day EMA tests. ZM and ESTC are certainly showing significant signs of improvement and I'd also consider buying these on 20-day EMA tests as well. But I'd be quicker to sell ZM and ESTC if their pullbacks were to fail to hold rising 20-day EMA tests.
Earnings Reports
Here are the key earnings reports for the next two days, featuring stocks with market caps of more than $10 billion. I also include a few select companies with market caps below $10 billion. Finally, any portfolio stocks that will be reporting results are highlighted in BOLD. If you decide to hold a stock into earnings, please understand the significant short-term risk that you are taking. Please be sure to check for earnings dates for any companies you own or are considering owning.
Tuesday, April 13:
FAST
Wednesday, April 14:
JPM, WFC, GS, INFY, FRC, SJR, BBBY, LOVE
Economic Report
March CPI: +0.6% (actual) vs. +0.5% (estimate)
March Core CPI: +0.3% (actual) vs. +0.2% (estimate)
Happy trading!
Tom