
EB Daily Market Report - Tuesday, April 20. 2021
Executive Market Summary
- Futures were weak as follow-through to yesterday's selling continued at the opening bell
- The NASDAQ turned positive briefly this morning, but it's been all about the sellers today
- There were no significant economic reports today, and earnings reports continued to pour in ahead of consensus estimates mostly
- Travelers (TRV, +1.25%) has escaped the selling after posting EPS that easily surpassed estimates ($2.73 vs. $2.44)
- Defensive groups are once again leading today as utilities (XLU, +1.33%), real estate (XLRE, +1.16%), consumer staples (XLP, +0.81%), and health care (XLV, +0.43%) are the only 4 sectors gaining ground
- Energy (XLE, -2.87%) is the weakest sector and I've provided several charts below to analyze the group
- Railroads ($DJUSRR, +0.76%) are higher after Canadian National Rail (CNI, -6.34%) jumped into the fray in a bid to buy Kansas City Southern (KSU, +16.22%), potentially sparking a bidding war
Market Outlook
History is repeating itself......again. I routinely discuss the 19th through 25th period of calendar months. The S&P 500 has an annualized return of -8.93% during this period of the calendar month since 1950. That's 71 years of historical data that covers over 4000 trading days (or the equivalent of 16 years). It's absolutely statistically relevant. Imagine the S&P 500 dropping 9% every year from now through 2037. That's the equivalent of what's taken place historically during this 19th to 25th period over the last 7 decades. We don't see the market go down this time of the month every month, but we should never lose sight of the fact that the tendency is for U.S. equities to exhibit weakness. I believe it's options-related, perhaps with a dose of profit taking as the period immediately before it (11th through the 18th) produces annualized returns of +13.55% since 1950.
Granted, this month's selling is unusually heavy, but this is how the S&P 500 looks on an intraday 10-minute chart:
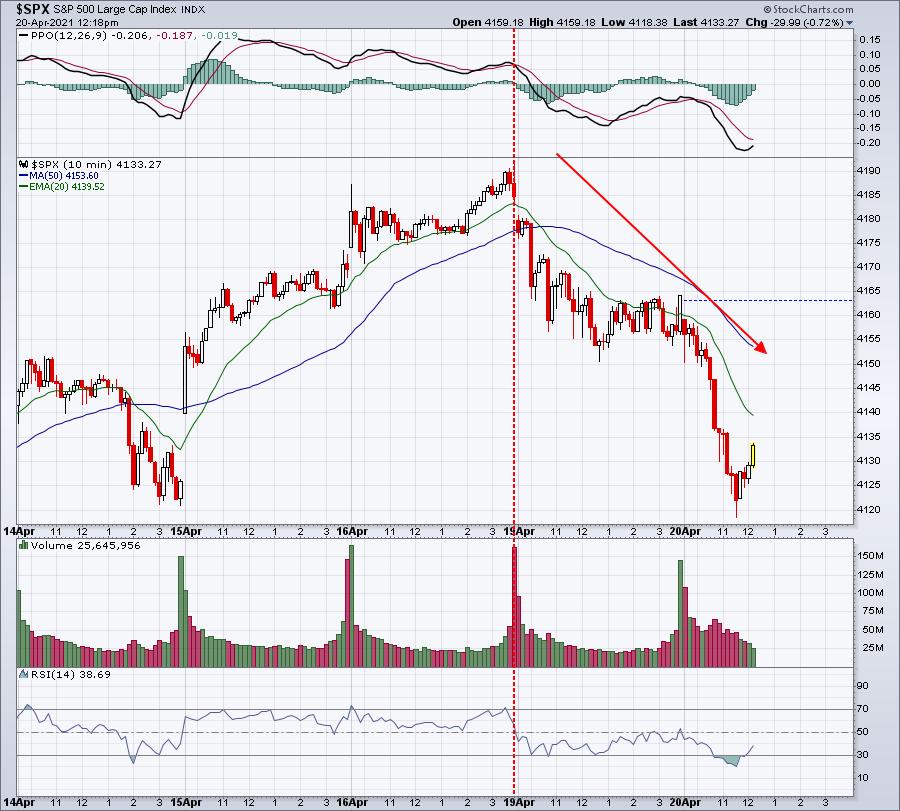
The last four days have essentially netted out to nothing on the S&P 500. We had two solid days where the S&P gained nearly 2%, followed by 2 weak days where we've lost nearly 2%.
Sector/Industry Focus
There are short-term breakdowns all over the market, but among the sectors, the one that's most damaging is likely energy (XLE). First, I'll highlight the short-term hourly chart, showing that key support the past few weeks has failed to hold:
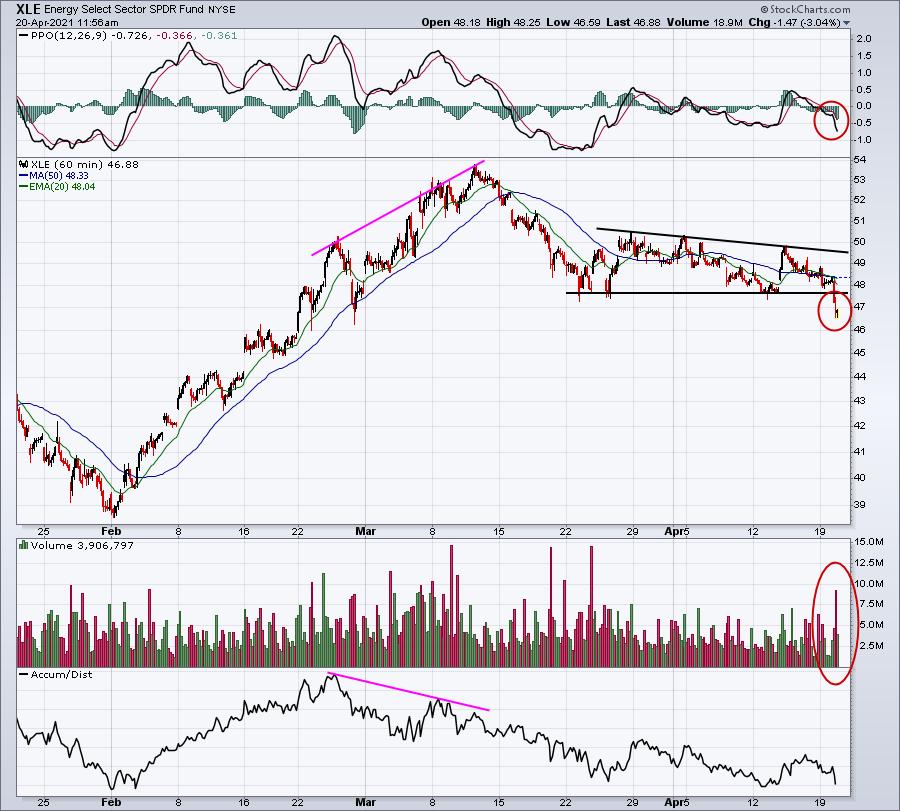
I've never really paid attention much to AD lines on an hourly chart, but this one was certainly interesting and fortuitous. As the XLE kept climbing higher into March, the AD line began dropping. It's something I'll pay closer attention to going forward to see if it truly does give us a warning sign worth considering.
Perhaps the bigger issue - at least for now - is that the XLE is losing 50 day SMA support for the first time since this uptrend began with the positive vaccine news back in November:
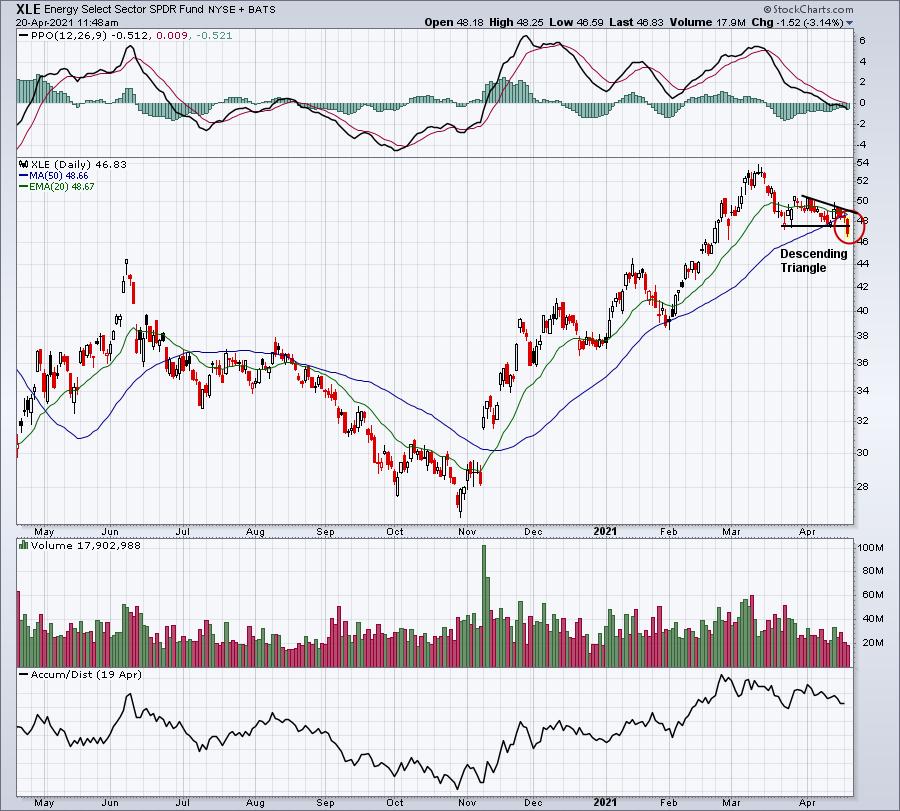
In addition to failing to hold 50-day SMA support thus far, the XLE is also breaking down from a short-term bearish descending triangle. These develop off of a downtrend with lower highs and equal lows. A closing breakdown would suggest further selling ahead. To avoid this breakdown, we'll need to see a recovery this afternoon and a close back above 47.56. It's not impossible, but the bulls need to get to work.
Given the short-term and mid-term bearish implications, it's necessary to move to the longer-term weekly chart to identify key support:
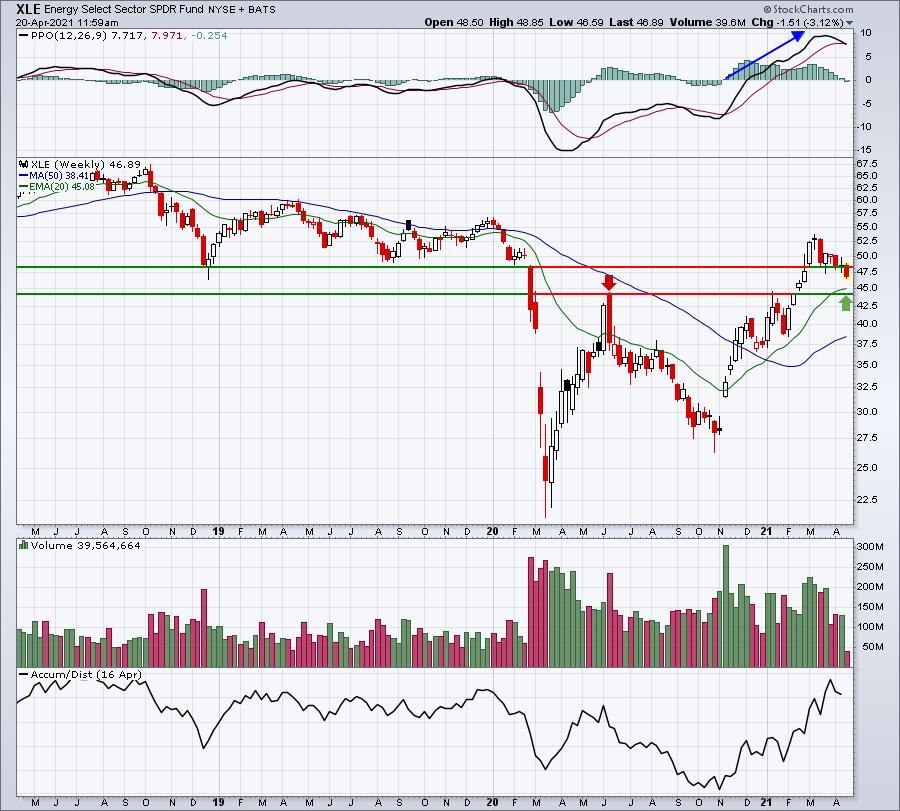
The MOST important chart is the BIG PICTURE weekly chart. Typically, hourly and daily charts are trumped by the longer-term directional trend. I'd view the XLE in a long-term uptrend, so long as price support near 44.00 holds. The weekly PPO is very strong, so pullbacks to test the 20-week EMA should absolutely hold. That 20-week EMA currently resides at 45.08. Therefore, loss of 44.00 not only loses price support, but also loses that rising 20-week EMA.
If you're interested in trading leading stocks in the energy sector, a test of that 44-45 area of support would produce the best reward to risk scenario.
ChartLists/Strategies
One question that is universal is "when's the best time to sell?"
Well, that answer definitely varies based on the objective, time frame, among other things, of each trader/investor. Long-term investors should hold so long as longer-term charts suggest to do so. Stocks trading above their 50-week SMAs might make sense to hold until they fail to hold that key moving average. Falling below it might not be reason to sell, but it should at least begin the beg the question.
Shorter-term traders can have various reasons for selling as well. You might want to exit technology stocks (XLK), for instance, when the XLK is downtrending relative to the S&P 500 (XLK:$SPX). Personally, I do trade shorter-term generally and I like using price resistance and reversing candles. On my recorded Trading Places show on StockCharts TV this morning, I provided 7 examples of stocks at Monday's close that I'd have considered selling based on "false breakouts" (intraday highs that didn't hold into the close). Two of those are shown below:
DFIN:
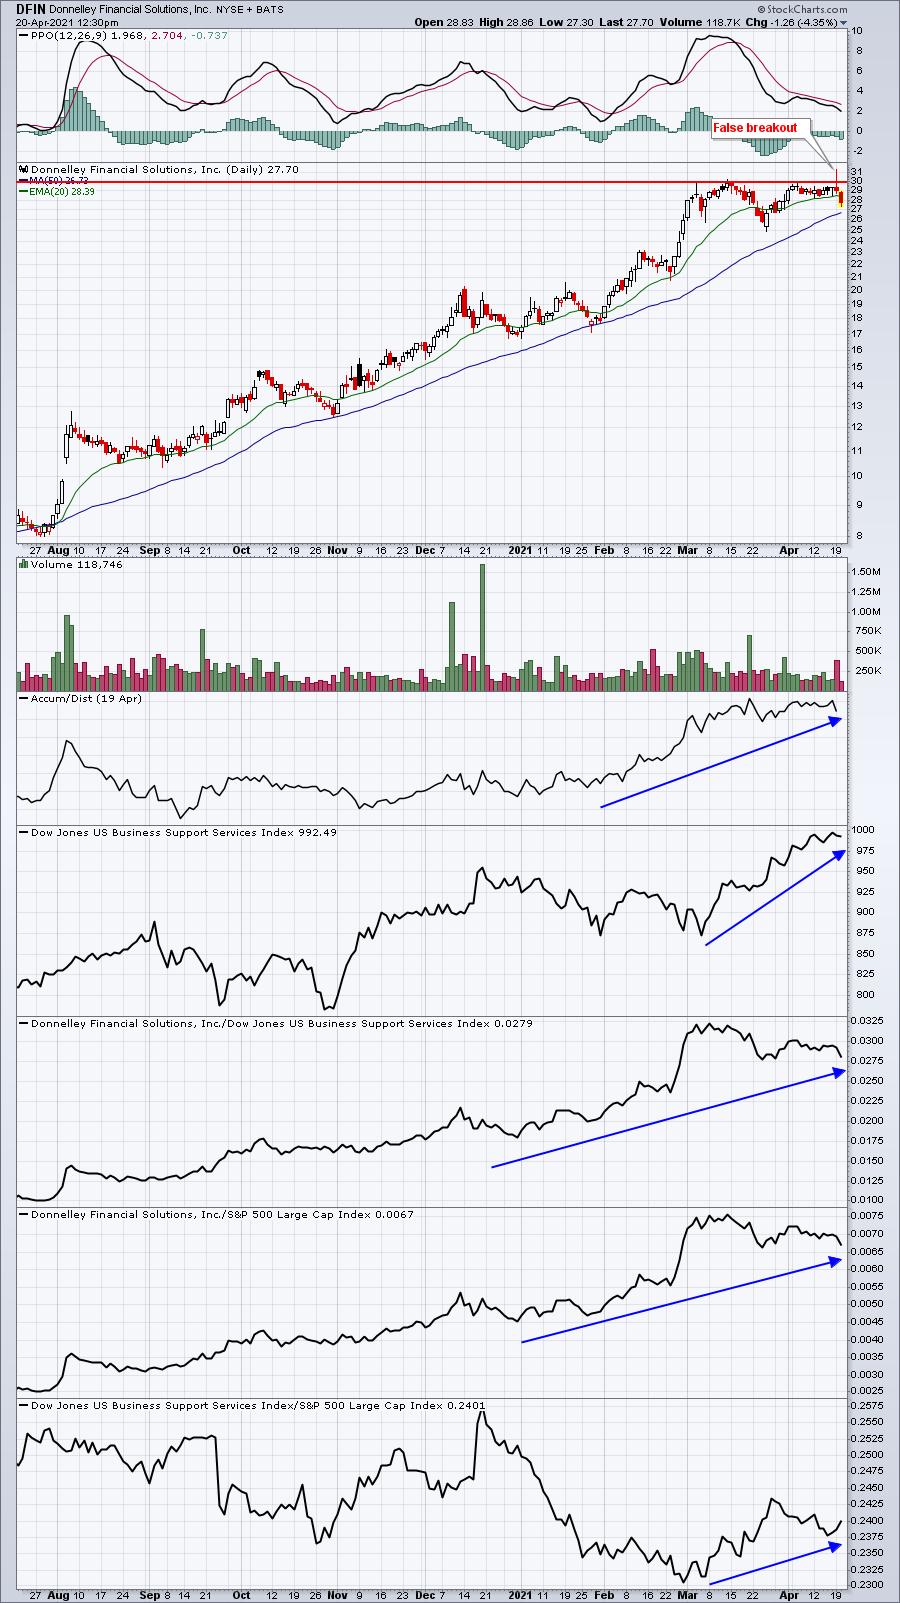
The false breakout here is very easy to see, but it's still hard to pull the sell trigger because it's a very strong stock relative to its peers and the benchmark S&P 500. My objective, if I owned it and did sell, would be to buy it back on the rising 20-day EMA, or possibly even at a recent price low.
CNI:
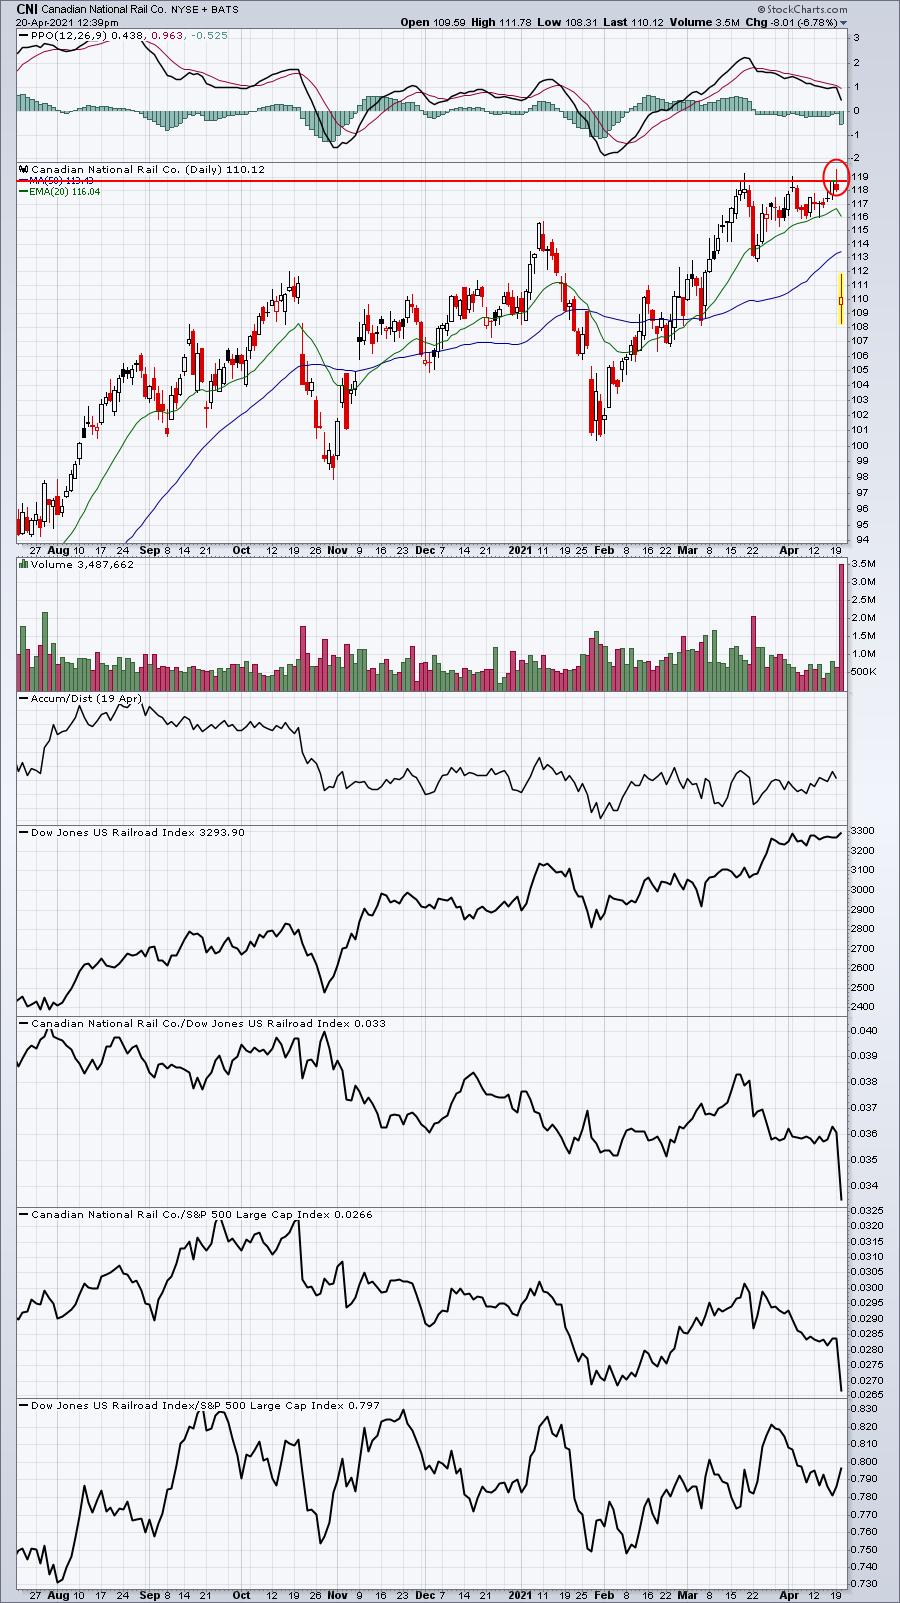
Now you could argue that CNI had news this morning that were interested in buying Kansas City Southern (KSU) and that's the reason for the drop, but does it matter what the reason is? Monday's reversal after a false breakout was a short-term technical sell signal and played out perfectly. The other 5 stocks that I suggested failed at key resistance were TGNA, ORCL, AAP, BTI, and PM. These all worked (or didn't) to varying degrees and likely were of no concern to a long-term buy and hold investor. But for me, these were sell signals to lock in profits. If they continue moving higher, I can always buy back in later if I choose. But that money is no longer at risk and other opportunities will arise that require cash. Selling at resistance provides that cash.
Earnings Reports
Here are the key earnings reports for the next two days, featuring stocks with market caps of more than $10 billion. I also include a few select companies with market caps below $10 billion. Finally, any portfolio stocks that will be reporting results are highlighted in BOLD. If you decide to hold a stock into earnings, please understand the significant short-term risk that you are taking. Please be sure to check for earnings dates for any companies you own or are considering owning.
Tuesday, April 20:
JNJ, PG, NFLX, ABT, PM, LMT, ISRG, CSX, EW, TRV, IBKR, FITB, EDU, NTRS, DOV, KEY, OMC, WRB, CMA, AN, SNV, MAN, THC, IRDM, XRX, GATX, BMI, MLI, LRN
Wednesday, April 21:
ASML, VZ, NEE, ANTM, LRCX, CCI, CP, ERIC, LVS, TEL, CMG, KMI, DFS, NDAQ, RCI, EFX, BKR, HAL, XM, WHR, GGG, SBNY, LAD, FHN, RHI, SEIC, KNX, SLM, LSTR, CACI, VMI, SLG, SAVE, SNBR, FCFS, PLXS, HCSG, NTGR
Economic Report
None
Happy trading!
Tom