
EB Daily Market Report - Wednesday, April 21, 2021
Executive Market Summary
- Futures were weak this morning and we saw opening gaps lower across our major indices, despite continuing earnings beats from many areas of the market
- Our major indices have strengthened since the open, however, and are in positive territory
- Commodities are mostly higher, though crude oil ($WTIC) is down a bit more than 1%; that's done little to slow down energy (XLE, +1.25%)
- Small caps ($SML, +1.60%) and mid caps ($MID, +1.30%) are showing relative strength, something we haven't seen much of lately, especially with the SML
- Netflix (NFLX, -7.28%) and Halliburton (HAL, -5.07%) are the two worst performing S&P 500 companies after reporting quarterly earnings that exceeded expectations
- On the flip side is Intuitive Surgical (ISRG, +8.44%), which is leading the S&P 500 after blowout results
- Defensive sectors, which led on a relative basis the past couple trading sessions, are trailing today with utilities (XLU, -0.95%) the worst performer
Market Outlook
Strength in Amazon.com (AMZN) and Tesla (TSLA) would likely power the consumer discretionary sector (XLY) to another breakout vs. its consumer staples (XLP) counterparts. This XLY:XLP ratio is one of the most reliable measures of a sustainable bull market advance. There is a very strong positive correlation between the direction of the S&P 500 and the direction of this ratio. I describe the impact of AMZN and TSLA on the XLY below in the Sector/Industry Focus.
Below is a long-term weekly look at the XLY:XLP ratio and the correlation to the benchmark S&P 500. Correlation coefficient readings above zero indicate positive correlation. Readings that approach 1 illustrate hand-in-hand performance. Check this long-term relationship out and where we currently stand:
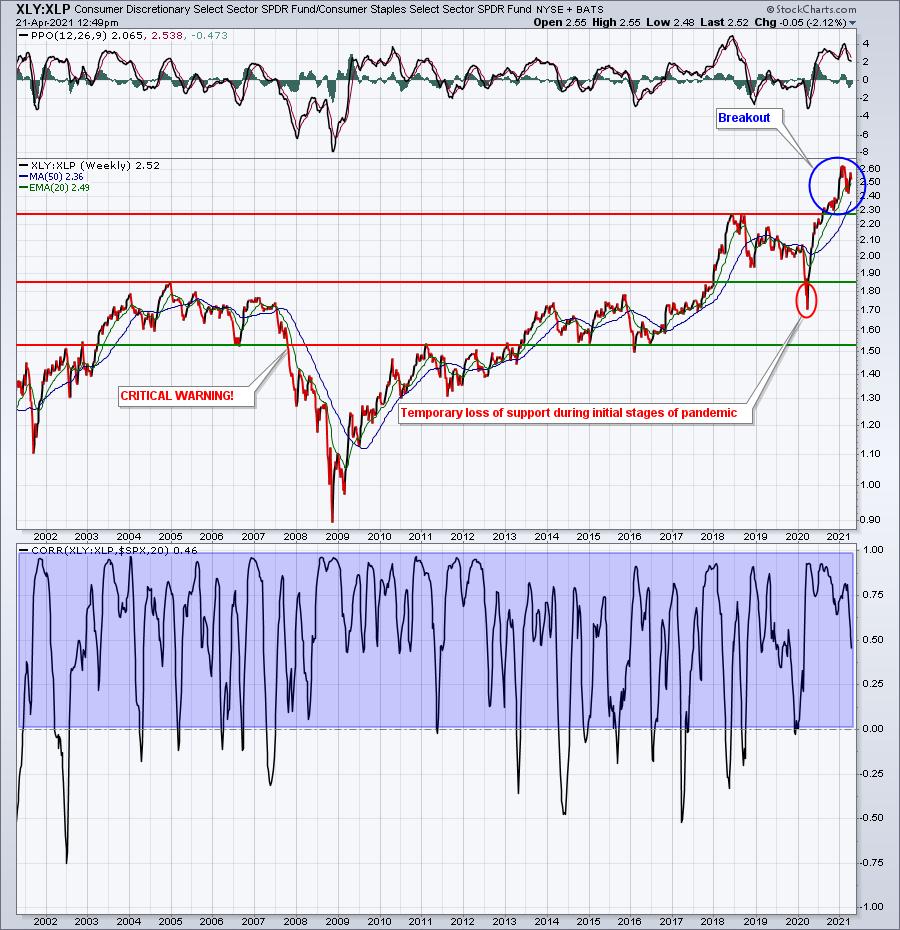
The blue-shaded area shows that this XLY:XLP ratio is very positively correlated to the S&P 500. It provided us a MAJOR warning in 2007. As the S&P 500 was moving to its final high in October 2007, the XLY:XLP ratio was breaking to a multi-year low. This tells us that Wall Street was growing much more defensive, despite the fresh highs. When I talk about how bearish it is to see defensive areas of the market lead during the late stages of an advance, THIS CHART is what it looks like.
Now let's fast forward to 2021. I see no warning signs whatsoever. The XLY has been solidly outperforming the XLP and is showing no signs of letting up. That's why I'm watching the XLY so closely on its latest breakout, realizing that AMZN and TSLA hold the key for the ratio to forge to another all-time high.
Sector/Industry Focus
I like the consumer discretionary sector (XLY) moving forward, especially with Amazon.com (AMZN), its largest holding (21.79%), strengthening the past several weeks. If AMZN breaks out to a fresh 52-week high, look for the XLY to regain a solid leadership position:
XLY:
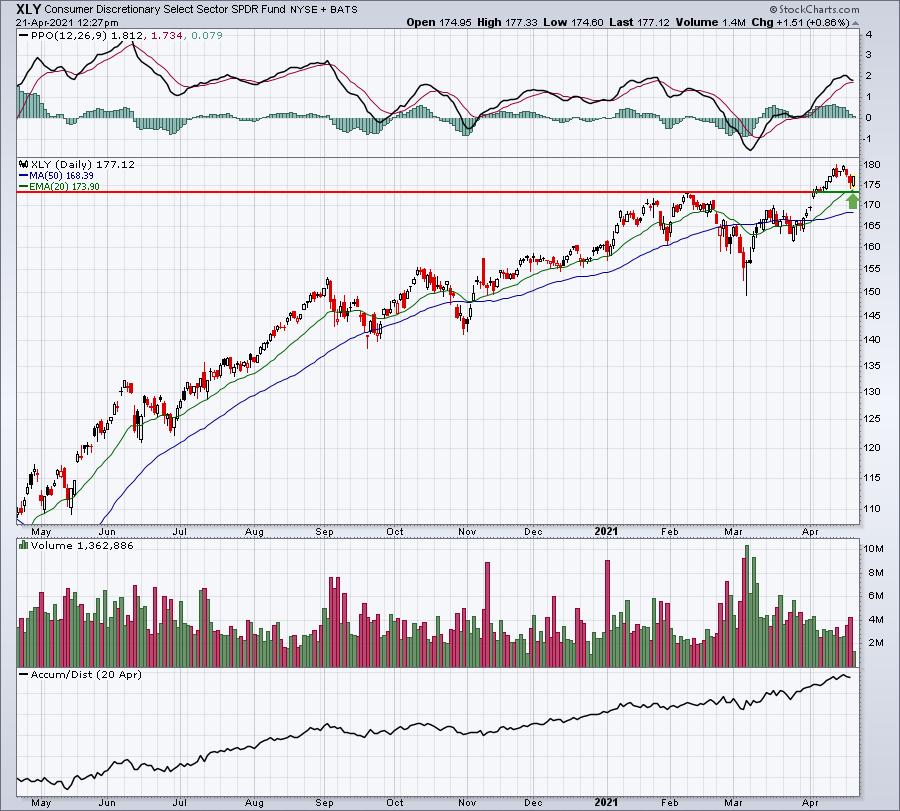
The XLY has already broken out without the benefit of an AMZN breakout. Imagine the XLY strength if we see this breakout:
AMZN:
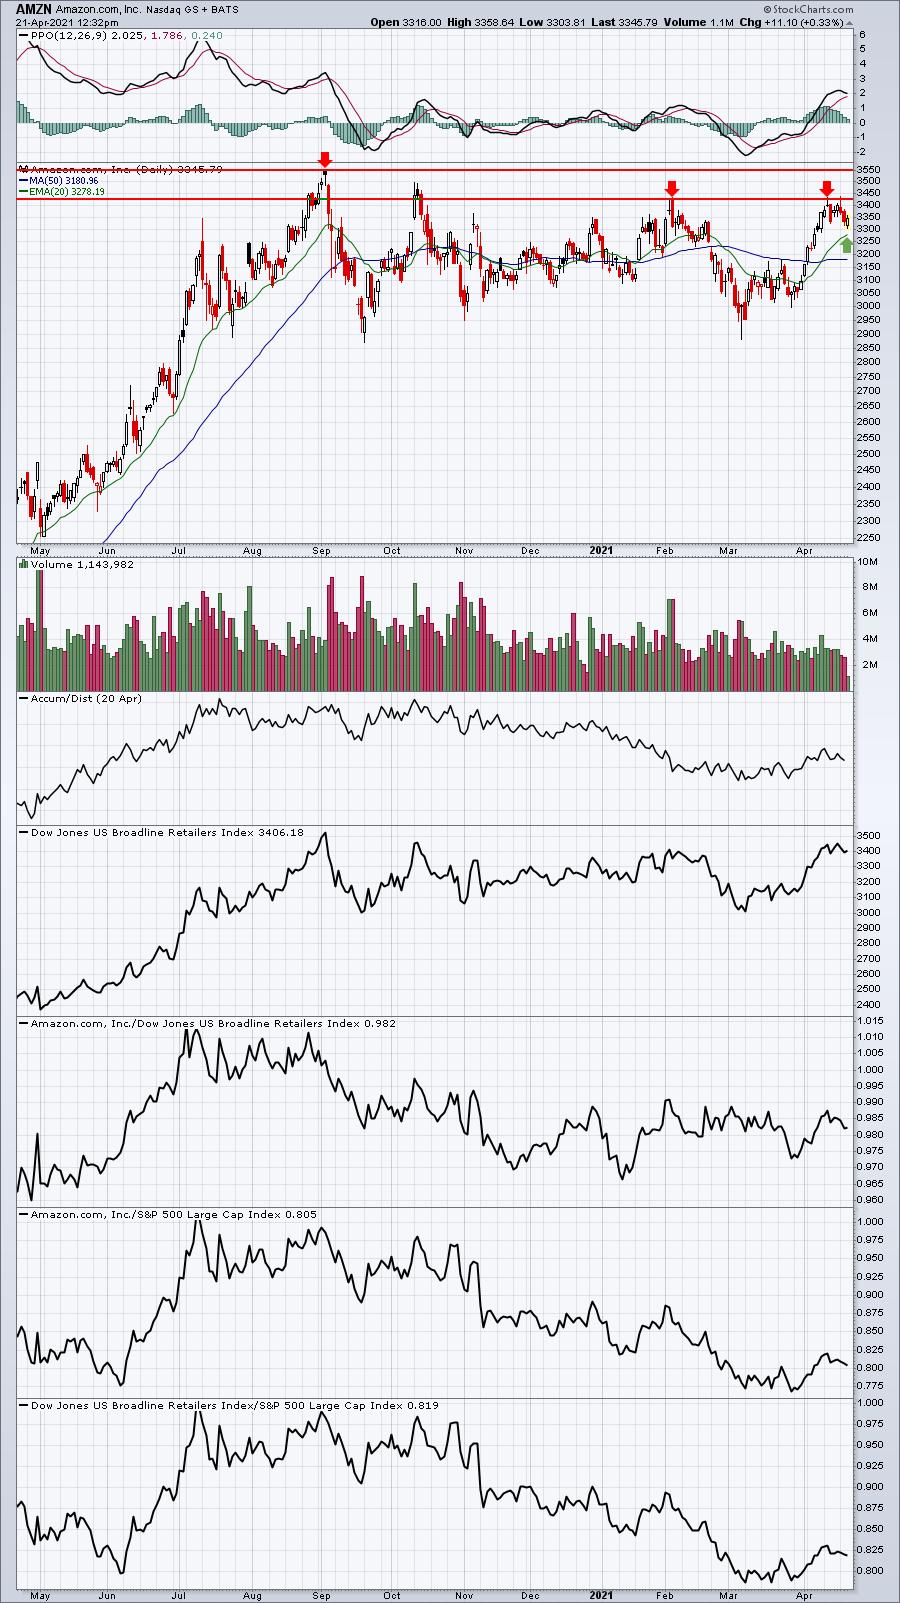
The red arrows mark significant resistance, so we have a couple key levels to clear. To the downside, I'm expecting AMZN to hold onto rising 20-day EMA support.
Another major holding of the XLY is Tesla (TSLA), which represents 14.98% of the XLY. TSLA also has begun to strengthen, but remains well below its all-time high as it approaches its earnings report next week.
ChartLists/Strategies
I'm seeing a number of downtrending stocks attempting reversals today, some from key support. I ran our Downtrend Reversal scan from our website against our SECLs, SFECL, and RGCL and found the following stocks that are attempting their reversal from what I consider to be significant price support where we've seen bounces before:
JWN:
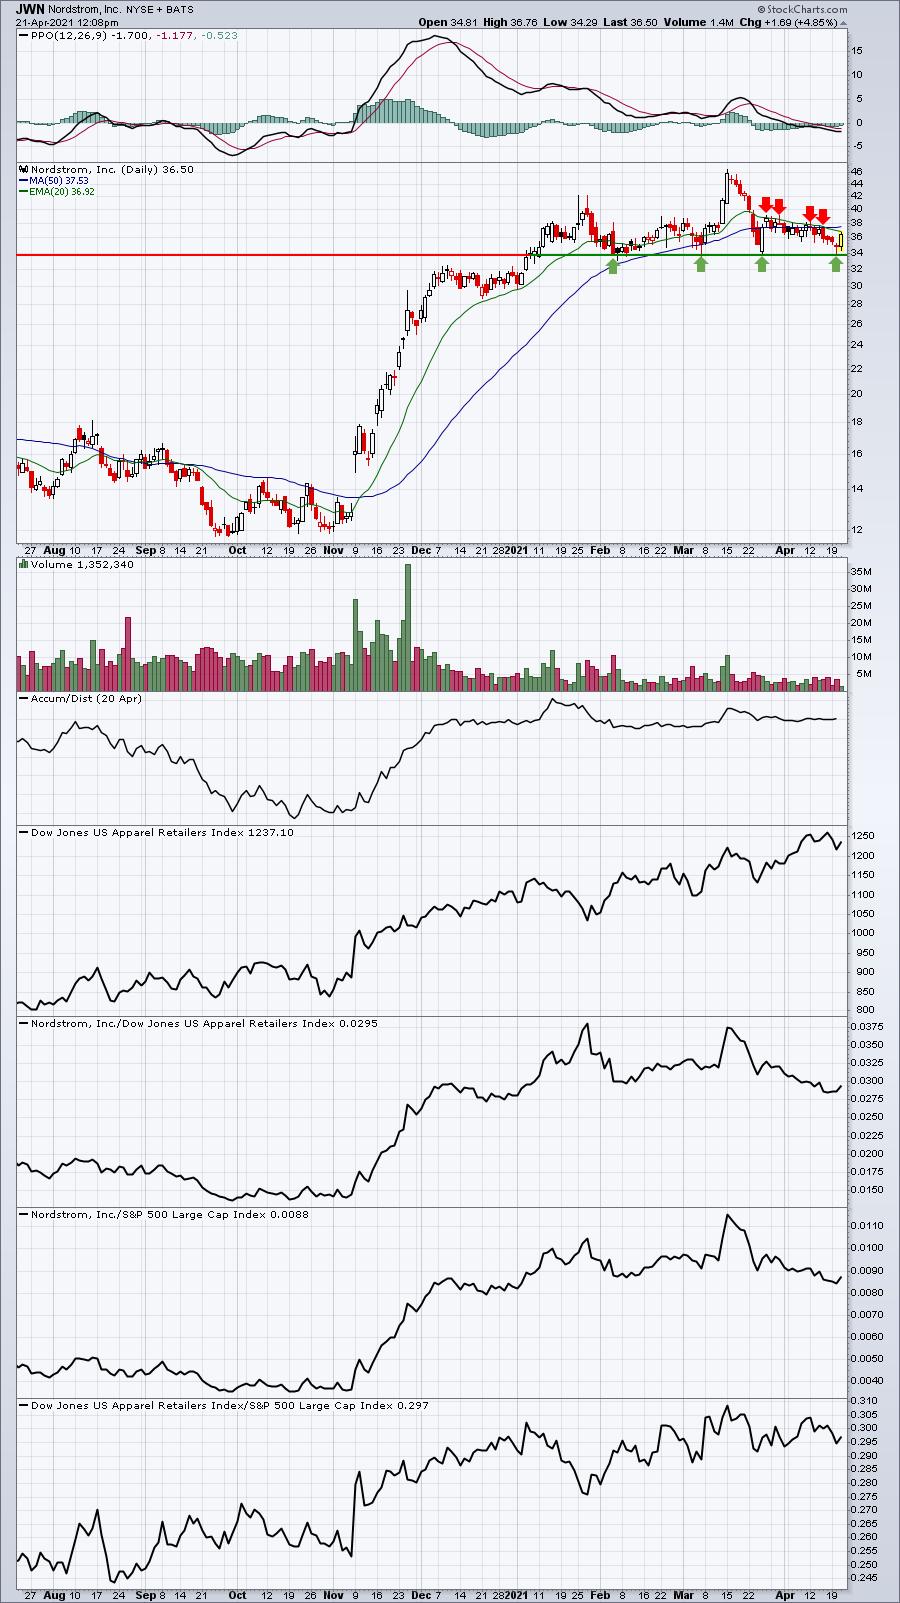
Price support near 34 has held beautifully in 2021, but recently bounce attempts have failed at the declining 20-day EMA, so a break above that key moving average would signal a more sustainable rally.
KOPN:
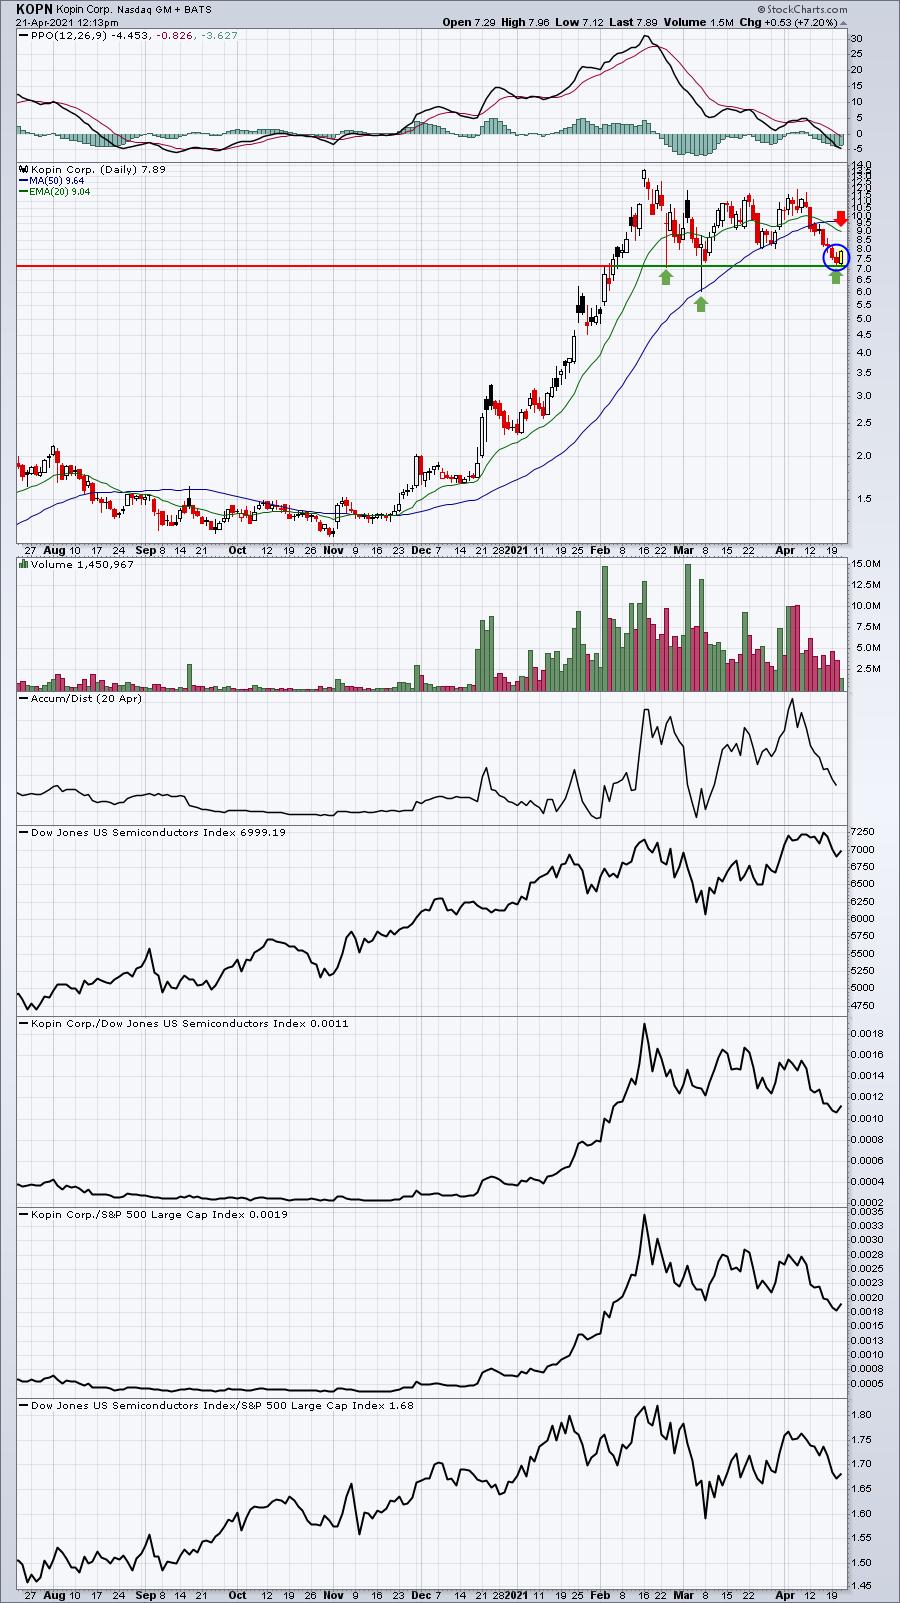
The level just above 7.00 has provided great support and I like the bullish engulfing candle today off the recent downtrend - assuming this candle holds into the close. Odds suggest a further rally back to perhaps the falling 20-day EMA is in the cards.
UAA:
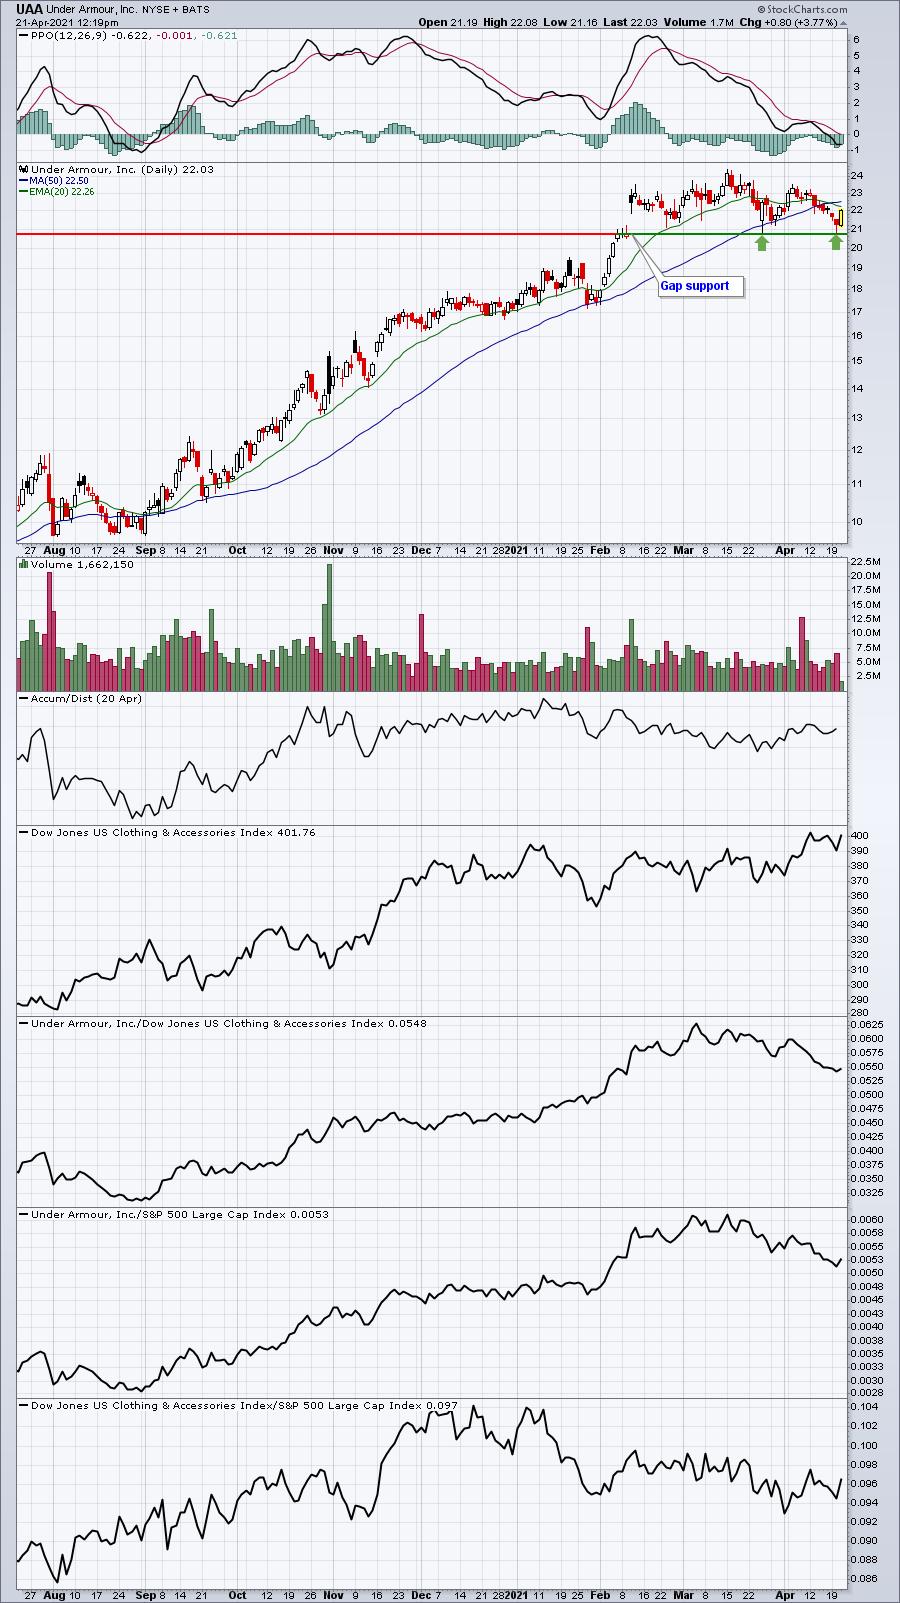
In addition to providing excellent price support, the recent price lows also tested gap support. A close beneath this level would need to be respected. Otherwise, I see UAA moving higher from here.
MOGO:
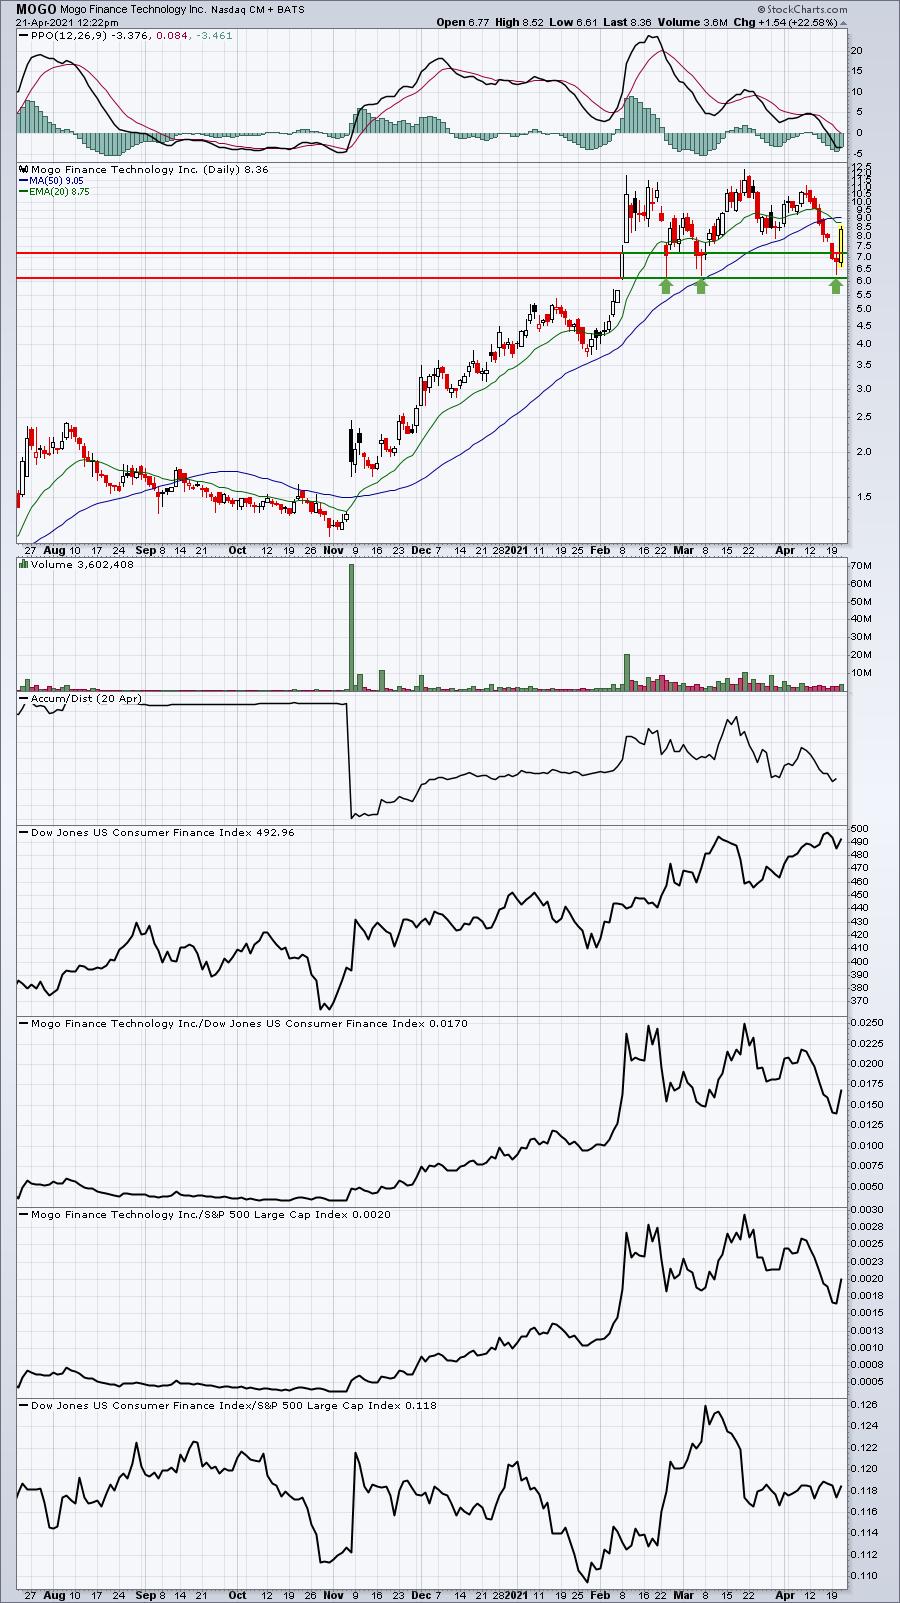
MOGO has rallied more than 22% today, so it's too late to jump into this one, but I still wanted to point out how important price support was. Any time that prices reverse off a downtrend, it signals the willingness of buyers to step in. That's what creates the price support.
Earnings Reports
Here are the key earnings reports for the next two days, featuring stocks with market caps of more than $10 billion. I also include a few select companies with market caps below $10 billion. Finally, any portfolio stocks that will be reporting results are highlighted in BOLD. If you decide to hold a stock into earnings, please understand the significant short-term risk that you are taking. Please be sure to check for earnings dates for any companies you own or are considering owning.
Wednesday, April 21:
ASML, VZ, NEE, ANTM, LRCX, CCI, CP, ERIC, LVS, TEL, CMG, KMI, DFS, NDAQ, RCI, EFX, BKR, HAL, XM, WHR, GGG, SBNY, LAD, FHN, RHI, SEIC, KNX, SLM, LSTR, CACI, VMI, SLG, SAVE, SNBR, FCFS, PLXS, HCSG, NTGR
Thursday, April 22:
INTC, T, DHR, SAP, UNP, SNAP, HCA, FCX, BX, DOW, AEP, IQV, BIIB, LUV, DHI, ODFL, VLO, SIVB, CS, NUE, VRSN, TSCO, MKTX, STX, FE, CE, GPC, DGX, HBAN, SAM, POOL, AAL, SNA, ALLE, WSO, PNR, EWBC, RS, CLF, ALK, MAT, SKX, SON, GTLS, TPH, BJRI
Economic Report
None
Happy trading!
Tom