
EB Daily Market Report - Thursday, April 22, 2021
Executive Market Summary
- Futures were down slightly and our major indices mostly opened lower; small and mid caps opened higher
- After early morning selling, we saw a nice advance materialize, but that completely reversed after President Biden suggested that he'll propose a doubling of the capital gains rate on wealthy Americans
- Most commodities are lower as the dollar (UUP, +0.27%) climbs
- Initial jobless claims were much lower than expected for the second straight week; the 10-year treasury yield ($TNX) fell one basis point to 1.55%
- Equifax (EFX, +15.40%) is surging on much-better-than-expected earnings; Sleep Number (SNBR, -12.81%) is tumbling despite excellent results and raised guidance
- Materials (XLB, -1.62%) and technology (XLK, -1.25%) are the worst performing sectors as all 11 sectors are in negative territory
- Renewable energy ($DWCREE, +2.67%) and recreational products ($DJUSRP, +2.59%) are going against the grain today and lead all industries
Market Outlook
U.S. equities took a hit this afternoon as it was reported that President Biden will propose much higher capital gains taxes for the wealthy. Here's my take on this. First, it's a tax at the individual level, so there's no impact on stock valuations. It does encourage wealthy individual investors to potentially sell short-term to lock in capital gains in 2021, but those same sellers would likely buy back to establish a higher basis for tax purposes going forward. I believe the knee-jerk reaction was unwarranted as I'd expect little change in supply and demand over time. Also, there's no rush to sell today as these wealthy investors have the rest of the year to sell at lower capital gains tax rates. But overreactions is what we've grown accustomed to in today's market. As the news broke, you can see the immediate bearish reaction on the growth-oriented NASDAQ:
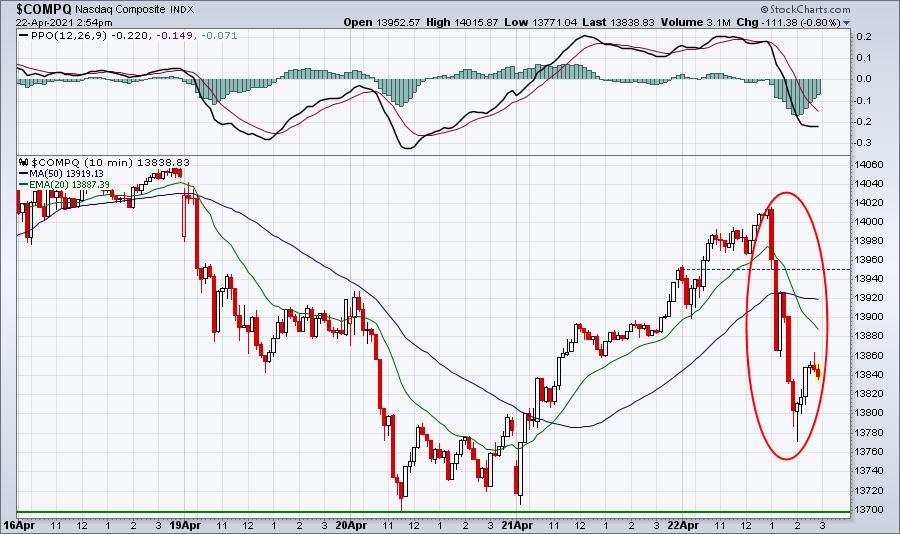
The NASDAQ lost 240 points, or close to 2% of its value, in one hour on this news. Crazy.
Sector/Industry Focus
Strength in mid-caps ($MID) is apparent from the group's recent breakout to an all-time high after a month-long consolidation. This group is also showing relative strength vs. the S&P 500. We can see it by using a price-relative chart, but we can also see it by simply looking at recent price highs and lows. Check this out:
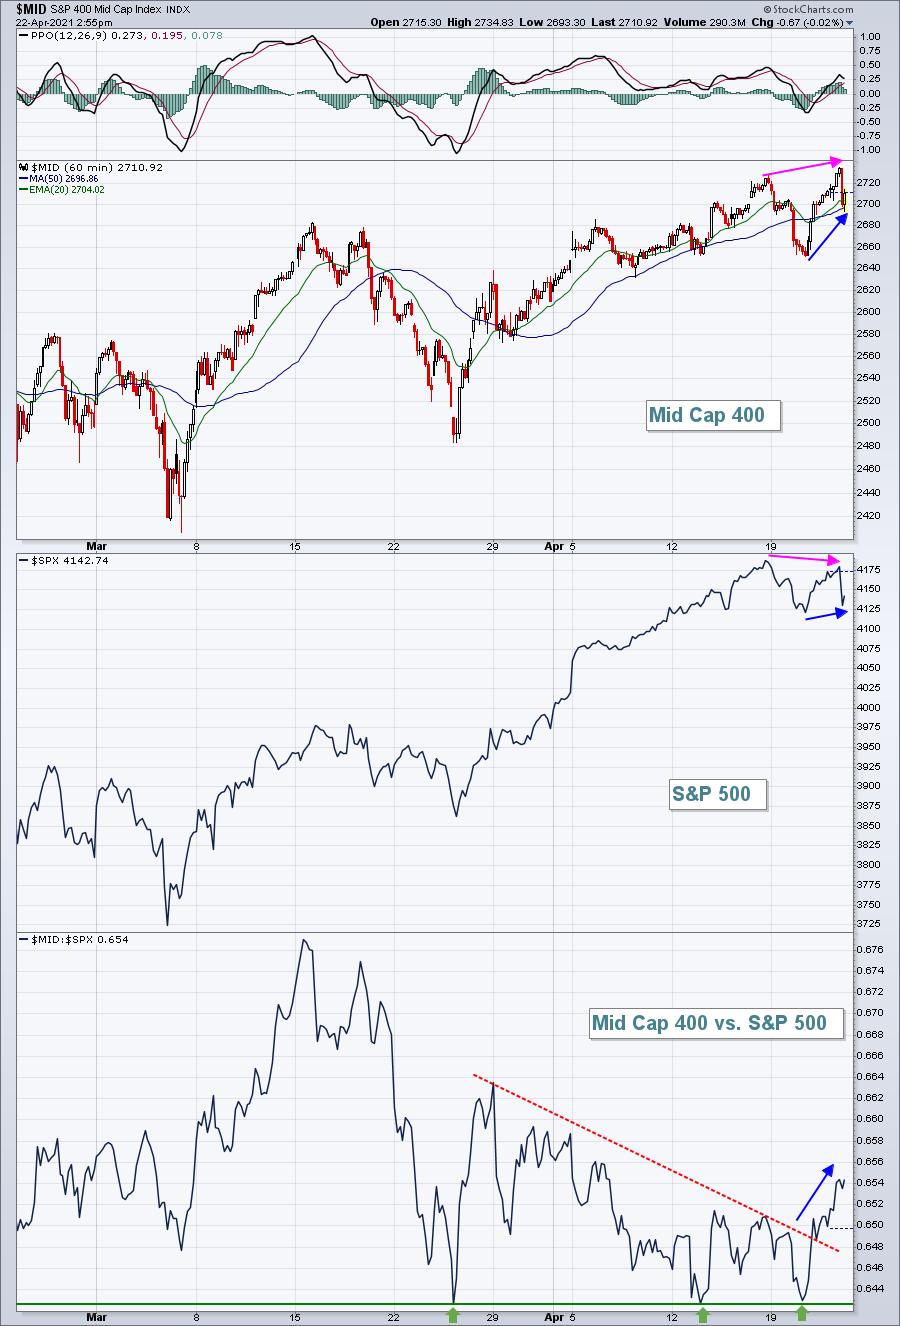
The pink lines compare the highs on the Mid Cap 400 and the S&P 500, while the blue lines compare the lows. In both cases, it's rather obvious to see that Mid Caps seem to be performing better on a relative basis lately. The bottom panel shows this relationship in price-relative form. Relative support is marked by the 3 green arrows, while the blue directional line highlights the breakout of the relative downtrend.
ChartLists/Strategies
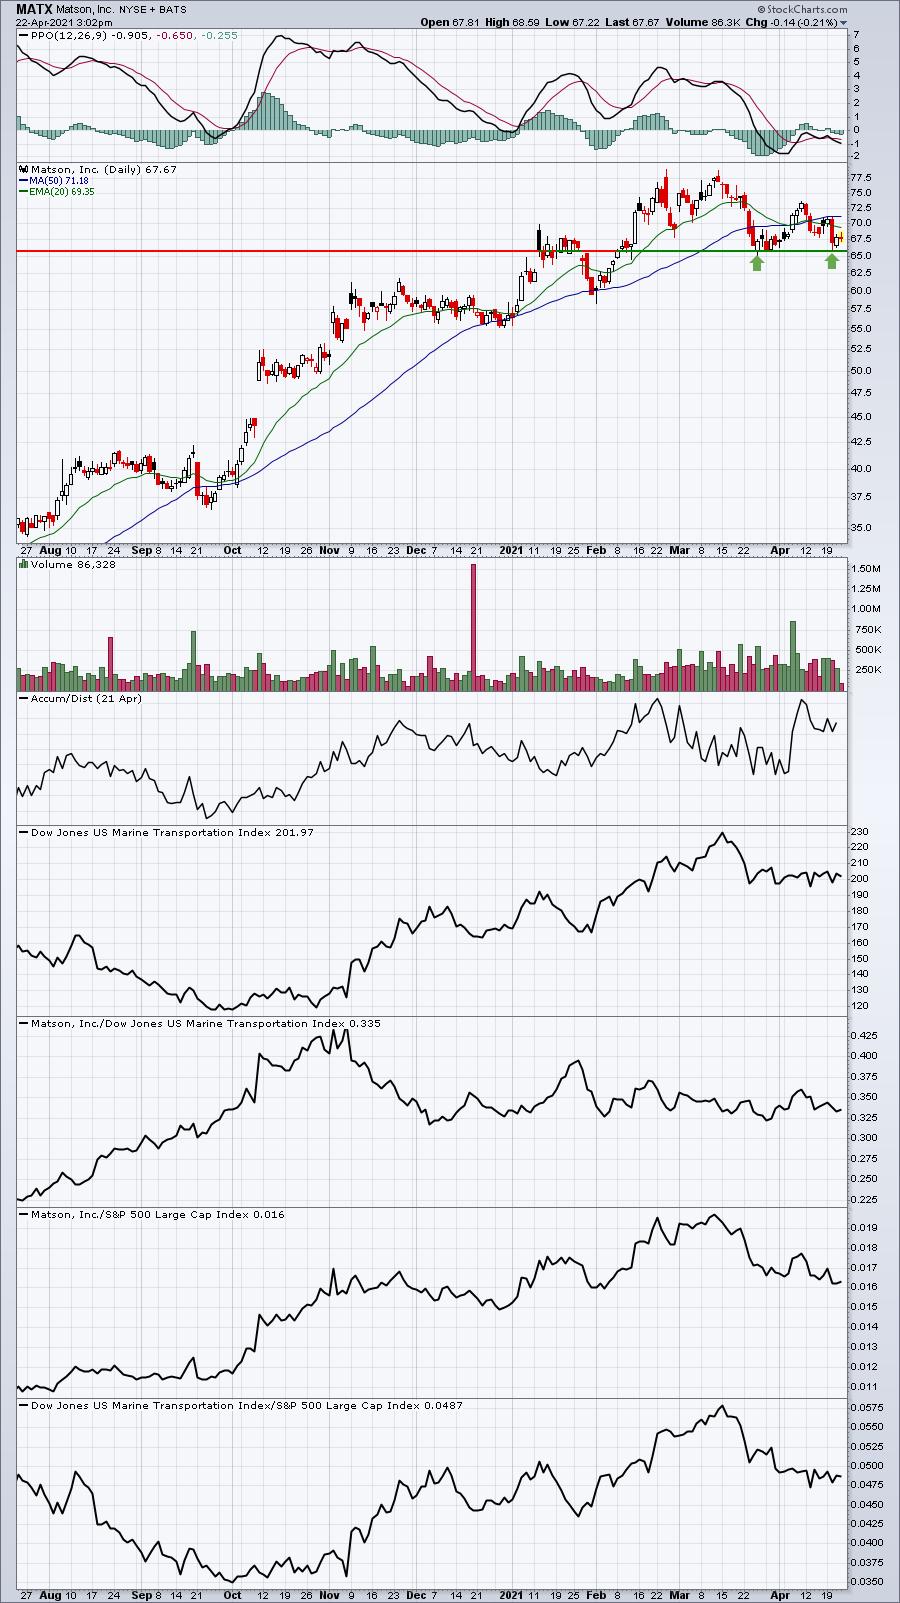
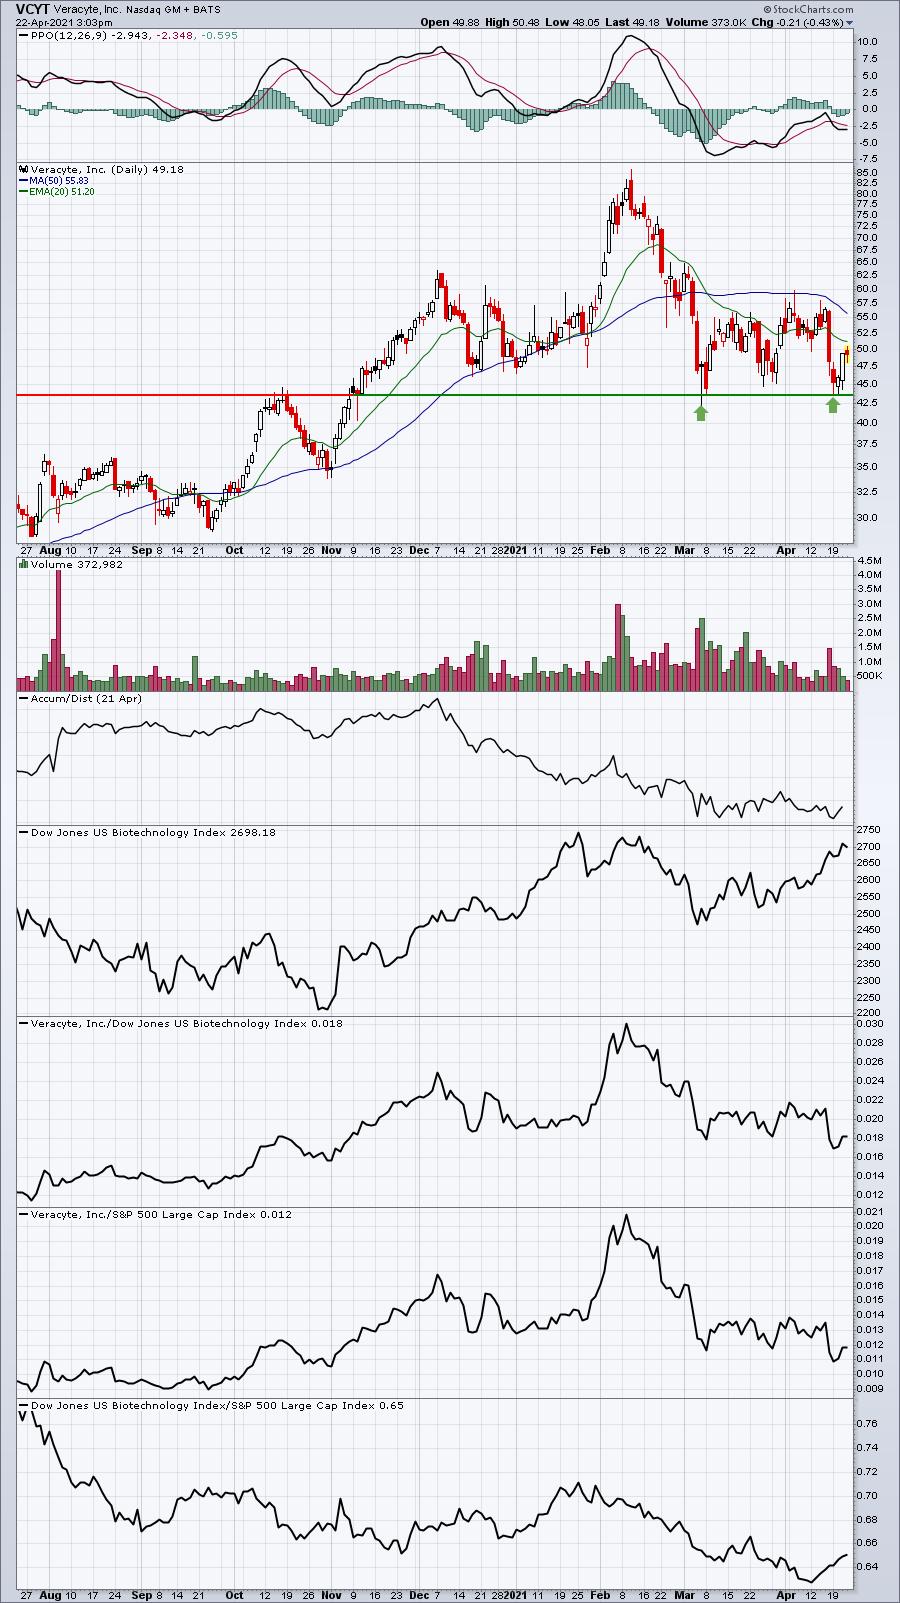
Here are 3 companies that guided future revenues and/or earnings higher over the past couple weeks and are testing or just tested key price support:
MATX:
VCYT:
SMG:
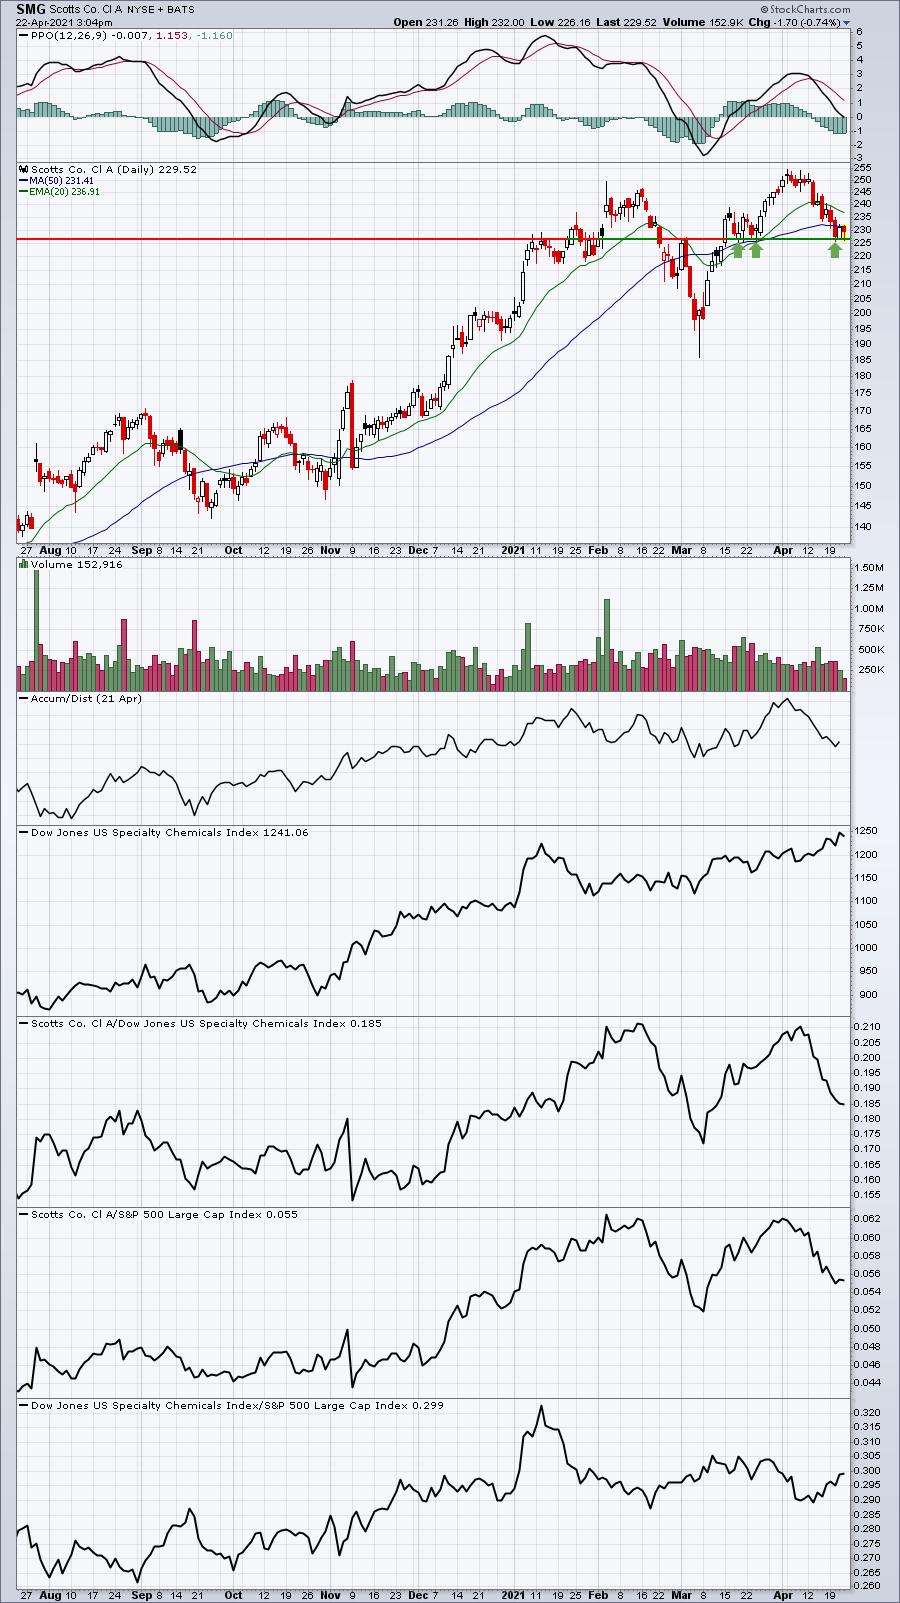
These 3 stocks all come from our Raised Guidance ChartList. You would think that companies raising guidance would hold the price support established PRIOR to the raised guidance news. You would think.
Earnings Reports
Here are the key earnings reports for the next two days, featuring stocks with market caps of more than $10 billion. I also include a few select companies with market caps below $10 billion. Finally, any portfolio stocks that will be reporting results are highlighted in BOLD. If you decide to hold a stock into earnings, please understand the significant short-term risk that you are taking. Please be sure to check for earnings dates for any companies you own or are considering owning.
Thursday, April 22:
INTC, T, DHR, SAP, UNP, SNAP, HCA, FCX, BX, DOW, AEP, IQV, BIIB, LUV, DHI, ODFL, VLO, SIVB, CS, NUE, VRSN, TSCO, MKTX, STX, FE, CE, GPC, DGX, HBAN, SAM, POOL, AAL, SNA, ALLE, WSO, PNR, EWBC, RS, CLF, ALK, MAT, SKX, SON, GTLS, TPH, BJRI
Friday, April 23:
HON, AXP, KMB, SLB, RF, GNTX, ALV
Economic Report
Initial jobless claims: 547,000 (actual) vs. 615,000 (estimate)
March existing home sales: 6,010,000 (actual) vs. 6,205,000 (estimate)
March leading indicators: +1.3% (actual) vs. +0.6% (estimate)
Happy trading!
Tom