
EB Daily Market Report - Thursday, April 29, 2021
Executive Market Summary
- Futures were very strong overnight and we started off on a very positive note
- Apple (AAPL) and Facebook (FB) both posted excellent quarterly results and were rewarded handsomely at the open
- Both names have been sold after the open, especially AAPL, which has moved into negative territory
- The entire market has reversed as volatility has increased on this morning's attempted breakout - more on this below
- Communication services (XLC, +1.87%) remains higher, lifted by the FB earnings report
- Internet stocks ($DJUSNS, +1.46%) are a leading industry group for the same reason
- Financials (XLF, +1.03%) are also performing well with the 10-year treasury yield ($TNX) up 3 basis points to 1.65%
- Q1 GDP came in quite strong at 6.4%, nearly matching consensus estimates of a rise of 6.5%
Market Outlook
When U.S. equities are sailing along, it's always easy to sit back and think, "well, they can't go any higher". That's a very, very poor way to view the market, in my opinion. It's not a great idea to ever try to out-think the stock market. It has a mind of its own and market participants see things a whole lot differently than we do as individuals. Plus, we are swayed by media coverage 24/7. Our tendency is to gravitate to bearish thoughts, so our bias is to cling to those who paint a negative picture of stocks. This is referred to as "confirmation bias". We have a pre-determined set of beliefs - in this case about the stock market - and we tend to believe anyone whose thoughts and beliefs align with ours. Be careful not to fall into this trap.
Follow the charts instead. There is nothing but truth in the charts, especially in regard to the "Big Picture". Yes, short-term manipulative messages can be sent. Max Pain as options expire the third Friday of every month is a perfect example.
As I've written for many, many months, I believe we're in a secular bull market that is likely to overcome all the short-term hurdles thrown at it. But for those who short-term trade, there are signals to consider to lighten positions and to "take cover". These would include some of the following:
- Weekly RSI at or above 70
- Negative divergences (higher price, lower PPO)
- S&P 500 record high with defensive sectors leading
- Rising volatility that accompanies new highs in our major indices
Sector/Industry Focus
To expand a bit further on what I just discussed in the Market Outlook, consider the following:
Weekly RSI overbought:
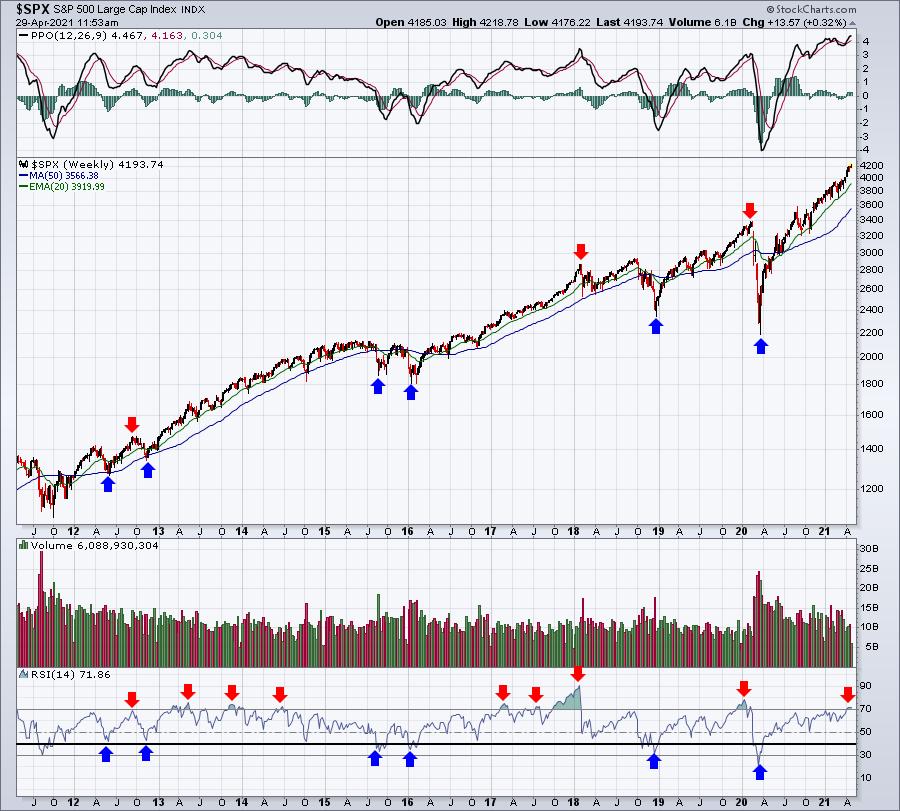
Three intermediate-term tops formed when the weekly RSI moved above 70. But the S&P 500 didn't top exactly when RSI reached 70. In the case of the January 2018 top, the RSI above 70 signal was quite premature. And many RSI 70 readings did little to trigger a binge of selling. My conclusion is that, yes, an overbought market can trigger a short-term decline, but it's not particularly reliable in a secular bull market. Much more reliable is a weekly RSI that dips down to 40 or so. Those blue arrows mark those dips and were quite timely buy signals.
Rising Volatility ($VIX) accompanies S&P 500 uptrend:
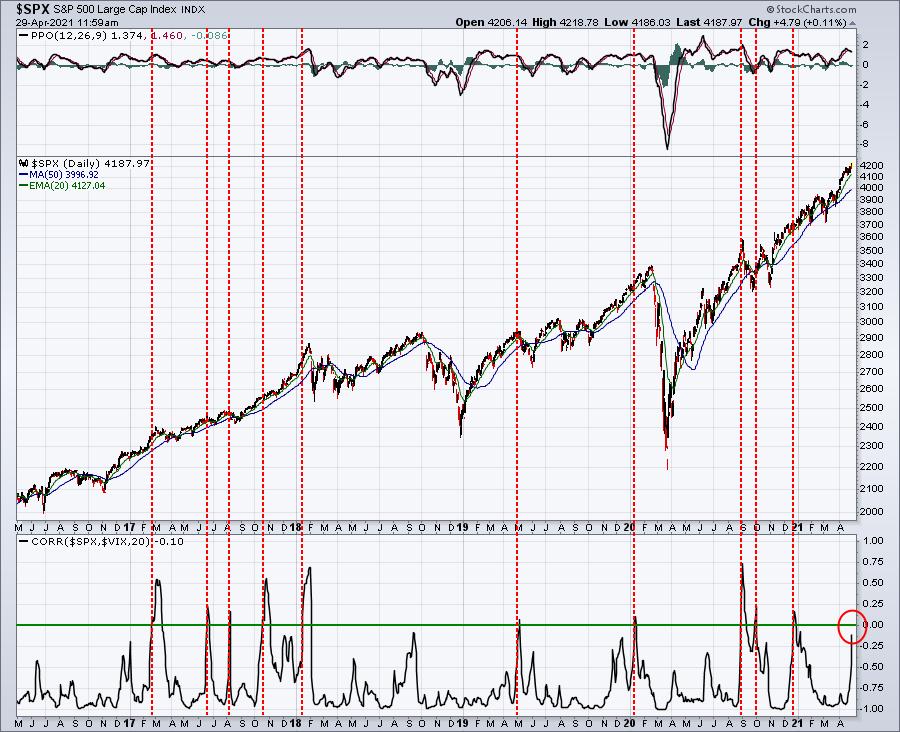
The correlation panel at the bottom of this S&P 500 chart tells us if the S&P 500 and VIX are moving in the same direction for an extended period of time. When this happens, correlation will rise to the zero line and even turn positive on occasion. The thing you have to understand here is that the VIX normally moves opposite the S&P 500. When the S&P 500 falls, the VIX nearly always rises, which indicates that fear is accelerating. As the S&P 500 moves higher, it's quite normal for the VIX to fall back. So when we see the S&P 500 rising AND the VIX rising, it's a red flag to at least consider.
If we move higher over the next 3-5 trading days and the VIX keeps rising and we see the correlation move into positive territory, I'd say the ODDS of a short-term selloff are increasing. No guarantees. You can see from the chart above that a correlation above zero doesn't not always equate to a selloff. However, you should be on alert for that possibility. I wrote an article at the beginning of September 2020 on this very subject. If you'd like to read it, CLICK HERE.
An overbought market, false breakout (on the NASDAQ), and rising volatility tells us we should be a bit more cautious than usual right now. I don't see a major selloff, but a trip down to test the 20-day EMA (another 1.5%) is a short-term possibility. Loss of that moving average could lead to further short-term selling.
ChartLists/Strategies
Given the recently rising VIX, any short-term trades should probably be considered only when you can keep your stops quite tight. Therefore, I'd think about the RSI 40-50 scan on our website, where pullbacks have occurred and support levels are near. When I ran the scan today against our Strong Earnings ChartList, 126 stocks were returned. So I narrowed the RSI to 40-45 instead of 40-50 and 42 stocks were returned. When I only looked at stocks with SCTR scores above 70, I narrowed it further to just 7 stocks: TS, VERI, TMDX, APPN, GM, SGH, SHAK.
TS was the only stock with a SCTR above 90 and I actually liked the setup:
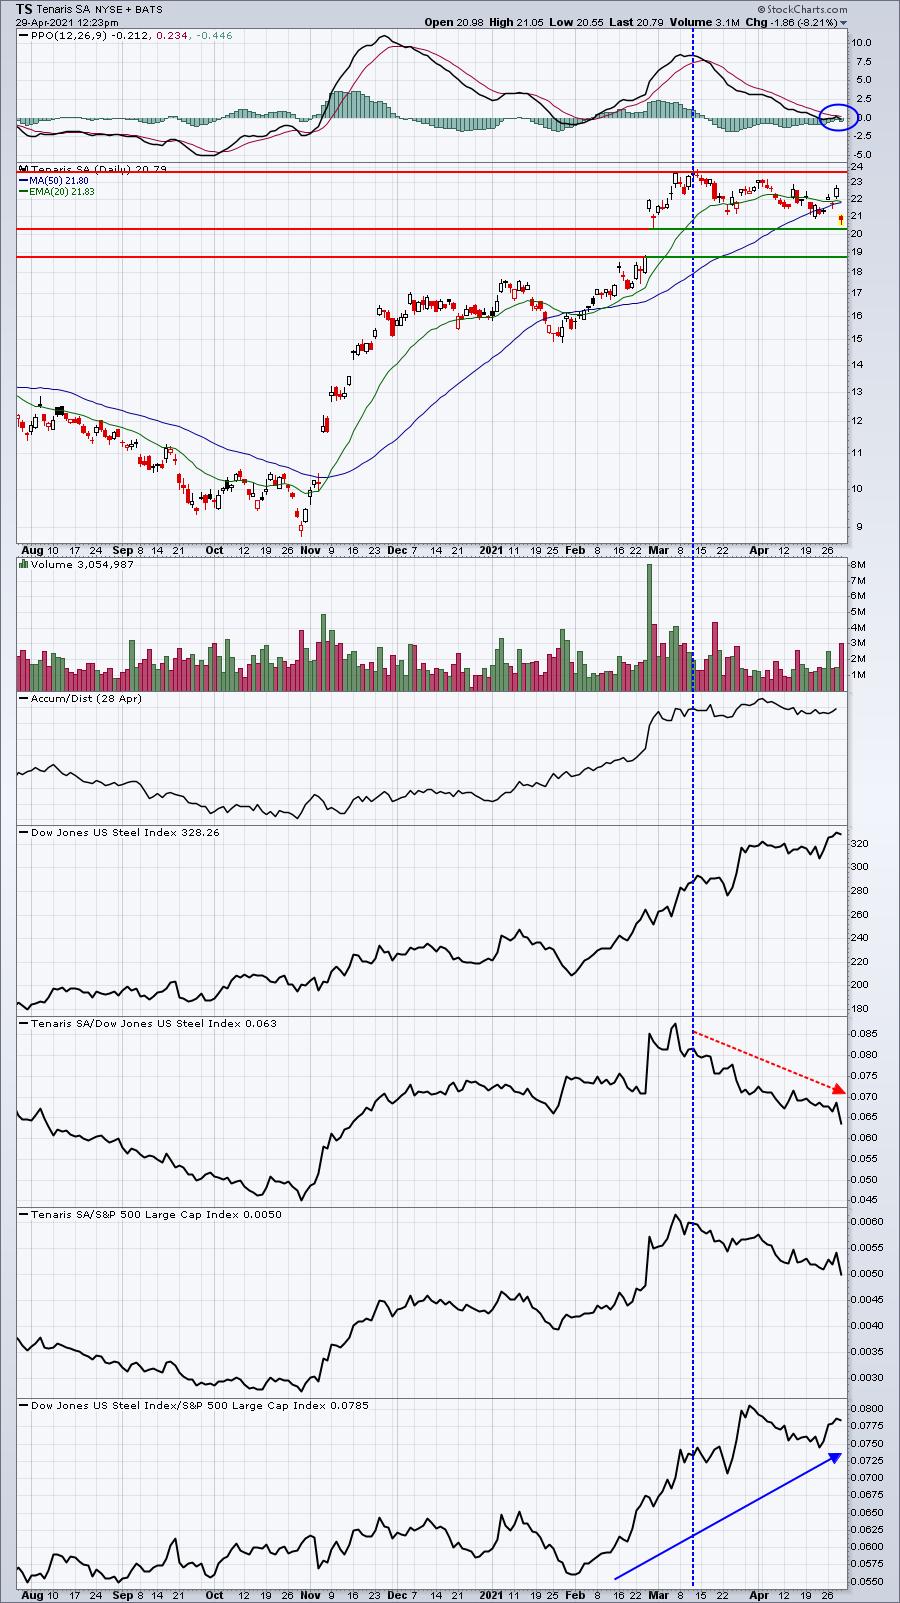
Steel has been a very solid industry vs. the S&P 500 and TS is back near the top of its gap support. It could turn higher at any time with the recent price low (post-gap) as the key intraday stop.
Earnings Reports
Here are the key earnings reports for the next two days, featuring stocks with market caps of more than $10 billion. I also include a few select companies with market caps below $10 billion. Finally, any portfolio stocks that will be reporting results are highlighted in BOLD. If you decide to hold a stock into earnings, please understand the significant short-term risk that you are taking. Please be sure to check for earnings dates for any companies you own or are considering owning.
Thursday, April 29:
AMZN, MA, CMCSA, MRK, TMO, MCD, RDS/A, BMY, CAT, AMT, SPGI, MO, GILD, SO, ICE, EQNR, NIO, VRTX, NOC, TWTR, NEM, KLAC, KDP, KHC, BAX, BCE, DLR, PH, TROW, DXCM, CARR, XEL, STM, FTNT, SWKS, HSY, NWG, TEAM, RMD, WLTW, FMX, CBRE, SGEN, AJG, LH, FTV, WST, NOK, IP, NVCR, RCL, WDC, PCG, CHD, GNRC, TFX, BIO, CMS, TW, ZEN, CTXS, ALNY, VICI, AEM, CLVT, WAB, EMN, ABMD, DPZ, BMRN, CG, FBHS, MHK, ARES, TXT, LKQ, MPW, DVA, FIVN, CPT, LPLA, AGCO, TAP, CX, AOS, GLPI, MMP, ERIE, ATR, WEX, FSLR, SYNH, TPX, COLM, TXRH, WSC, X, COG, SRCL, MSTR, CFX, OMCL, JHG, CLGX, SWI, PRGO, POWI, CRUS, FCN, MTSI, TMHC, MDC, MMSI, ONTO, TEX, OSTK, TREE, GPI, HP, TDS, BLMN, MDRX, ERJ, EHTH, MTLS, FLWS, VCRA, COWN, ETH, MITK, BZH
Friday, April 30:
XOM, CVX, ABBV, AZN, CHTR, ITW, CL, AON, BCS, JCI, LHX, LYB, PSX, WY, CLX, GWW, QSR, IMO, WPC, NWL, CBOE, BSAC, PSXP, HUN, LAZ, CRI, GT, FNMA, B, PBI, SLCA
Economic Report
Q1 GDP (Initial): 6.4% (actual) vs. 6.5% (estimate)
Initial jobless claims: 553,000 (actual) vs. 558,000 (estimate)
March pending home sales: +1.9% (actual) vs. +3.8% (estimate)
Happy trading!
Tom