
EB Daily Market Report - Monday, May 3, 2021
Executive Market Summary
- Futures were strong as we opened up a new trading week and month
- Small caps ($SML) and mid caps ($MID) have claimed leadership today as the S&P 500 tries to close above 4200 for the second time in the past three days
- Energy (XLE, +2.94%) and materials (XLB, +2.04%) lead today's action, while industrials (XLI, +1.30%) and financials (XLF, +1.03%) also perform well
- Four sectors are not participating today, including the three key aggressive sectors - communication services (XLC, -0.27%), consumer discretionary (XLY, -0.20%), and technology (XLK, -0.12%)
- It's been a particularly rough day for renewable energy ($DWCREE, -3.13%)
- Oil equipment & services ($DJUSOI) has jumped 6.24% as crude oil ($WTIC) spikes 1.43% to nearly $64.50 per barrel
- The Volatility Index ($VIX) is down 3%, taking a breather after a recent uptrend - one positive development for U.S. stocks
- Estee Lauder (EL, -7.46%) is the worst performing S&P 500 stock, despite it posting better-than-expected earnings
Market Outlook
There's an old Wall Street adage, "Go Away In May". Personally, I'm not a fan of it, though I will acknowledge that the six month period from November 1st through April 30th is historically superior to the six month period from May 1st through October 31st. The numbers bear this out. However, to simply "go away" in May would be financially irresponsible. Since 1971, here are the annualized returns on the S&P 500 and NASDAQ:
S&P 500:
- May: +6.84%
- June: +5.18%
- July: +7.45%
NASDAQ:
- May: +12.04%
- June: +10.65%
- July: +7.31%
These are not bearish annualized returns. They're not nearly as strong as what we see during the 4th quarter of the year, nor as strong as we see from January through April, but they're not that weak either. Consider the alternative. A 10-year treasury yields 1.61% today.
The true "go away" period is during the summer months, specifically from the July 17th close through the September 27th close. This is based on my actual analysis of the past 5 decades on the NASDAQ and 7 decades on the S&P 500.
Sector/Industry Focus
The year-to-date picture of the sector leaderboard shows the major rotation that's taken place:
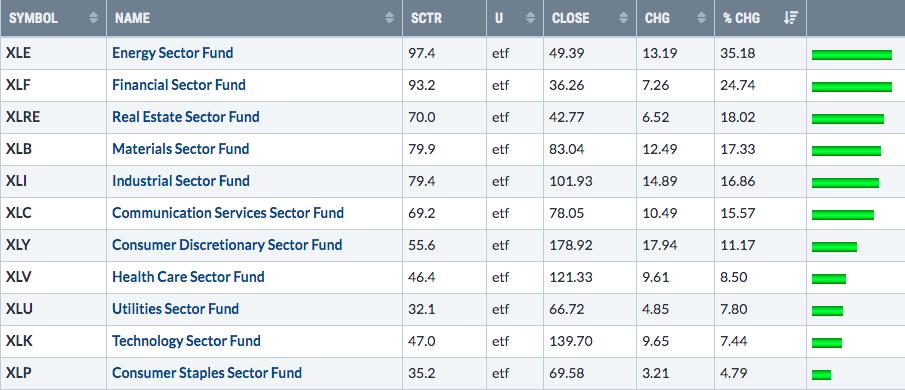
This leaderboard doesn't guarantee us which sector will lead during the balance of 2021, but this picture, together with the Earnings Reaction Excel spreadsheet that we developed recently, certainly provides short-term traders the favorites of Wall Street. It's energy (XLE).
ChartLists/Strategies
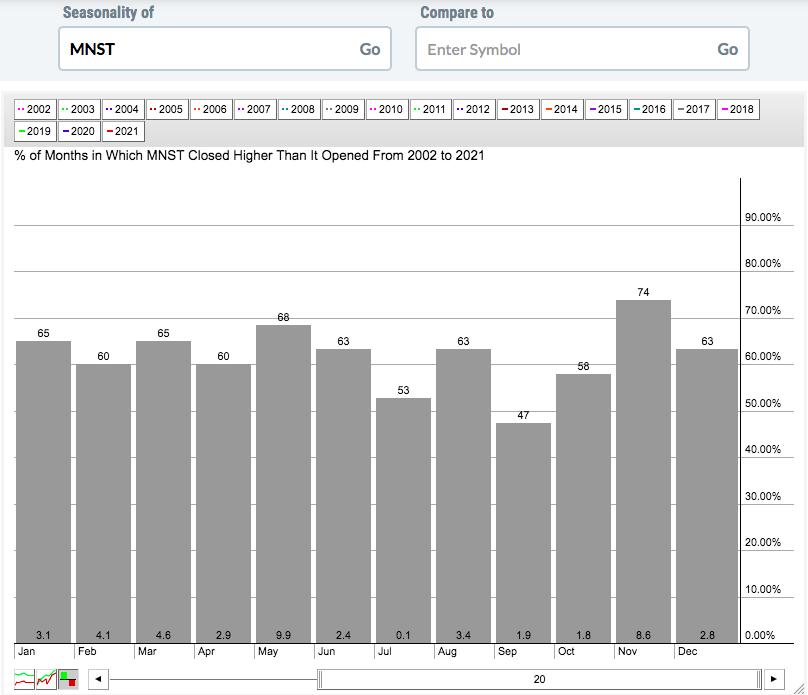
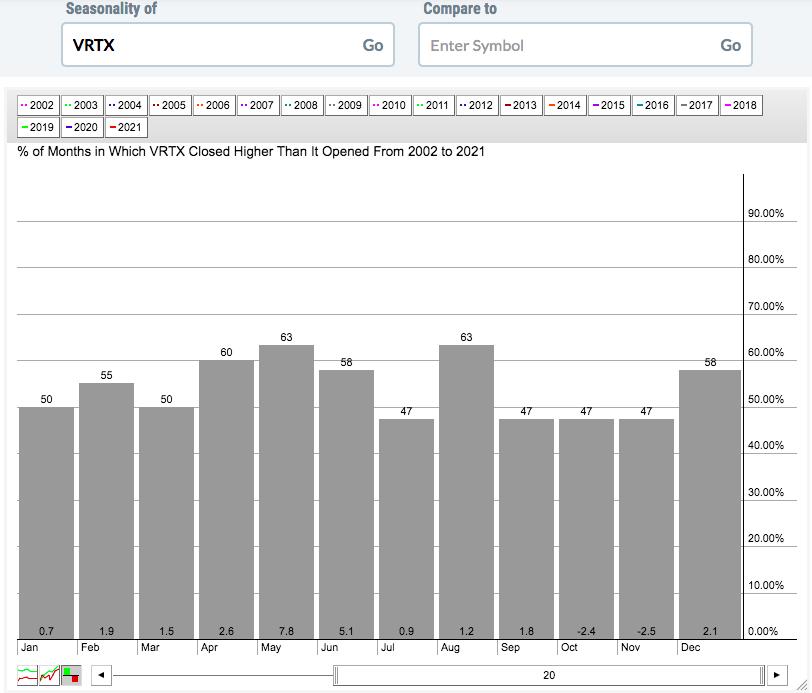
I was out of town over the weekend, so I wasn't able to do the May Seasonality Report. I will be sending it out later this week, but I wanted to provide you with a few top May candidates, based on history, until I can send out the typical list of 20 favorites:
MNST:
VRTX:
MCK:
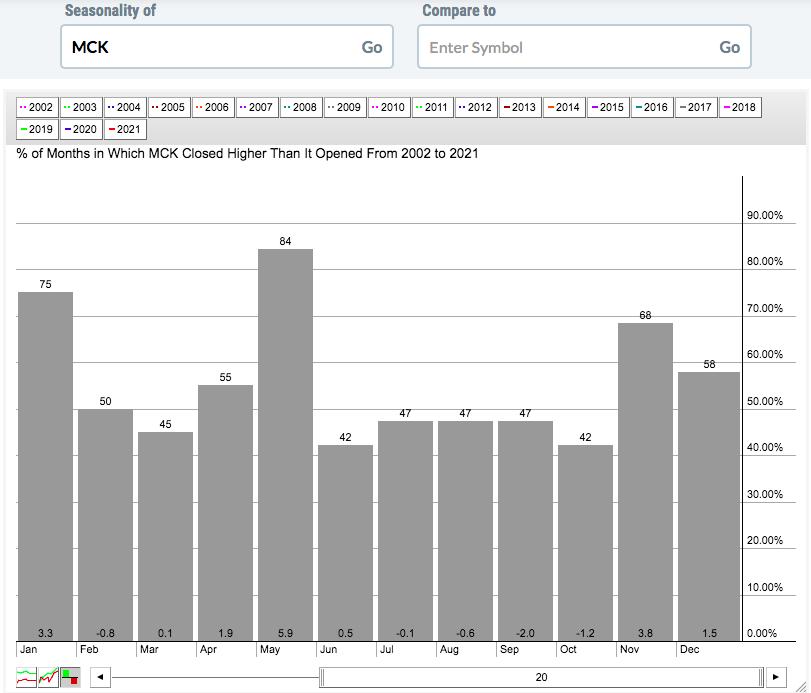
I wouldn't use seasonality as the sole reason to buy or sell a stock, but it can add confidence to a trade. For instance, MCK broke out in March and has consolidated in April. So I'd view this setup more bullishly given the historical pattern:
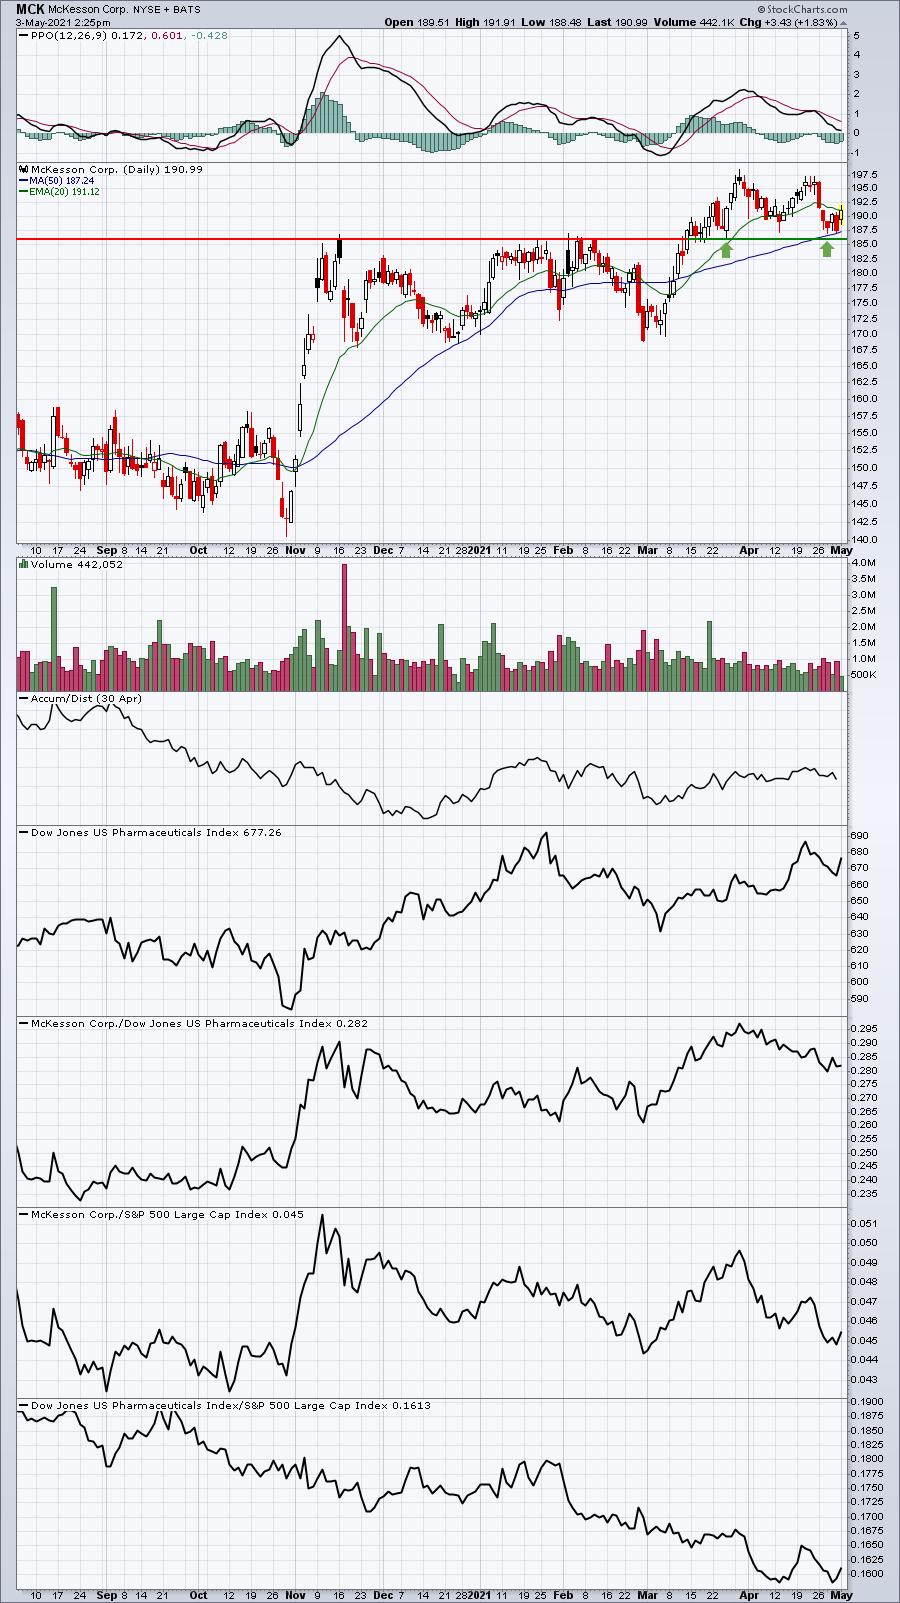
Pharmas haven't been a strong area of the market, though, so I'd be sure to keep my stop fairly tight on MCK. A close below 185-186 would be short-term bearish.
Earnings Reports
Here are the key earnings reports for the next two days, featuring stocks with market caps of more than $10 billion. I also include a few select companies with market caps below $10 billion. Finally, any portfolio stocks that will be reporting results are highlighted in BOLD. If you decide to hold a stock into earnings, please understand the significant short-term risk that you are taking. Please be sure to check for earnings dates for any companies you own or are considering owning.
Monday, May 3:
EL, EPD, ITUB, SU, NTR, WEC, WMB, AWK, O, ZI, ON, AGR, XPO, FANG, SEDG, MOS, CHGG, CNA, JKHY, QGEN, SCI, VNO, LEG, BLDP, AMG, CAR, CR, KMT, FN, IRBT, SANM, REGI, MWA, RMBS, RIG, IAG, TRVG, EVER
Tuesday, May 4:
PFE, TMUS, CVS, MELI, COP, ATVI, GPN, D, ETN, IDXX, TRI, SYY, MTCH, DD, PRU, RACE, CMI, ZBH, ALC, CTVA, MPC, PXD, KKR, XLNX, ZG, AME, VRSK, RNG, MPXL, ZBRA, EC, ANET, VMC, PAYC, EXAS, MLM, XP, CZR, XYL, LNG, WMG, CTLT, LYFT, EXPD, BR, INCY, AMCR, PEAK, AKAM, IT, MPWR, CRL, DVN, BEN, PKI, LDOS, HST, APO, WLK, IPGP, GRFS, BG, RGEN, BHC, PEN, UAA, BEP, MCFE, WU, AFG, HSIC. DLB, LAMR, H, SEE, LSCC, NVTA, SKLZ, NXST, INSP, UPWK, AYX, HLF, SPCE, ALRM, CDLX, RRR, LGIH, CWH, VSH, SPT, CRSR, MBUU, DENN, KOPN
Economic Report
April PMI manufacturing: 60.5 (actual) vs. 60.6 (estimate)
April ISM manufacturing: 60.7 (actual) vs. 65.0 (estimate)
February construction spending: +0.2% (actual) vs. +2.0% (estimate)
Happy trading!
Tom