
EB Daily Market Report - Tuesday, May 4, 2021
Executive Market Summary
- Futures were lower overnight and our major indices all started in negative territory
- The Dow Jones has held up best on a relative basis, while the NASDAQ has taken a drubbing
- Materials (XLB, +0.40%) and financials (XLF, +0.29%) have held up best
- Technology (XLK, -2.48%), communication services (XLC, -1.98%), and consumer discretionary (XLY, -1.80%) are the clear laggards today
- Within these 3 weak sectors, many key industry groups are seeing a lot of selling, namely, renewable energy ($DWCREE, -4.83%), computer hardware ($DJUSCR, -3.92%), and internet ($DJUSNS, -3.21%)
- Reopening stocks have had a clear and definitive edge in trading throughout the session
- Volatility ($VIX, +12.73%) has spiked above 20 for the first time this quarter
- Despite the increase in fear, gold ($GOLD) is down 0.82%; crude oil ($WTIC), on the other hand, is up 1.44% to $65.42 per barrel
Market Outlook
The movement away from growth stocks can be illustrated in plenty of ways, but two of the ways that I review it regularly is via two ratios - growth vs. value (IWF:IWD) and NASDAQ 100 vs. S&P 500 (QQQ:SPY). Today, I'll review and update what I'm seeing on the IWF:IWD chart:
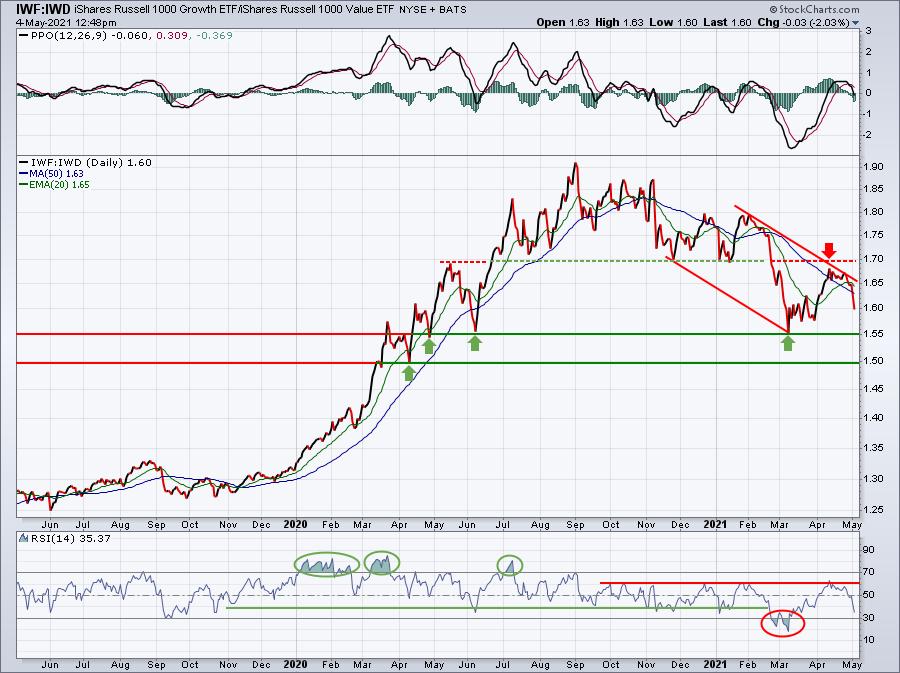
The character of this chart changed on February 22nd when we lost relative support near 1.69. It's a level that was discussed for weeks and weeks in 2020 and early 2021. When that level broke, it was unfortunately a harbinger of of more rotation away from growth. While it was difficult to predict at the time how long this rotation would last, it's definitely continued throughout the past 2-3 months. This rising ratio was a huge tailwind for our portfolios in 2020, but has been the opposite for us this past quarter.
We remain in a downtrend currently in this ratio, but I'd watch to see if the 1.50-1.55 relative support holds. If so, a return to growth stocks is much more likely. Should these two relative support levels fail, then we're very likely to see much of the same rotation we've witnessed for the past couple months. Also, take a look at the behavior of the "relative" RSI readings. When the IWF:IWD ratio was rising, RSI 40 held as support, while we saw 3 different occasions where RSI moved above 70 - even moving into the 80s. Now that the downtrend is in place, we see tops near RSI 60 and relative rotation away from growth stocks has resulted in one period where the RSI fell back below 30 support. I would feel much more comfortable with growth stocks when the current down channel is broken and we see RSI for this ratio push back towards 70. Until that occurs, growth stocks will likely remain challenged on a relative basis.
Sector/Industry Focus
Biotechs ($DJUSBT) have not really participated in the secular bull market advance, dating back to June of last year. The group is in an uptrend, but recent lows are barely above the June 2020 high. This is a group that certainly could benefit from further market rotation. I'd be keeping an eye on key price resistance near 2750, while simultaneously watching to see if the rising 20 day EMA support holds. On an intraday basis, we're currently below that level:
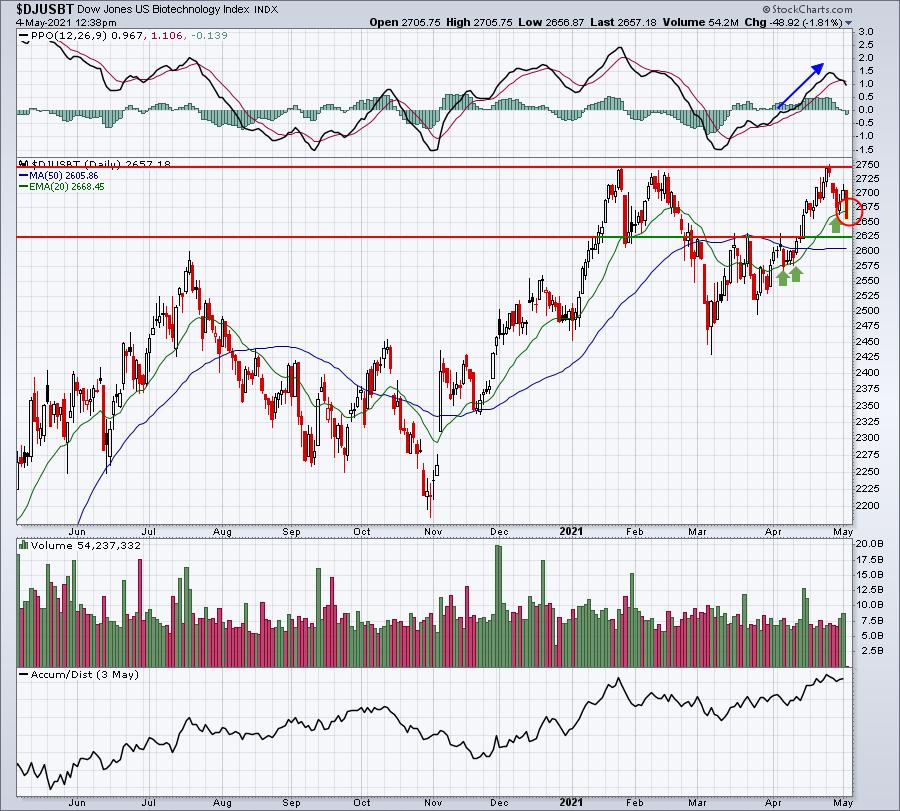
A strong finish back above the 20-day EMA would be short-term bullish, given that the PPO had been moving straight up throughout the recent uptrend. When a PPO is this strong, I generally expect that rising 20-day EMA to provide great support. It did a few days ago, but it's being tested again today.
ChartLists/Strategies
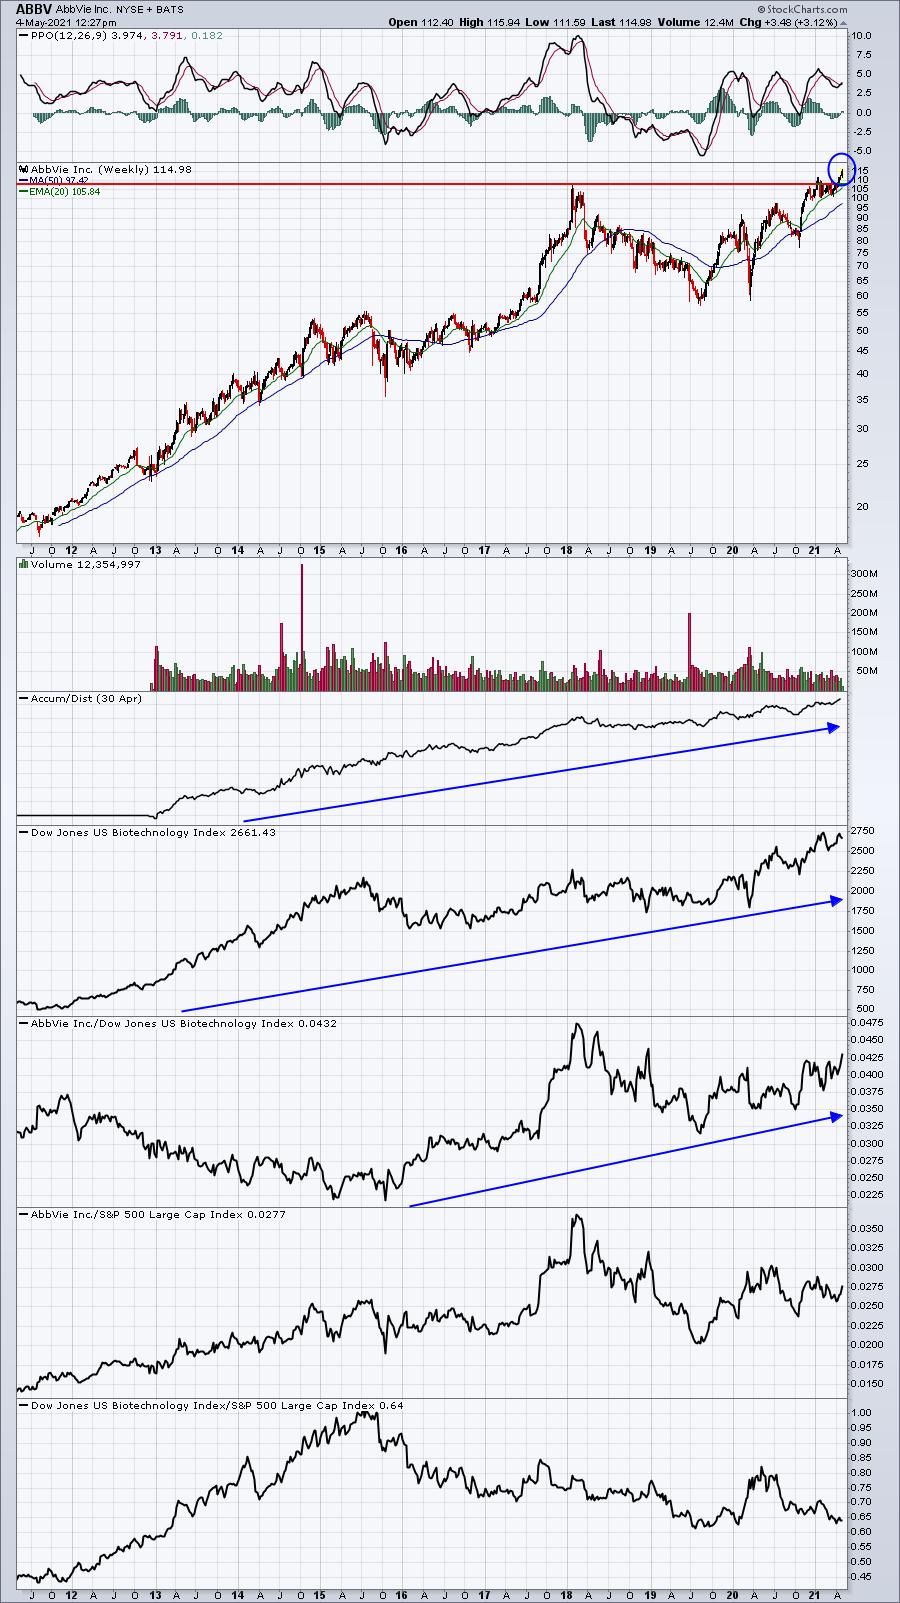
Given the continuing shift away from technology stocks, I wanted to feature a couple of biotech stocks that we will be adding to our Strong Earnings ChartList (SECL) over the next couple days. These two companies both reported better-than-expected revenues and EPS in their latest quarters (they reported results on Friday morning). Both of these stocks have broken out on their long-term charts:
ABBV:
ALXN:
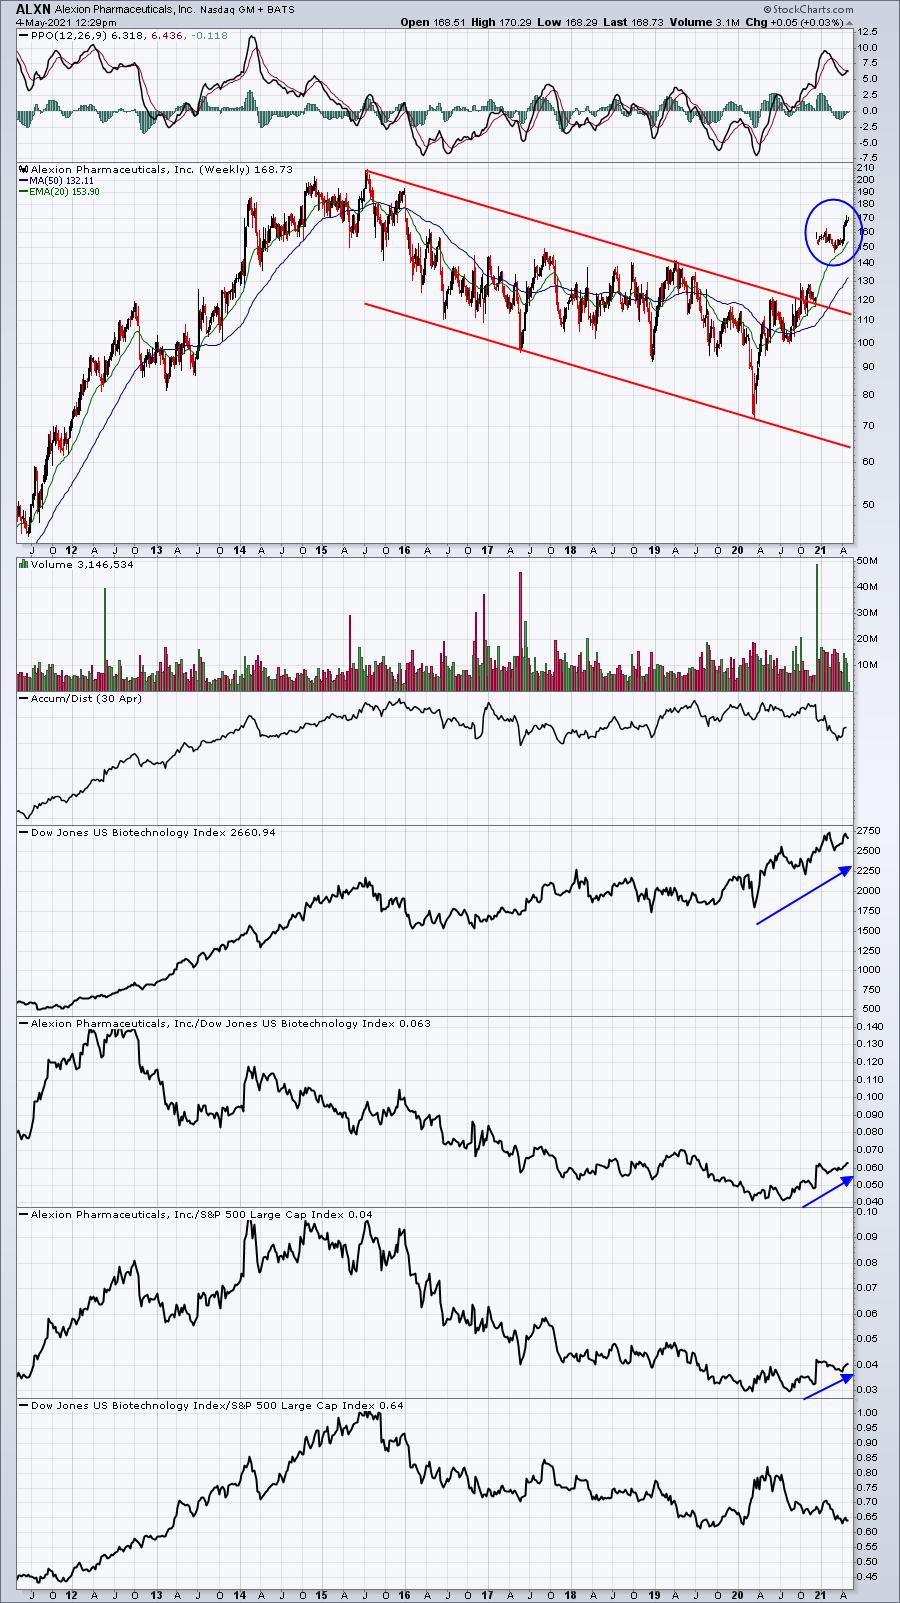
I'd consider ABBV to be the more consistent performer, while ALXN has been helping to lead the more recent charge higher in biotechs. All biotechs tend to be volatile, so I wouldn't necessarily consider either of these trade candidates to be "safe", but I would expect ABBV to perhaps be a little less volatile. Much of this likely has to do with size as ABBV boasts a market cap above $200 billion, while ALXN's is much lower at $37 billion.
Earnings Reports
Here are the key earnings reports for the next two days, featuring stocks with market caps of more than $10 billion. I also include a few select companies with market caps below $10 billion. Finally, any portfolio stocks that will be reporting results are highlighted in BOLD. If you decide to hold a stock into earnings, please understand the significant short-term risk that you are taking. Please be sure to check for earnings dates for any companies you own or are considering owning.
Tuesday, May 4:
PFE, TMUS, CVS, MELI, COP, ATVI, GPN, D, ETN, IDXX, TRI, SYY, MTCH, DD, PRU, RACE, CMI, ZBH, ALC, CTVA, MPC, PXD, KKR, XLNX, ZG, AME, VRSK, RNG, MPXL, ZBRA, EC, ANET, VMC, PAYC, EXAS, MLM, XP, CZR, XYL, LNG, WMG, CTLT, LYFT, EXPD, BR, INCY, AMCR, PEAK, AKAM, IT, MPWR, CRL, DVN, BEN, PKI, LDOS, HST, APO, WLK, IPGP, GRFS, BG, RGEN, BHC, PEN, UAA, BEP, MCFE, WU, AFG, HSIC. DLB, LAMR, H, SEE, LSCC, NVTA, SKLZ, NXST, INSP, UPWK, AYX, HLF, SPCE, ALRM, CDLX, RRR, LGIH, CWH, VSH, SPT, CRSR, MBUU, DENN, KOPN
Wednesday, May 5:
PYPL, UBER, BKNG, GM, MELI, TWLO, MET, EMR, RKT, EXC, CTSH, MFC, SRE, TT, ALL, GOLD, HLT, RSG, STLA, PEG, ANSS, SLF, FNV, ETSY, CDW, HUBS, ABC, FLT, CERN, FOXA, TXG, QRVO, HZNP, FTS, TRMB, CNHI, ALB, WAT, LBTYA, FMC, FICO, WYNN, GDDY, WRK, EQH, LUMN, CDAY, ATO, SMG, LNC, ZNGA, BWA, WTRG, GFL, CF, BRKR, DNB, NI, RUN, JLL, UTHR, MRO, APA, RDFN, ADT, GIL, XEC, FSLY, UNM, TNDM, CYBR, EQT, CLH, SPR, SPWR, QLYS, NUVA, KLIC, KTOS, BAND, SGRY, VCEL, INMD, NUS, GDOT, EQX, SBGI, HUBG, TTGT, SKT, ATSG, WLL, SSYS, PLYA, TUP, QNST, INSG,
Economic Report
March factory orders: +1.1% (actual) vs. +1.3% (estimate)
Happy trading!
Tom