
EB Daily Market Report - Wednesday, May 5, 2021
Executive Market Summary
- Futures were strong and signaled an early rebound in the tech-laden NASDAQ
- That strong NASDAQ open did materialize, but we've seen that early leadership fall apart as the NASDAQ was clinging to a small gain at last check
- Meanwhile, the Dow Jones has set another all-time record high, led by breakouts in Dow Holdings (DOW, +2.69%), Goldman Sachs (GS, +2.64%), and Caterpillar (CAT, +2.18%)
- Energy (XLE, +3.19%) and materials (XLB, +1.30%) remain on top of the sector leaderboard
- Two defensive groups - utilities (XLU, -2.09%) and real estate (XLRE, -1.30%) - are major laggards on the session
- Technology (XLK, +0.26%) clings to a gain, but software ($DJUSSW, -0.21%) is not helping
Market Outlook
Yesterday, I featured the IWF:IWD chart (growth vs. value) to illustrate the significant rotation that's taken place over the past several months, but especially the past 2-3 months. The other ratio that I mentioned in yesterday's DMR was the QQQ:SPY, a ratio that tells us how the NASDAQ 100 is performing vs. the benchmark S&P 500. A similarly bad picture is drawn here:
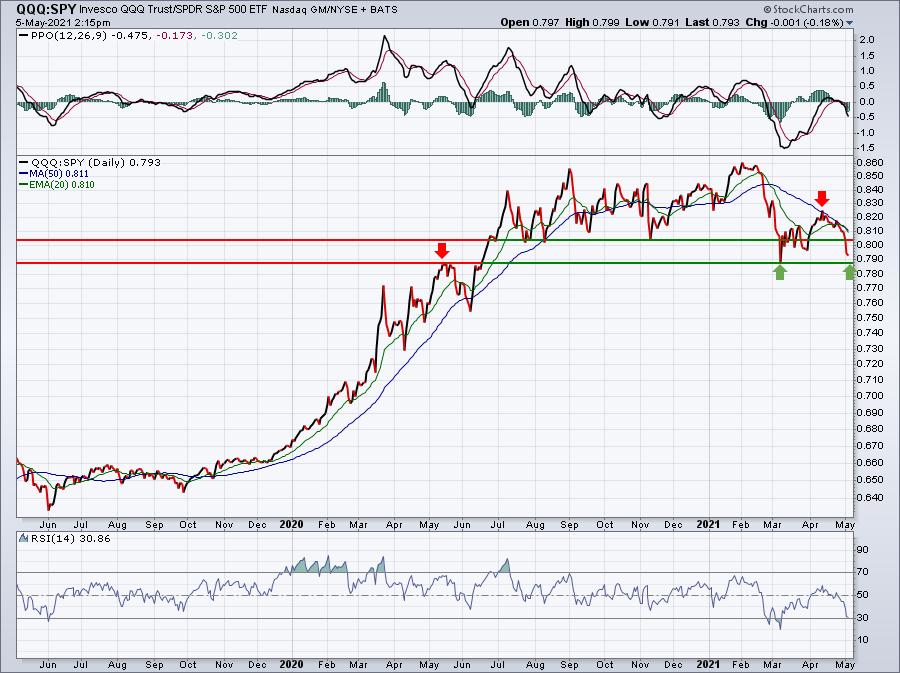
While I didn't annotate the RSI, I think you'll see a similar setup on this chart as we had on the IWF:IWD chart. RSI resistance is now at 60, while moves into oversold territory are becoming more common. Prior to February, this ratio saw its RSI trade mostly from 40+.
Sector/Industry Focus
Toys ($DJUSTY) was one of the best performing industry groups during the pandemic, but have been the poster child of what's gone wrong since mid-February:
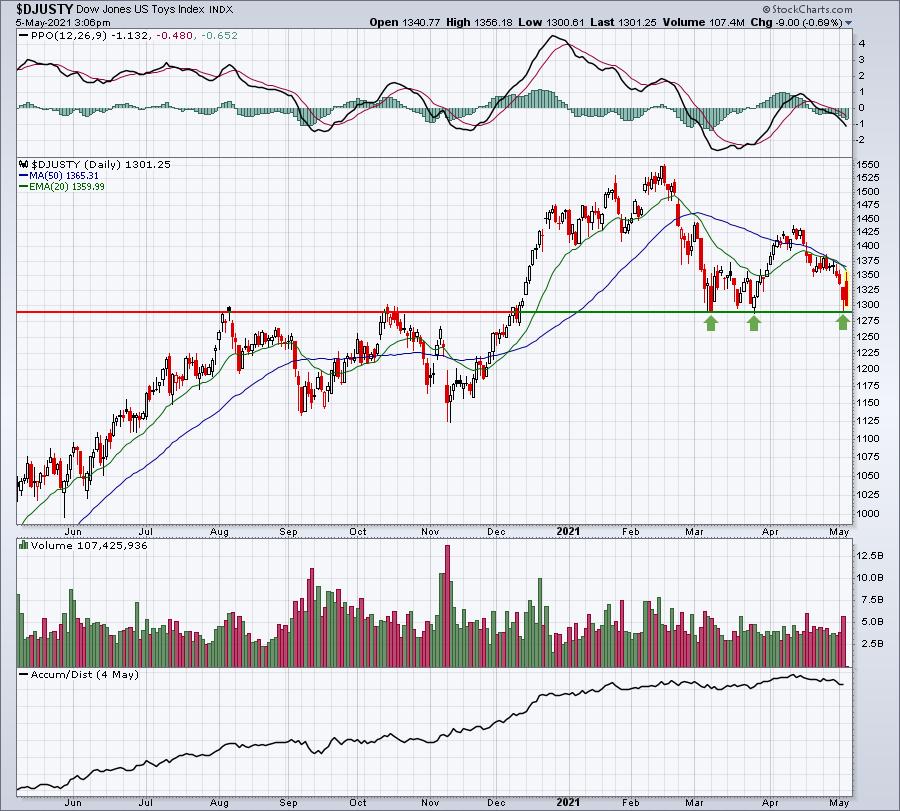
Like the NASDAQ, toys got off to a great start this morning, but completely reversed and now is testing that key support again. Failure to hold support just below 1300 would likely result in a revisit to the September/November double bottom in the 1140-1150 area.
ChartLists/Strategies
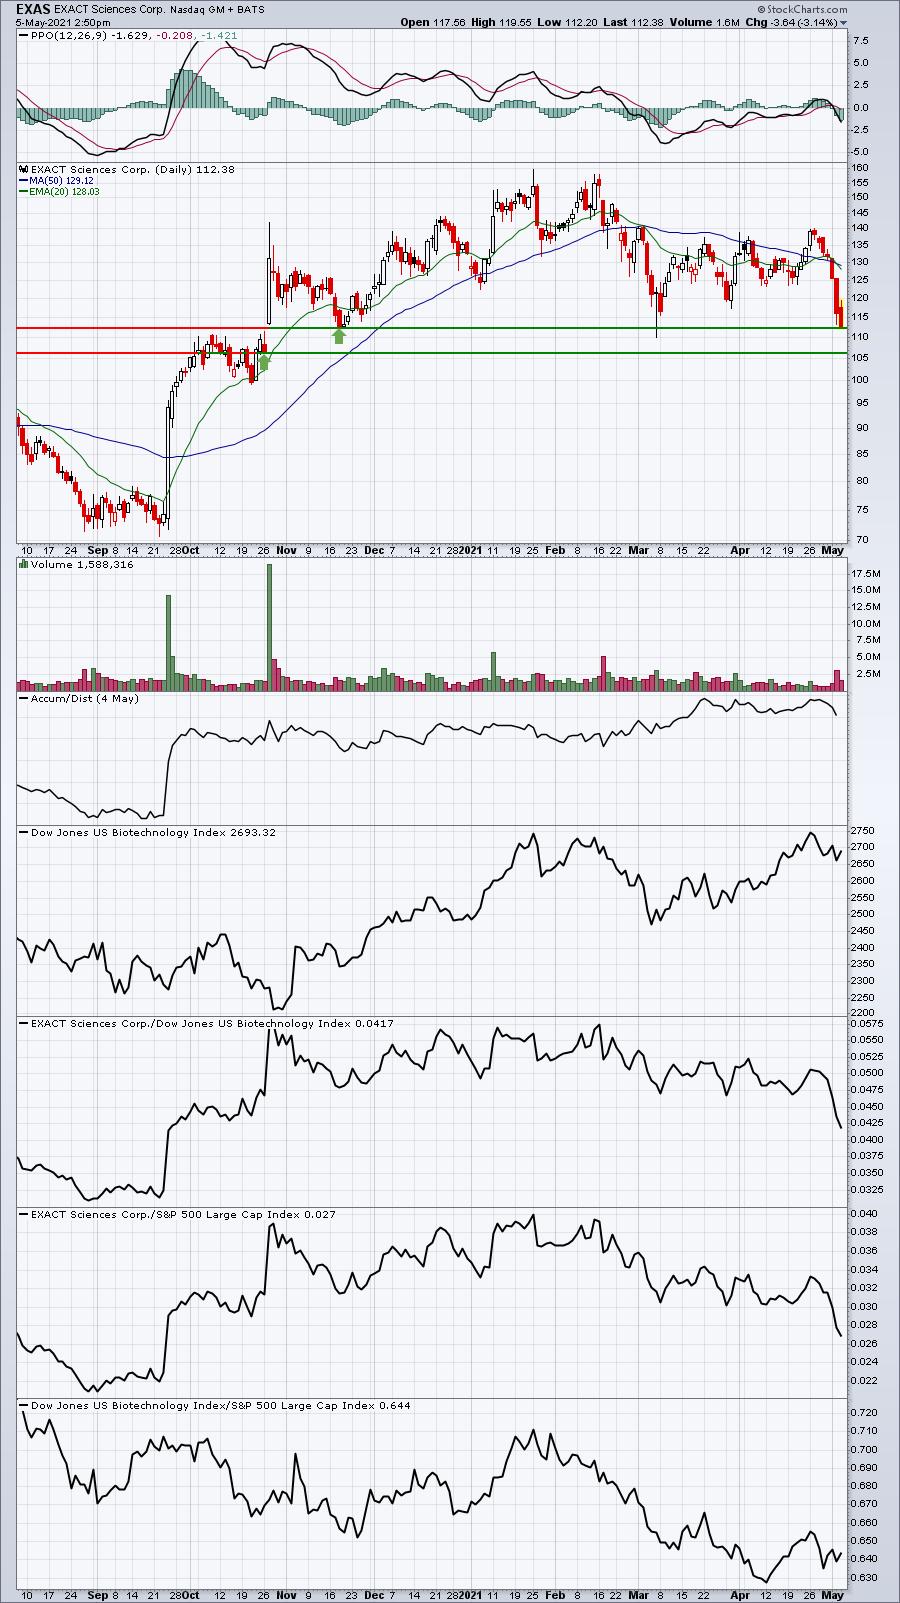
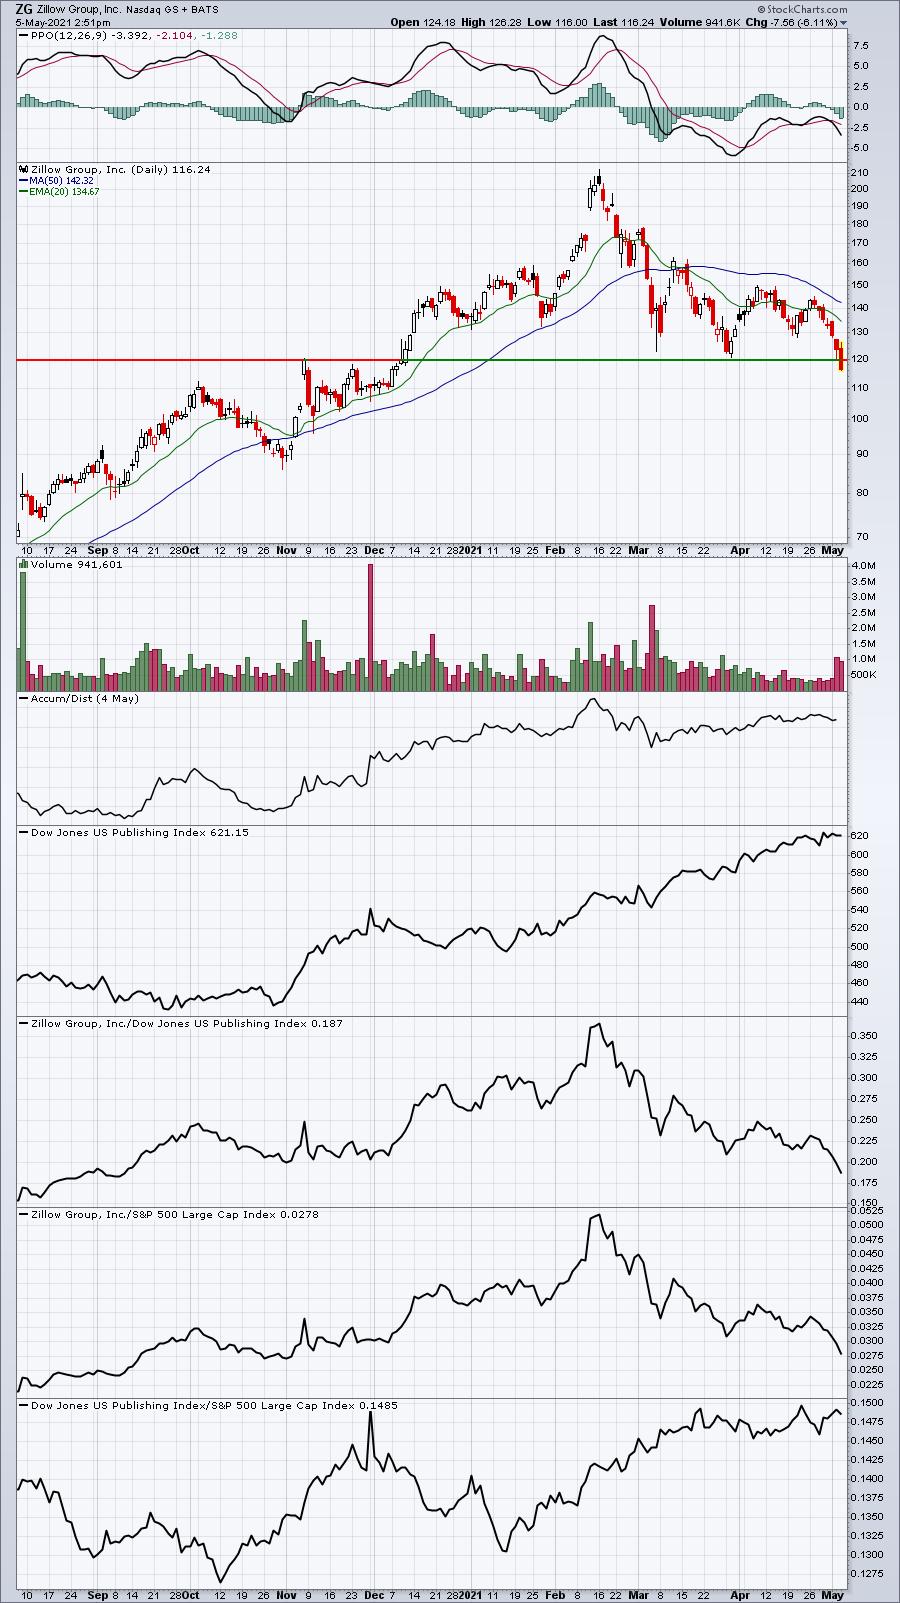
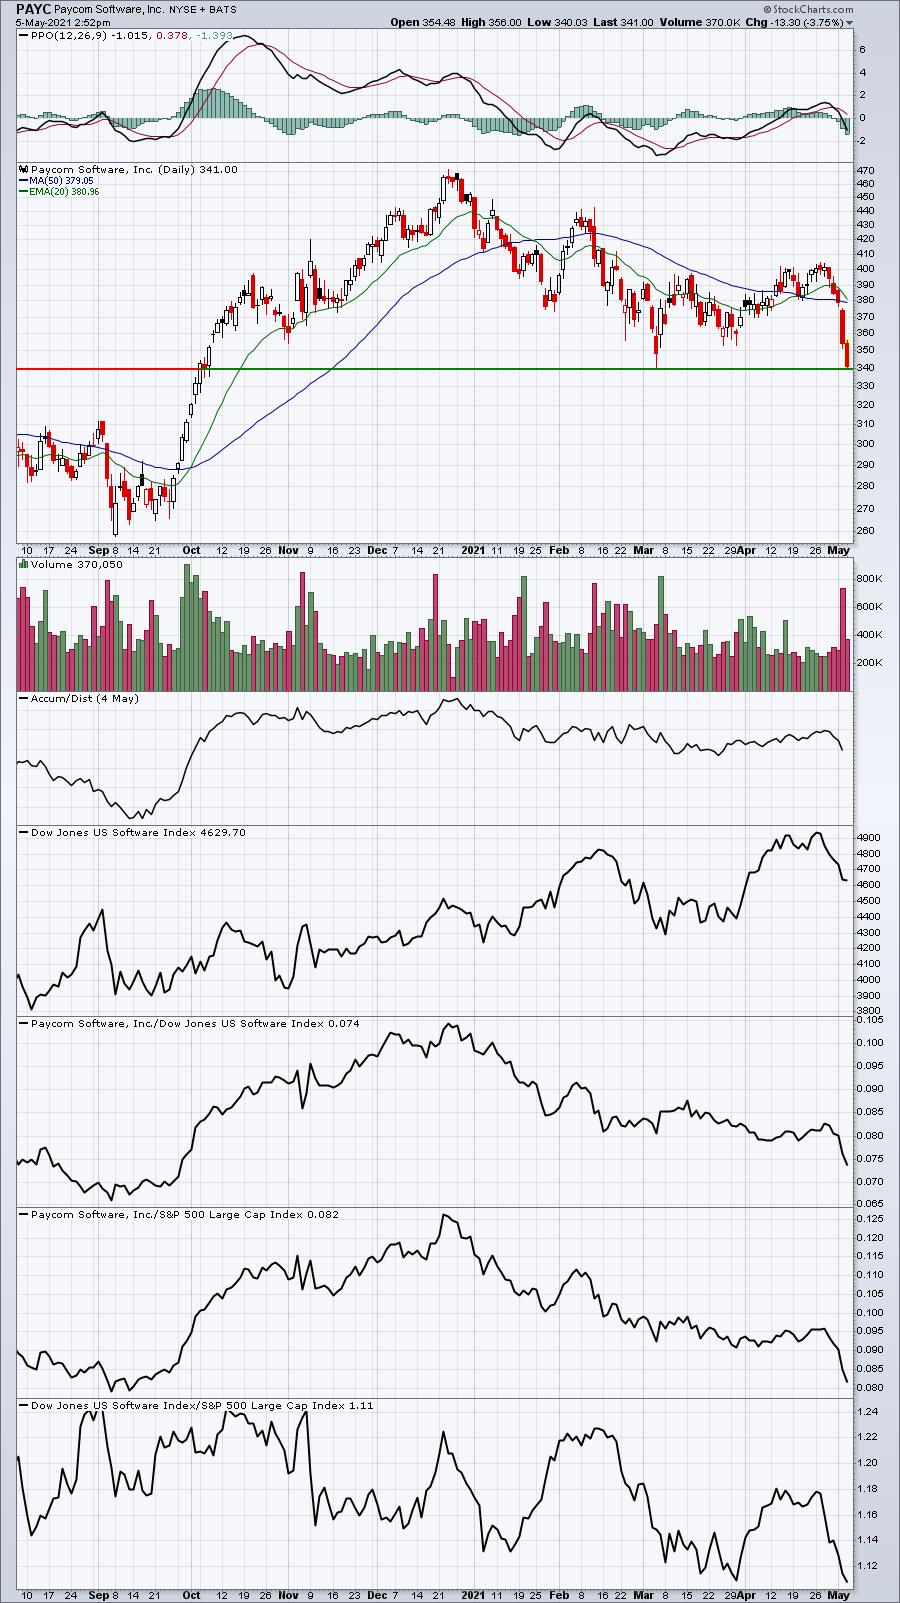
If you're feeling bold, there are some companies that just reported better-than-expected earnings that are dropping and near or at MAJOR price support. A rebound could be in order, but if they fail, I'd exit quickly. Here they are:
EXAS:
ZG:
PAYC:
VIAV:
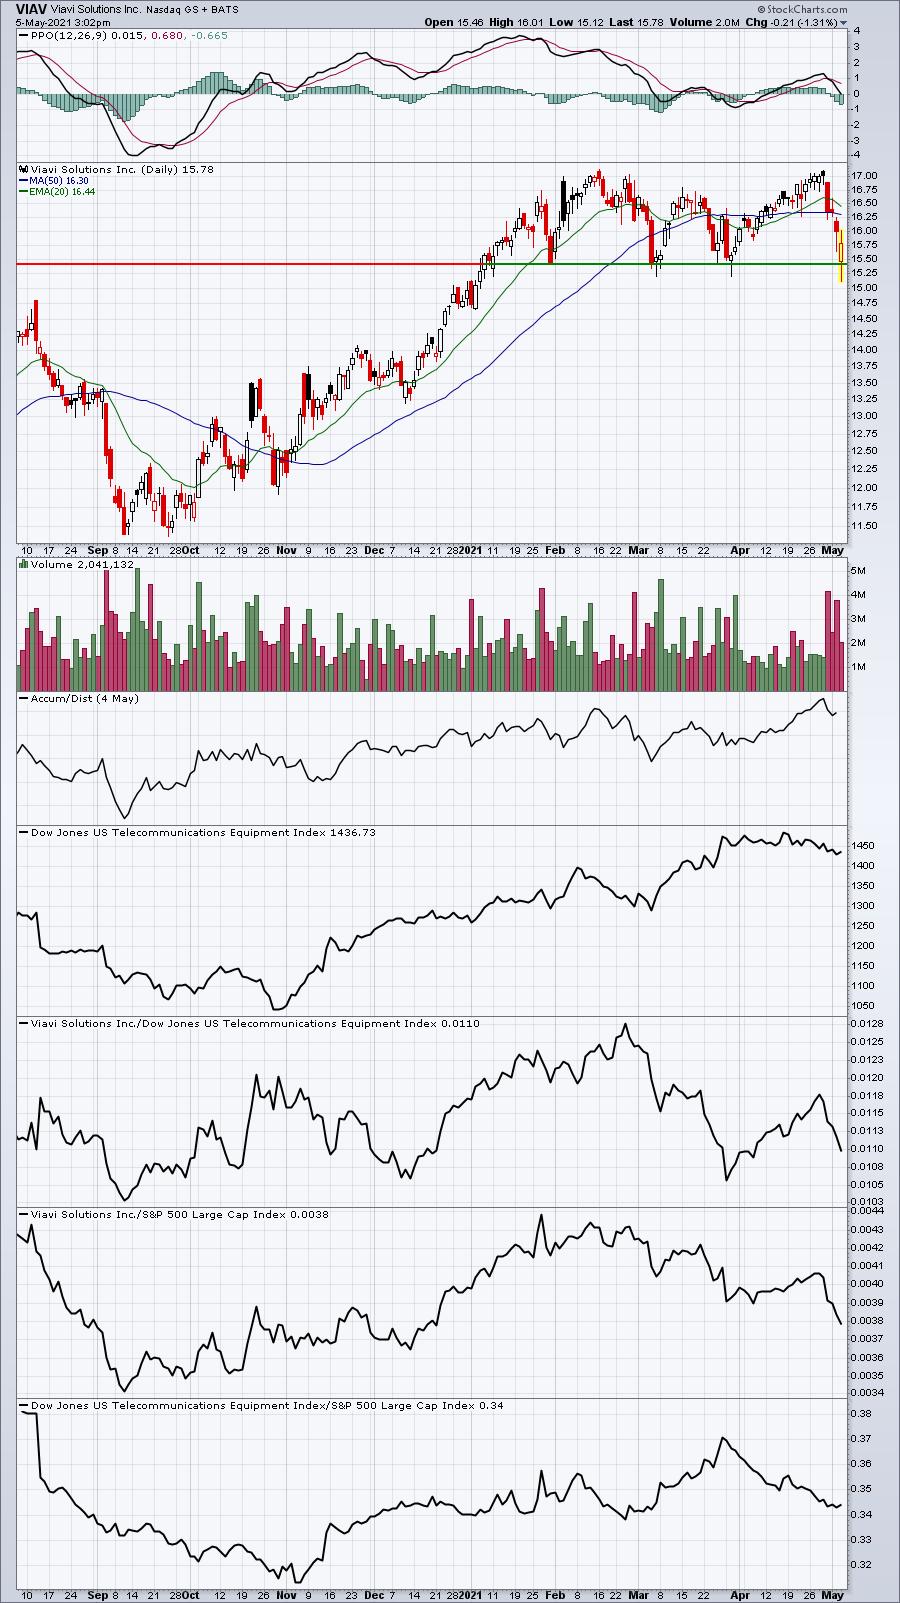
ZG is threatening a breakdown unless we see a reversal in the final hour. The others, at this point, are still holding onto the price support highlighted.
Earnings Reports
Here are the key earnings reports for the next two days, featuring stocks with market caps of more than $10 billion. I also include a few select companies with market caps below $10 billion. Finally, any portfolio stocks that will be reporting results are highlighted in BOLD. If you decide to hold a stock into earnings, please understand the significant short-term risk that you are taking. Please be sure to check for earnings dates for any companies you own or are considering owning.
Wednesday, May 5:
PYPL, UBER, BKNG, GM, MELI, TWLO, MET, EMR, RKT, EXC, CTSH, MFC, SRE, TT, ALL, GOLD, HLT, RSG, STLA, PEG, ANSS, SLF, FNV, ETSY, CDW, HUBS, ABC, FLT, CERN, FOXA, TXG, QRVO, HZNP, FTS, TRMB, CNHI, ALB, WAT, LBTYA, FMC, FICO, WYNN, GDDY, WRK, EQH, LUMN, CDAY, ATO, SMG, LNC, ZNGA, BWA, WTRG, GFL, CF, BRKR, DNB, NI, RUN, JLL, UTHR, MRO, APA, RDFN, ADT, GIL, XEC, FSLY, UNM, TNDM, CYBR, EQT, CLH, SPR, SPWR, QLYS, NUVA, KLIC, KTOS, BAND, SGRY, VCEL, INMD, NUS, GDOT, EQX, SBGI, HUBG, TTGT, SKT, ATSG, WLL, SSYS, PLYA, TUP, QNST, INSG
Thursday, May 6:
LIN, BUD, SQ, FIS, ZTS, MRNA, BDX, REGN, MNST, CVNA, EOG, ROKU, AIG, MCHP, APTV, CNQ, MSI, MTD, BLL, MCK, MT, W, MGA, PTON, ED, NET, EPAM, EXPE, VIAC, DDOG, ET, PPL, IAC, K, WPM, PODD, AES, CAH, LYV, PBA, TECH, BIP, NWSA, GH, XRAY, CGNX, EVRG, PENN, LNT, HWM, PWR, TPR, CNP, FNF, OTEX, BILL, PLUG, TPL, AVLR, FND, AMH, IRM, BKI, VER, CABO, REG, DBX, OLED, KL, BLDR, PCTY, COLD, MIDD, NCLH, STOR, AQN, AXON, NTRA, NLSN, HII, APPN, BYND, FLIR, ANGI, PLNT, TRIP, FVRR, TDC, AL, NOMD, SYNA, QDEL, FTDR, SHAK, RPD, AMC, FROG, HAIN, KTB, STMP, WD, HL, SFM, YELP, CARG, TDS, MUR, AXNX, SVMK, SBH, FLGT, IRTC, EB, GPRO, GRPN, ACMR, LASR, FNKO
Economic Report
April ADP employment report: 742,000 (actual) vs. 785,000 (estimate)
April PMI composite: 63.5 (actual) vs. 62.2 (estimate)
April ISM services index: 62.7 (actual) vs. 64.2 (estimate)
Happy trading!
Tom