
EB Daily Market Report - Friday, May 7, 2021
ChartLists Updated
The Strong Earnings ChartList (SECL) and Strong Future Earnings ChartList (SFECL) have been updated on our site to include earnings reports through Friday, April 30th. I'm currently evaluating the earnings from this past week and another updated SECL (and SFECL) will be provided - likely early next week.
Executive Market Summary
- Futures were mixed overnight, with strength favoring the NASDAQ as we opened this morning
- April nonfarm payrolls were much weaker than expected and March's payrolls were revised lower as well; the 10-year treasury yield ($TNX) initially fell to 1.47%, but has recovered all losses, now residing at 1.58%
- The NASDAQ was unable to retain its relative strength, though all of our major indices are higher
- The U.S. dollar (UUP, -0.65%) remains under pressure, enabling energy (XLE, +1.54%) to move to the top spot on the sector leaderboard
- Real estate (XLRE, +1.05%) and industrials (XLI, +1.04%) are also having a strong session
- 10 of our 11 sector are higher, with consumer staples (XLP, -0.07%) the only sector losing ground
- The weak dollar is also helping commodities as gold ($GOLD) rises nearly 1%, while copper ($COPPER, +2.91%) breaks out to its highest level ever
- Nonferrous metals ($DJUSNF, +4.30%) is today's strongest industry group, benefiting from the copper breakout
Market Outlook
Copper is the one metal that correlates positively with global economic conditions. So it's difficult to construe today's breakout to an all-time high as anything other than a HUGE bullish statement for global equities. Here's a long-term chart that also illustrates how closely correlated it is to the S&P 500 performance:
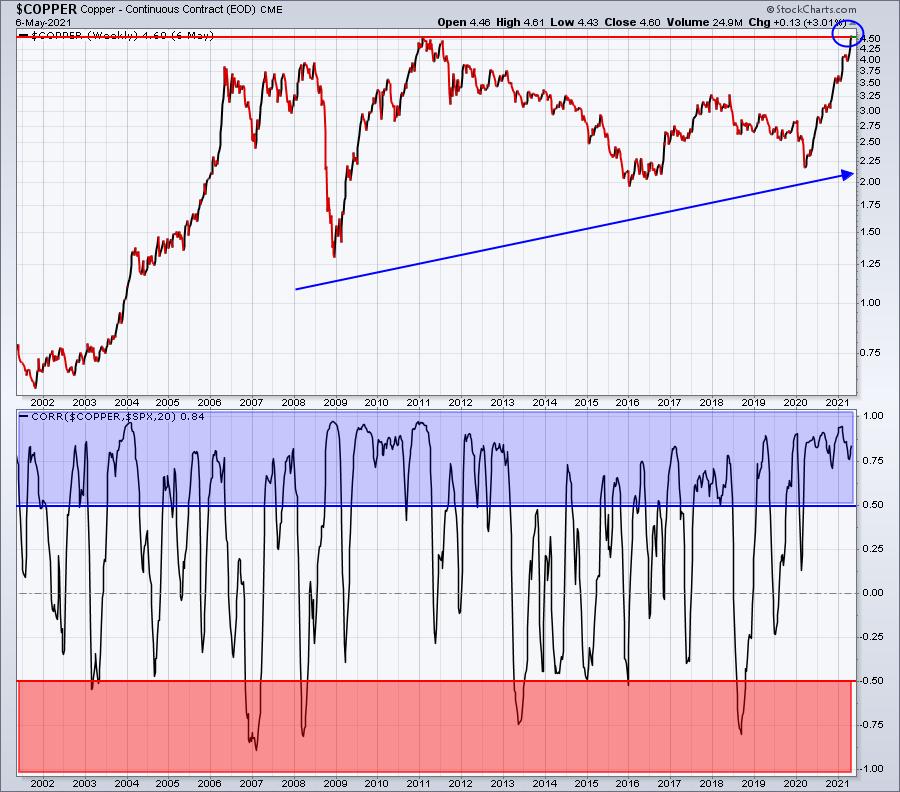
It's certainly not perfect correlation, but the blue-shaded area highlights the extreme positive correlation (above 0.50), while the red-shaded area highlights the extreme negative correlation (below -0.50). I think from this chart, it's fairly easy to see that as copper goes, so too goes equity markets.
Sector/Industry Focus
Energy (XLE) remains very strong today and is now challenging the high established on March 11th. Here's an XLE chart, updated from the version presented in the DMR about 10 days ago:
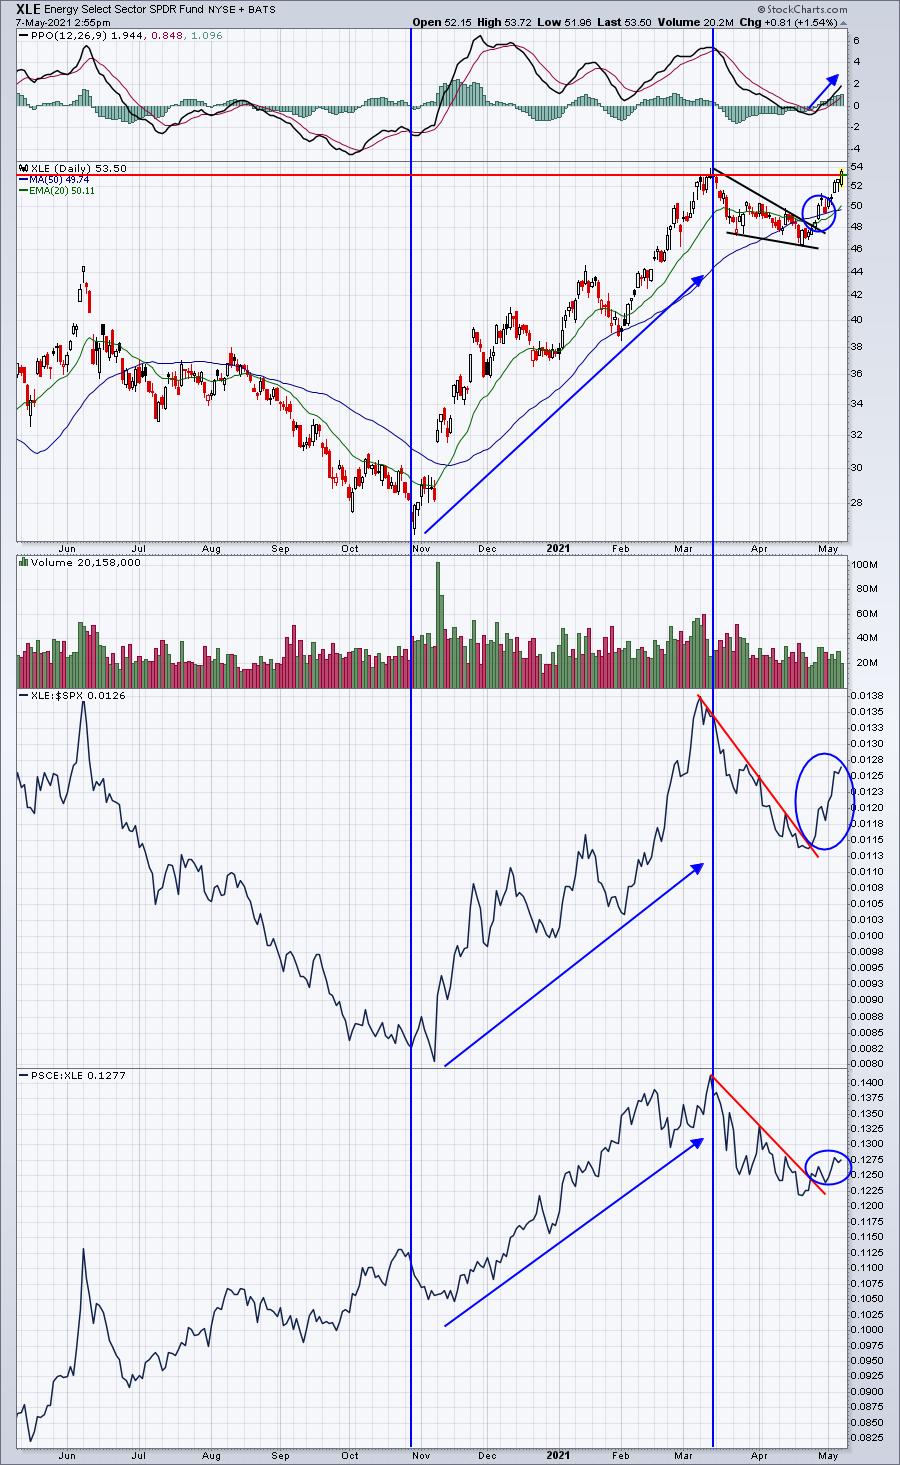
Since bullishly breaking out of that bullish wedge, the XLE has shown tremendous leadership and it's continuing. The dollar's weakness is certainly helping. My favorite indicator with respect to the U. S. Dollar Index is the relationship between U.S. treasury yields and German treasury yields. That signal is still pointing to a strengthening dollar later in 2021. So I believe it's fine to trade energy (and materials) on the long side for now. Just be prepared to exit when the yield signal dictates.
ChartLists/Strategies
Here are two charts that have set up quite bullishly:
EVTC:
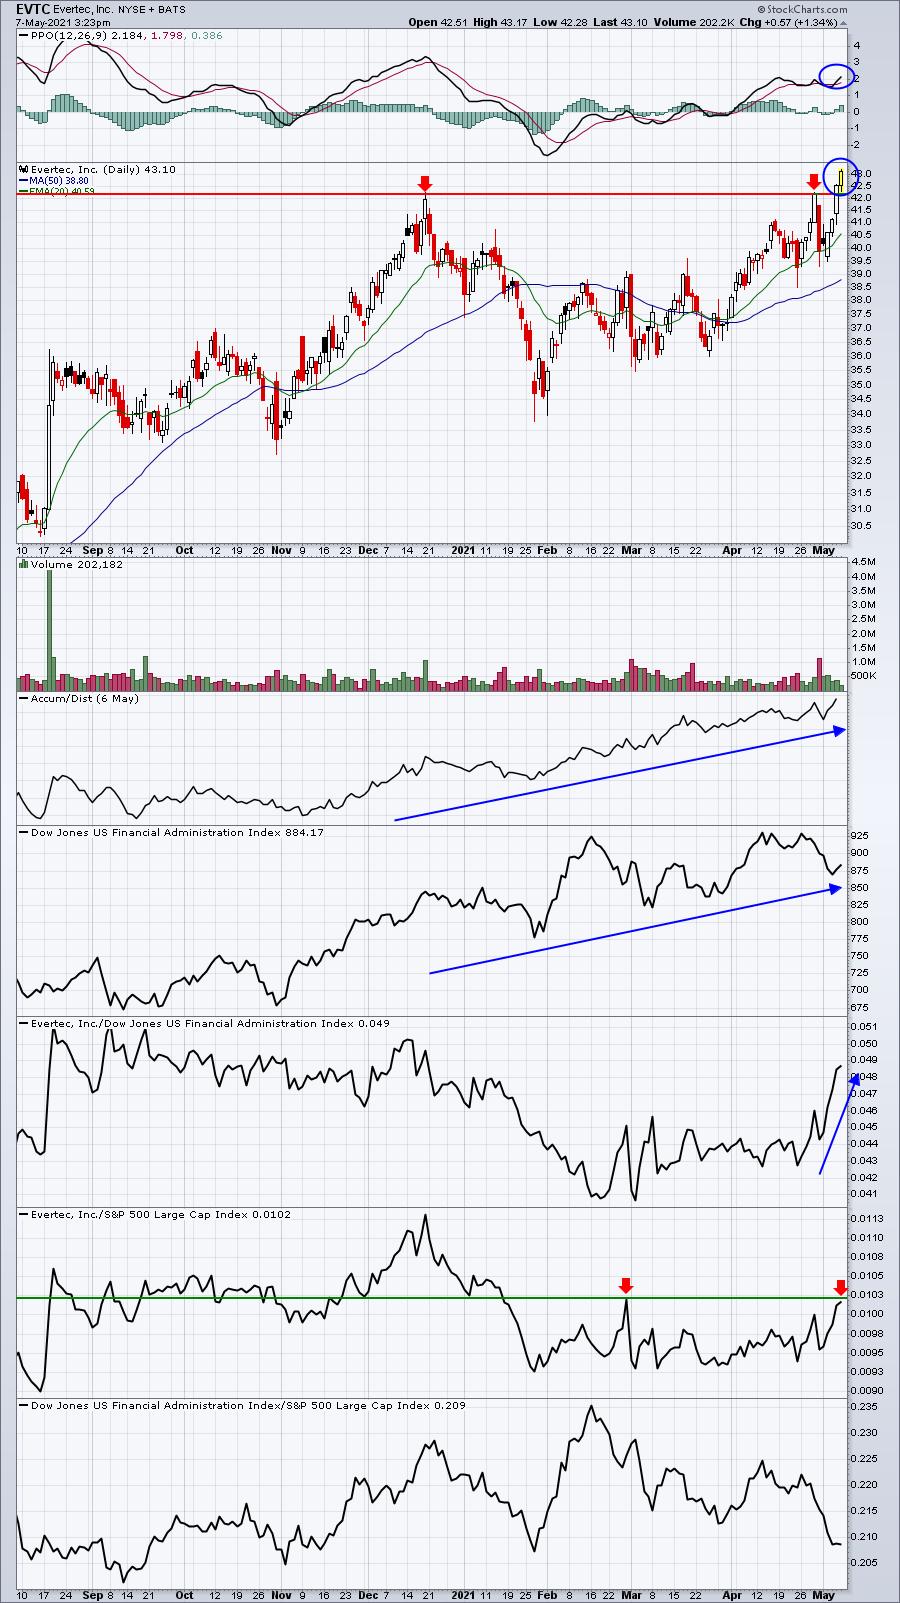
There are two negatives. First, EVTC has not broken out vs. the S&P 500 just yet. Second, its industry group - financial administration ($DJUSFA) is downtrending vs. the S&P 500, so rotation has been AWAY from this group. Yet, despite this bearish rotation, EVTC has managed to break out to a fresh new high. I'd expect excellent performance if money actually returns to the industry.
KSS:
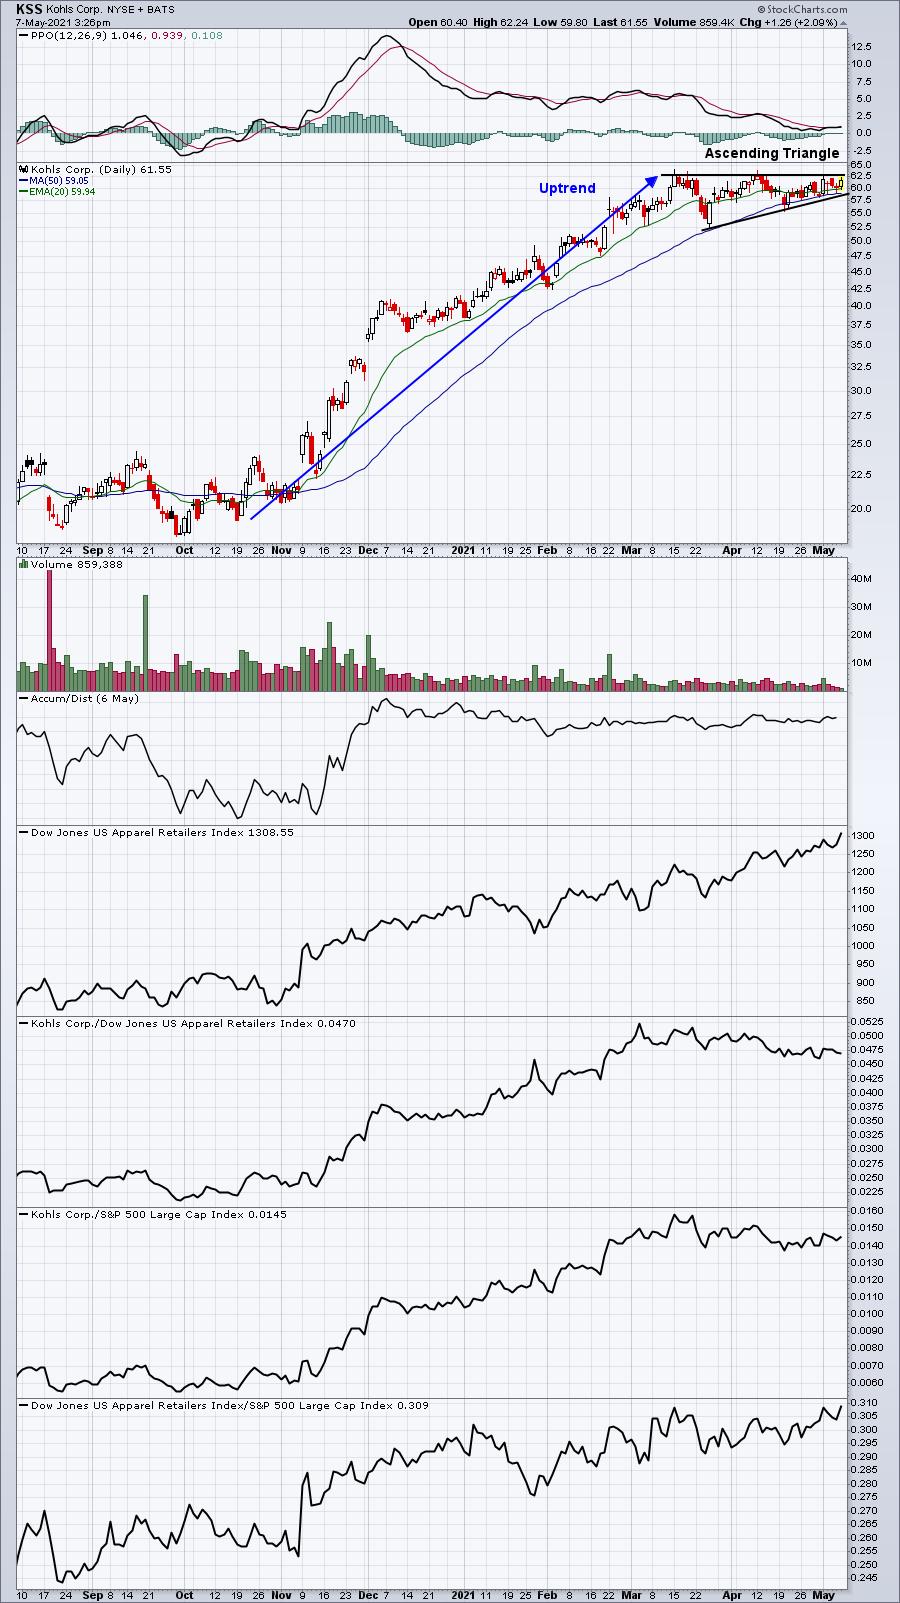
The bullish ascending triangle pattern has served a very useful purpose as it's allowed KSS the time necessary to see its PPO return close to centerline support for a reset. Therefore, an upcoming breakout should be viewed quite bullishly as PPO would be poised to accelerate. Unlike EVTC, KSS is part of a very strong apparel retail ($DJUSRA) group.
Earnings Reports
Here are the key earnings reports for the next two days, featuring stocks with market caps of more than $10 billion. I also include a few select companies with market caps below $10 billion. Finally, any portfolio stocks that will be reporting results are highlighted in BOLD. If you decide to hold a stock into earnings, please understand the significant short-term risk that you are taking. Please be sure to check for earnings dates for any companies you own or are considering owning.
Friday, May 7:
CI, ENB, TRP, TU, DKNG, VTR, CVE, ELAN, ATH, LEA, ITT, CCJ, NKLA, SPB, FLR, CRON, MD, AVNS, AMCX, GVA, ROAD, AXL
Monday, May 10:
DUK, APD, MAR, BNTX, SPG, IFF, RBLX, TTD, ES, TSN, OXY, AEE, J, VTRS, NUAN, AFRM, OSH, ZLAB, NVAX, TREX, NLOK, WB, ACM, G, USFD, VOYA, COTY, RBA, BRKS, CHH, TGTX, JCOM, SGMS, RXT, SPCE, EVBG, SAIL, TGNA, SWCH, MGNI, CRNC, ENR, EGHT, SDC, VCYT, ELY, DDD, WKHS, VUZI, MX
Economic Report
April nonfarm payrolls: 266,000 (actual) vs. 998,000 (estimate)
April private payrolls: 218,000 (actual) vs. 893,000 (estimate)
April unemployment: 6.1% (actual) vs. 5.8% (estimate)
April average hourly earnings: +0.7% (actual) vs. +0.0% (estimate)
Happy trading!
Tom