
EB Daily Market Report - Thursday, May 13, 2021
ChartList Update
The Raised Guidance ChartList (RGCL) has been updated on the website and is now available for you to view/download.
Also, just a quick reminder that our Webinar Special from Monday night ends today. If you're interested in extending your membership, today would be a great day to do so. You can CLICK HERE for our 13 months for 12 1-year special. It saves you roughly 48% from the monthly subscription.
Executive Market Summary
- Futures were strong, despite another inflationary report this morning
- All of our major indices are higher today, but the NASDAQ is notably weaker again on a relative basis
- The April PPI came in hotter than expected, doubling the consensus estimate of +0.3%
- As the day has progressed, value stocks (IWD) have outperformed growth stocks (IWF)
- Software ($DJUSSW, +0.76%), after a much stronger earlier start, has been fading much of the day; same goes for semiconductors ($DJUSSC, +0.82%)
- The 10-year treasury yield ($TNX) has fallen more than 2 basis points to 1.67% as the consolidation in the TNX between 1.50% and 1.75% continues
- Utilities (XLU, +1.91%), a defensive sector, is today's top performing sector; industrials (XLI, +1.64%) and financials (XLF, 1.61%) are also performing very well
- Cryptos are very weak today, with bitcoin and etherium down 10.3% and 8.8%, respectively
Market Outlook
Well, we've now seen two very high inflation readings the past two days and growth stocks have been under pressure as we should expect. They haven't buckled yet though, hanging on to key relative support near 1.55 on the IWF:IWD ratio. The following chart shows two things that I'm watching very closely. First, because of the daily negative divergences on both the Dow Jones and S&P 500, be VERY careful until we can climb back above their respective 20-day EMAs on a closing basis. I'd feel better with two closes in a row above as the red circles below highlight a few failures where we've seen just one close above that moving average. Next, watch that 1.55 relative support level on the IWF:IWD. Here's a visual of what I'm referring to:
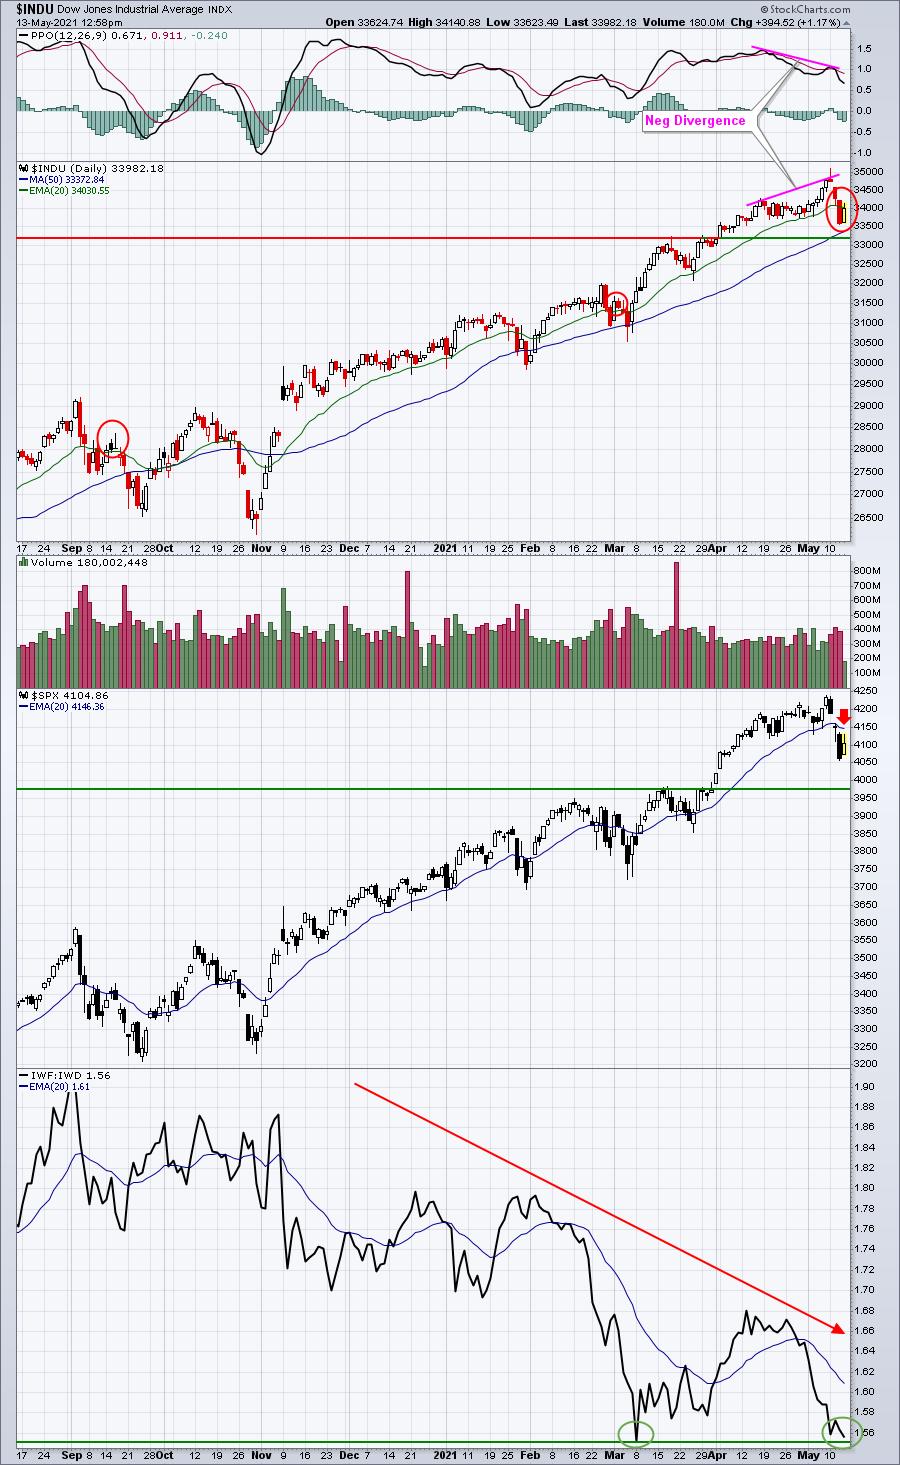
I believe the most likely scenario here is a failure at the 20-day EMA with a minimum upcoming drop to test the rising 50-day SMA. I've also annotated a recent breakout (horizontal line) where we could see prices gravitate back to for a retest.
Sector/Industry Focus
One notable potential breakout among industry groups is pharmaceuticals ($DJUSPR, +1.03%). We've been consolidating in a cup with handle pattern, and the current price would represent a breakout on a closing basis. Here's a look at the chart:
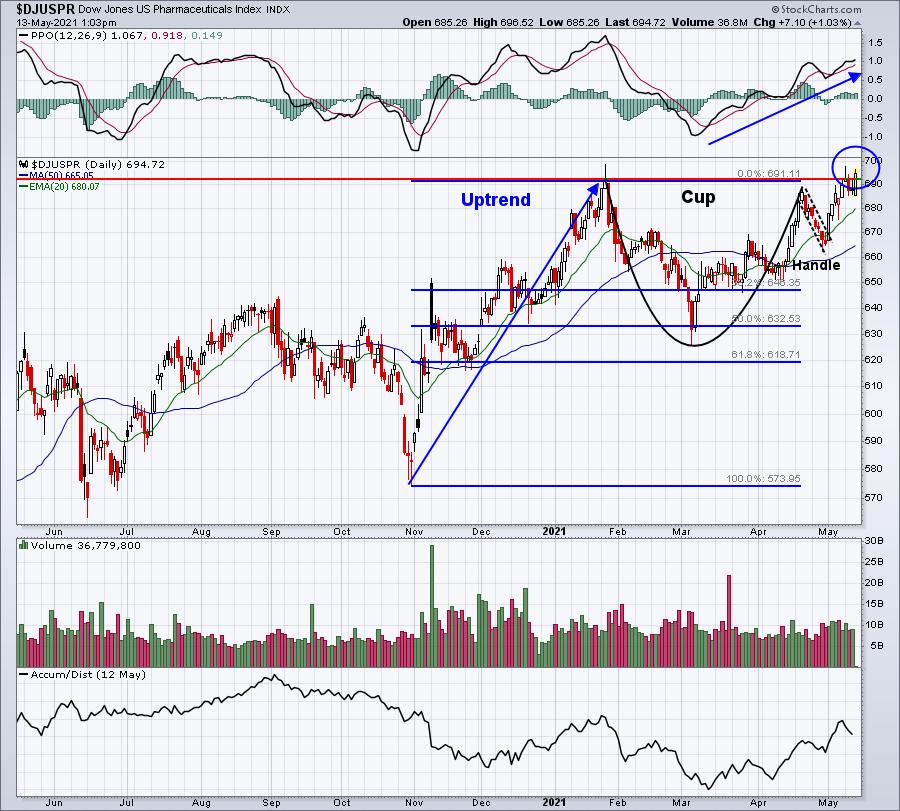
Further strength into the close is what we'd like to see from a bullish perspective. A weak finish could suggest further sideways action ahead before a later breakout.
ChartLists/Strategies
Right now, until I get further signs of a strengthening market, I'd be content trading only stocks that are more defensive. They won't likely make big moves, but that's the point. Think about capital preservation with the VIX back above 20. In the pharmaceutical space, given its possible breakout, here are two stocks near support worth considering:
MRNA:
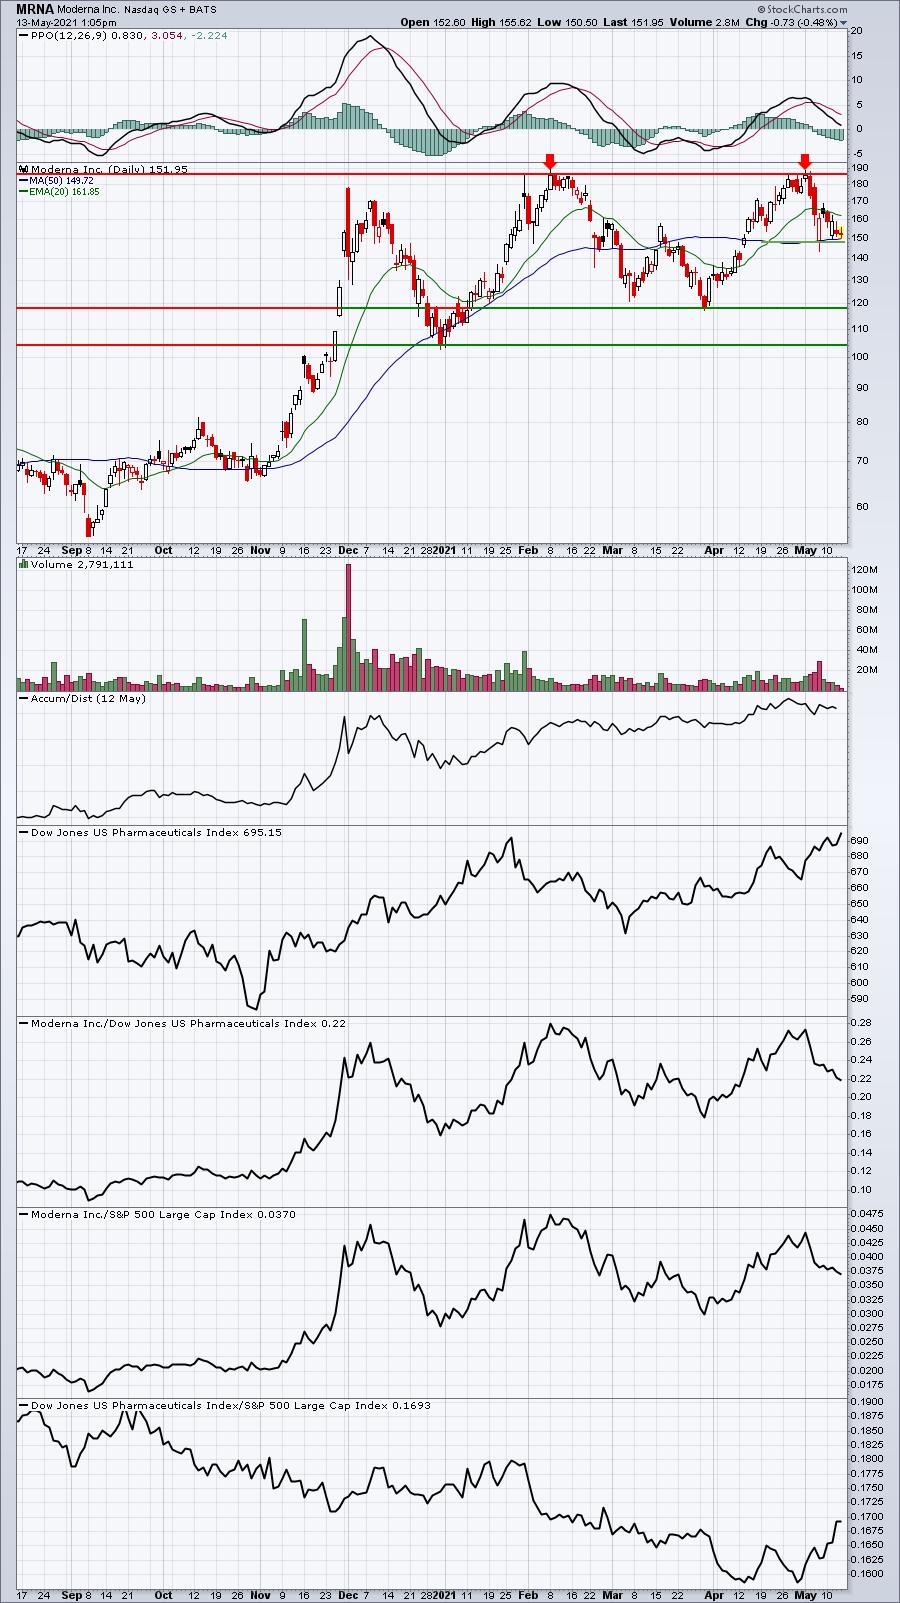
MRNA's AD line remains strong and it's pulled back to test both its recent price low AND its 50-day SMA. I'd keep a fairly tight stop here, but do keep in mind that MRNA is a volatile stock so you need to be aware of possible gaps in both directions. The two red arrows mark a double top. That only becomes bearish if the price low between the two tops is lost as support.
MCK:
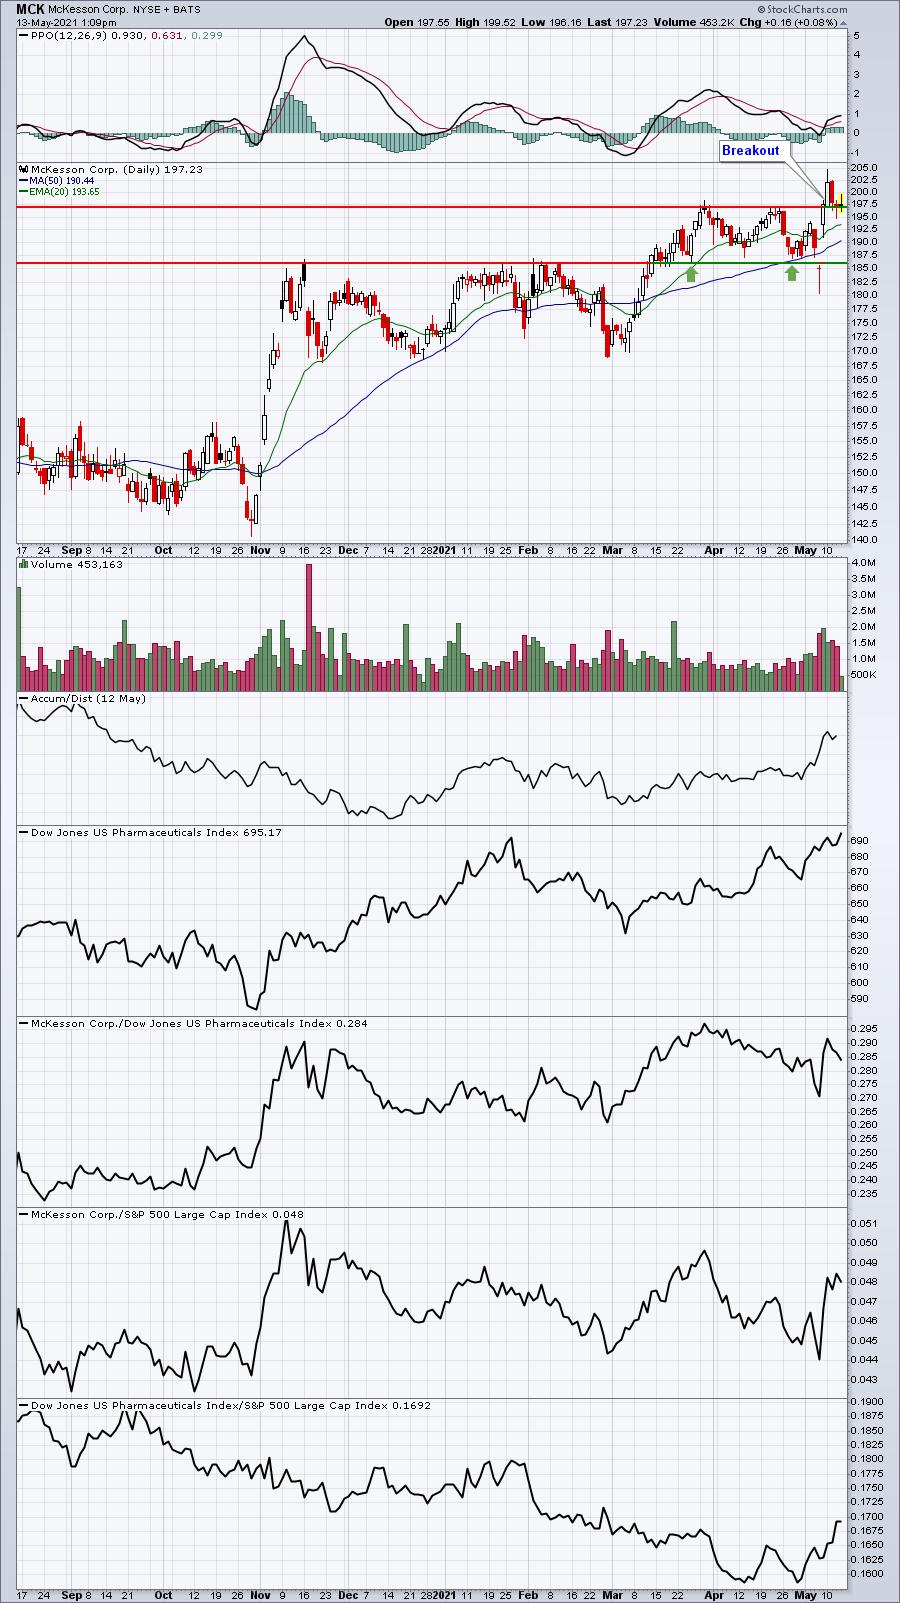
MCK was featured 10 days ago here in the DMR. It closed one day just beneath key support, then rallied back strongly to break out. It's pulled back to test its breakout level and could be a solid reward to risk candidate in the pharma area. Building a position down to the rising 20-day EMA with a tight closing stop beneath that moving average would be one way to trade it.
Earnings Reports
Here are the key earnings reports for the next two days, featuring stocks with market caps of more than $10 billion. I also include a few select companies with market caps below $10 billion. Finally, any portfolio stocks that will be reporting results are highlighted in BOLD. If you decide to hold a stock into earnings, please understand the significant short-term risk that you are taking. Please be sure to check for earnings dates for any companies you own or are considering owning.
Thursday, May 13:
BABA, DIS, ABNB, BAM, DASH, BILI, FTCH, NICE, GDRX, GLOB, YETI, LAZR, GOOS, EYE, UTZ, NEWR, CELH, HAE, PLT, ACB, BLNK
Friday, May 14:
ARGX, SOHU
Economic Reports
Initial jobless claims: 473,000 (actual) vs. 475,000 (estimate)
April PPI: +0.6% (actual) vs. +0.3% (estimate)
April Core PPI: +0.7% (actual) vs. +0.4% (estimate)
Happy trading!
Tom