
EB Daily Market Report - Friday, May 14, 2021
ChartList Update
The May Seasonality Report was issued earlier in the day and there's a May Seasonality ChartList (SEASCL) that is available to be viewed/downloaded from our website.
Executive Market Summary
- Futures were strong across-the-board overnight and it's carried throughout the trading day
- The NASDAQ is showing leadership, which is encouraging, and the Volatility Index ($VIX) is back below 20 - also an encouraging sign
- The Dow Jones and S&P 500 have both moved back above their 20-day EMA; continuing to do so next week would provide a bullish signal as well
- Gold ($GOLD) is threatening another breakout to a 3-month high, gaining just over 1% on today's session
- Crude oil ($WTIC) has jumped nearly 2.5% to $65.41 per barrel
- Energy (XLE, +3.03%) and technology (XLK, +2.25%) are today's best performing sectors
- All 11 sectors are higher, but consumer staples (XLP, +0.51%) is the laggard
- Cruise lines, part of the recreational services group ($DJUSRQ, +6.19%), are showing excellent strength and are littering the S&P 500 leaderboard
Market Outlook
Today marks the midpoint of our current calendar quarter. We're having a solid day to end the quarter and, as I've pointed out several times recently here in the DMR and in my blogs and on my shows, we're moving into a much more defensive period. At last check the April 1-May 15 period is +5.21%. Outside of 2020, coming out of the pandemic low, the last time we've performed this well from April 1 to May 15 was 2013, when the S&P 500 gained 5.71%. It proceeded to lose 3.16% from May 15 to June 30 that year.
The NASDAQ 100 ($NDX) has also seen similar patterns in the past between the first half of a calendar quarter and the second half. Here are the numbers on the NDX since 1971:
- April 1 - May 15: +15.70%
- May 16 - June 30: +8.70%
The second half of the current calendar quarter isn't as bad on the NDX, but it produces just slightly above half of what we see during the first half of the quarter.
Sector/Industry Focus
Internet stocks ($DJUSNS) have been one bright spot within the growth stock area. Currently, a several-month-long uptrend remains in play, though I've circled below in red a key inflection point on the chart:
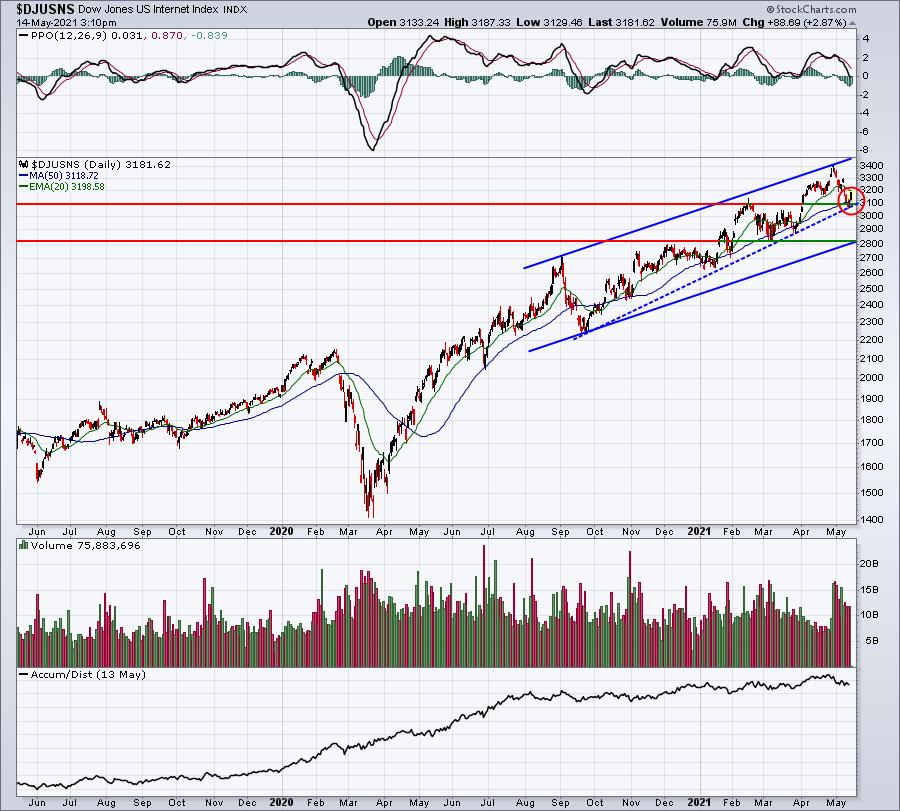
If we fail to hold the latest price low and we break that uptrend, I believe there'd be a reasonable chance the group could fall back to perhaps 2850-2900. I'm okay with trading the group (and strong relative performers within), but I'd definitely keep a close eye on this key support.
ChartLists/Strategies
I looked at Strong Earnings ChartList (SECL) stocks that are trading more than 200% of their normal volume to see if any key technical developments were taking place - breakouts, reversals, etc. Here are two stocks I wanted to share:
BHR:
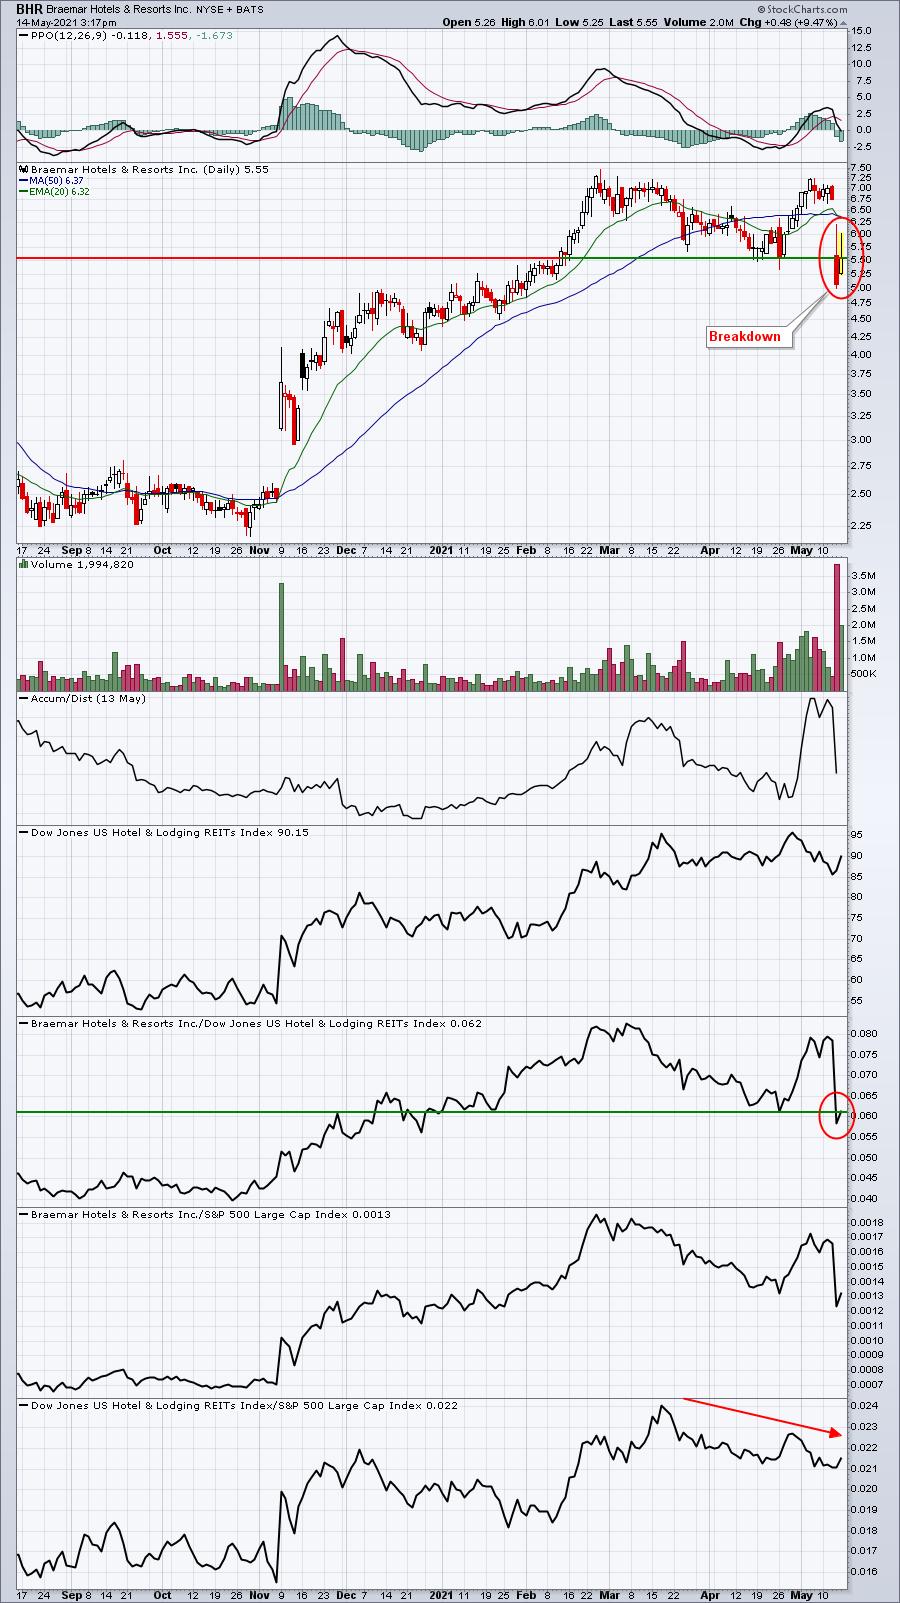
A heavy volume breakdown followed by a failed attempt to recapture support is not usually a very good combination. Also, BHR is part of a weakening hotel & lodging REIT industry group ($DJUSHL). I'd simply watch from the sidelines, but I'd expect lower prices here unless we can clear 5.54 on a closing basis - for starters.
MPC:
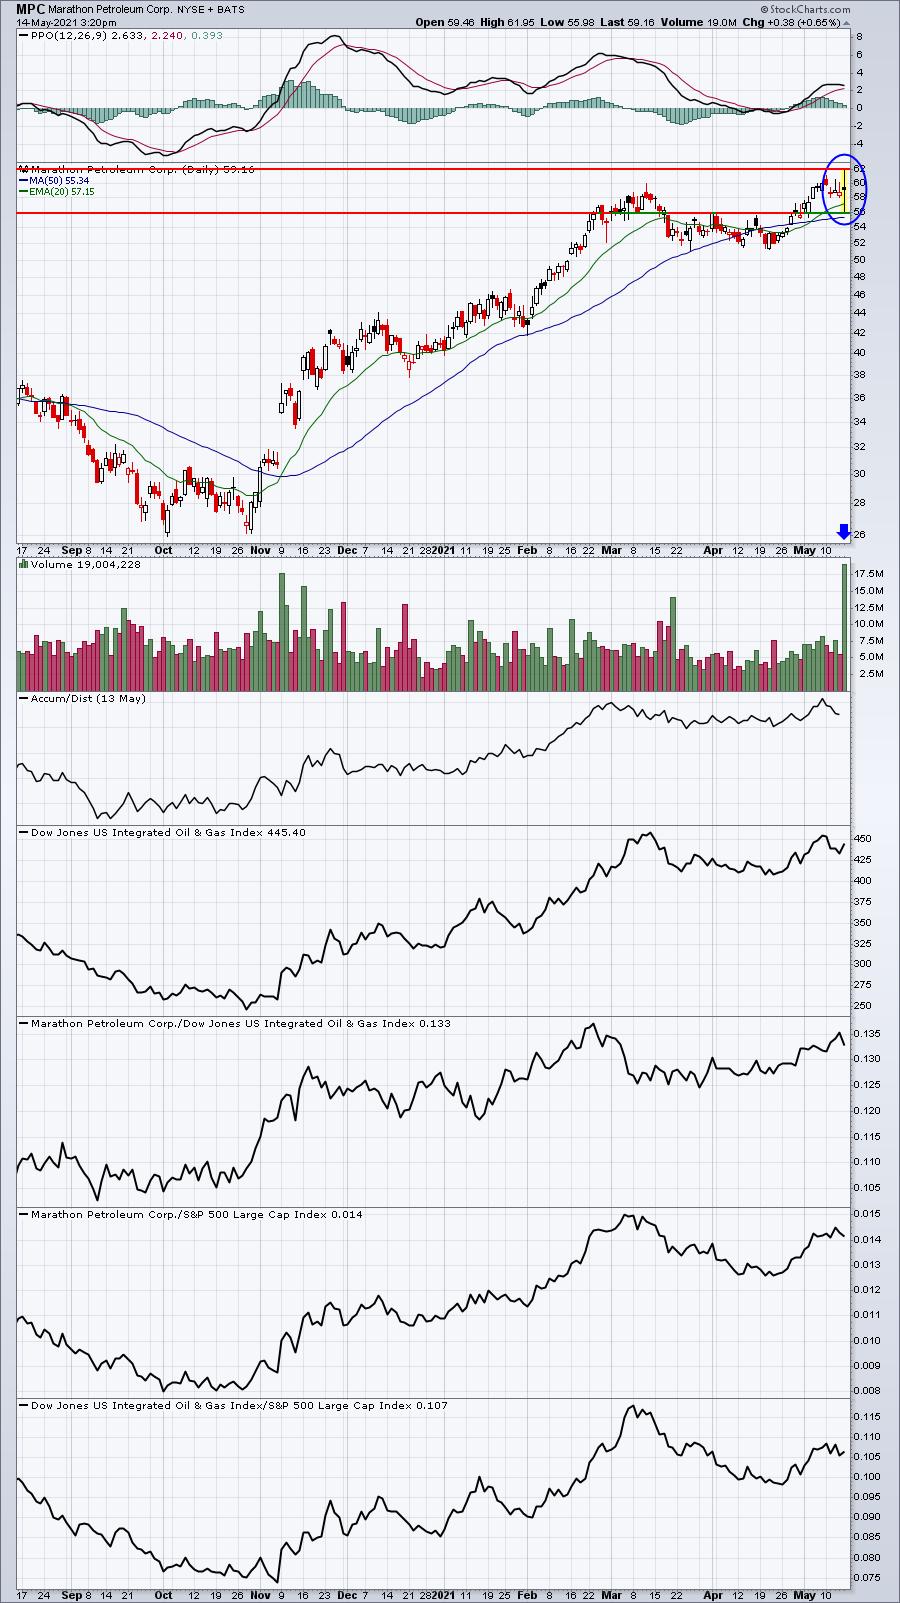
Today's candlestick is what's referred to as a "long-legged doji". A doji is a candle where the opening price is equal or nearly equal to the closing price. So things could change in the final half hour, but right now we have a long-legged doji on massive volume. MPC was humming along and potentially breaking out earlier today, but then announced they plan a $10 billion buyback after they completed the sale of its Speedway fuel retail chain. Traders were not impressed and MPC sold off violently before settling down and rebounding. Typically, a long-legged doji provides intraday tails (a high and a low) that are very important. There's indecision today, but the subsequent breakout above or breakdown below today's high and low, respectively, will likely dictate the more intermediate-term direction.
Earnings Reports
Here are the key earnings reports for the next two days, featuring stocks with market caps of more than $10 billion. I also include a few select companies with market caps below $10 billion. Finally, any portfolio stocks that will be reporting results are highlighted in BOLD. If you decide to hold a stock into earnings, please understand the significant short-term risk that you are taking. Please be sure to check for earnings dates for any companies you own or are considering owning.
Friday, May 14:
ARGX, SOHU
Monday, May 17:
TME, FSR, RIOT, PRPL, TWNK
Economic Reports
April retail sales: +0.0% (actual) vs. +1.0% (estimate)
April retail sales less autos: -0.8% (actual) vs. +0.8% (estimate)
April industrial production: +0.7% (actual) vs. +1.2% (estimate)
April capacity utilization: 74.9% (actual) vs. 75.2% (estimate)
March business inventories: +0.3% (actual) vs. +0.3% (estimate)
May consumer sentiment: 82.8 (actual) vs. 90.3 (estimate)
Happy trading!
Tom