
EB Daily Market Report - Monday, May 17, 2021
No DMR on Thursday/Friday
I will be out of the office later this week, so I will not be publishing a Daily Market Report on Thursday and Friday. I'll be back to a normal schedule on Monday.
ChartList Update
The Strong Earnings ChartLists (SECL) and Strong Future Earnings ChartList (SFECL) were updated over the weekend and are available for viewing/download on our website.
Executive Market Summary
- Futures were down overnight and our major indices have been weak throughout the day
- There continues to be a disdain for all things growth, as evidenced by the NASDAQ's poor showing again today, down more than 1%, while the S&P 500 drops roughly half that
- Cryptos are down to begin the week with bitcoin and ethereum down 4.65% and 5.18%, respectively
- Gold ($GOLD) has spiked another $30 per ounce to $1,868 - detailed analysis below
- Crude oil ($WTIC) is also higher by 1.36% to above $66 per barrel
- Energy (XLE, +1.51%) and materials (XLB, +0.82%) are easily the best performing sectors today; technology (XLK, -1.33%) trails the field
- Western Digital (WDC, +5.02%) is the top performing S&P 500 stock today, and is breaking out above key price resistance in the 73.00-74.00 area
Market Outlook
Gold ($GOLD) typically performs best in a highly volatile (fearful) market and/or when the U.S. dollar ($USD) weakens. Well, with the Volatility Index ($VIX) rising back above 20 today and the USD near its January low, the environment is ripe for gold and traders are currently taking advantage. I'm not a long-term fan of gold as it tends to struggle on a relative basis to the S&P 500 during secular bull markets. Here's a daily chart and what I'd look for with gold:
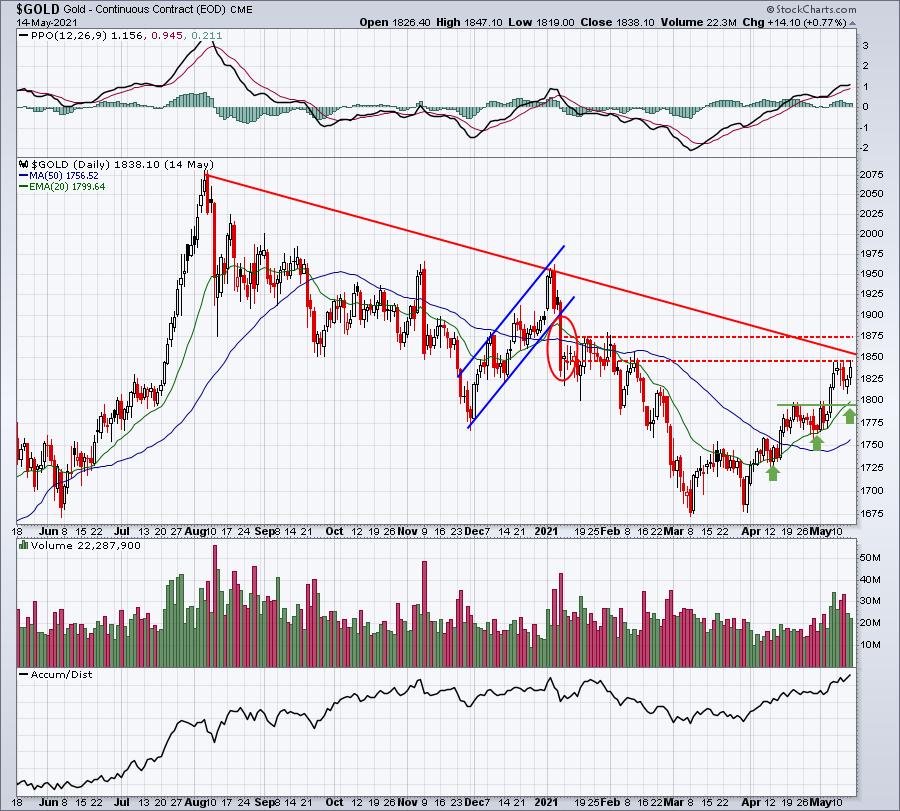
I see a range on gold from approximately 1795-1875. I'll be interested to see which area breaks first. My educated guess is that gold does NOT break above 1875. Instead, I still believe we'll see the dollar rally and gold fall back similar to the first quarter when the dollar last showed strength.
Sector/Industry Focus
Clothing & accessories ($DJUSCF) is an industry group within consumer discretionary that I expect to benefit from the economy re-opening. We saw a huge relative surge in this group back in November, but little since then. We have held key relative support, however, and I wouldn't be surprised to see the group regain relative strength based upon this chart:
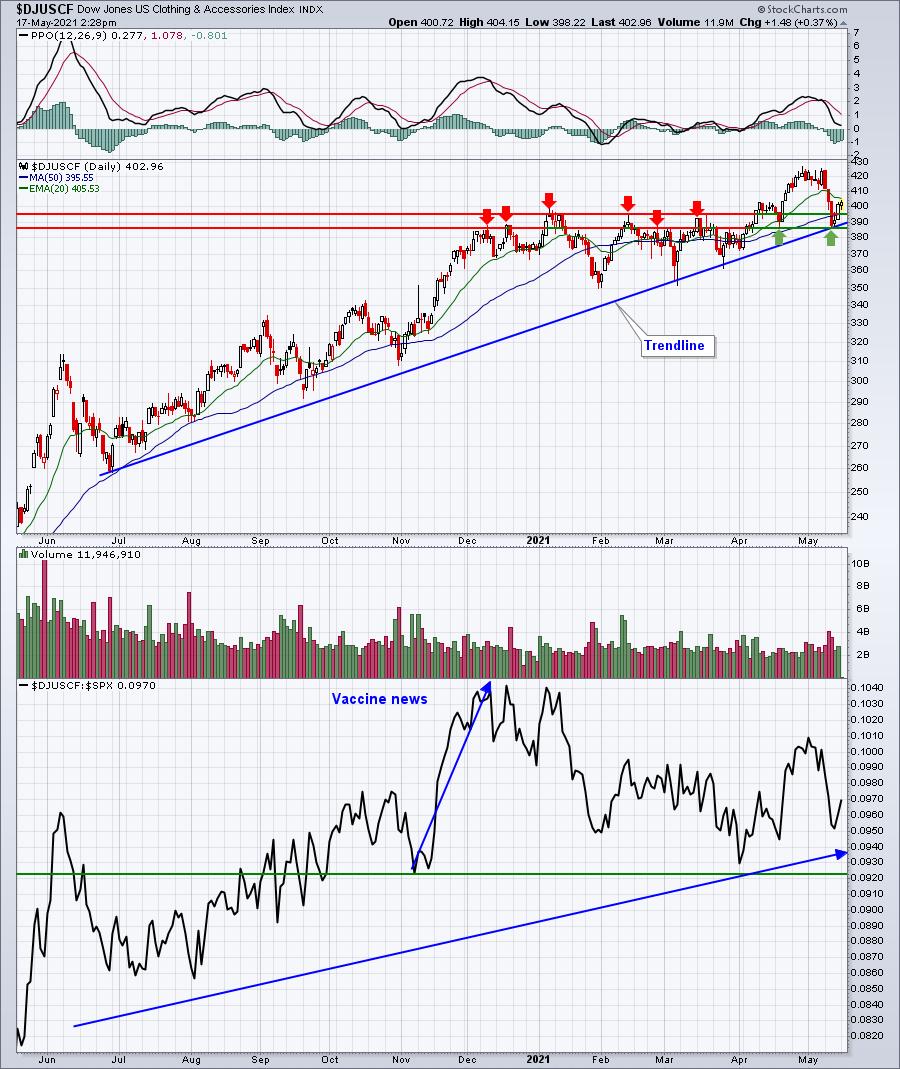
If the DJUSCF falls back below key price support in the 385-395 area, then yes we'll definitely want to re-evaluate. Until then, however, watch the absolute and relative trends. If they continue rising, then stick with this group for potential trading opportunities.
ChartLists/Strategies
I reviewed clothing & accessories stocks on our Strong Earnings ChartList for possible high reward to risk trades. Here's what caught my eye:
TPR:
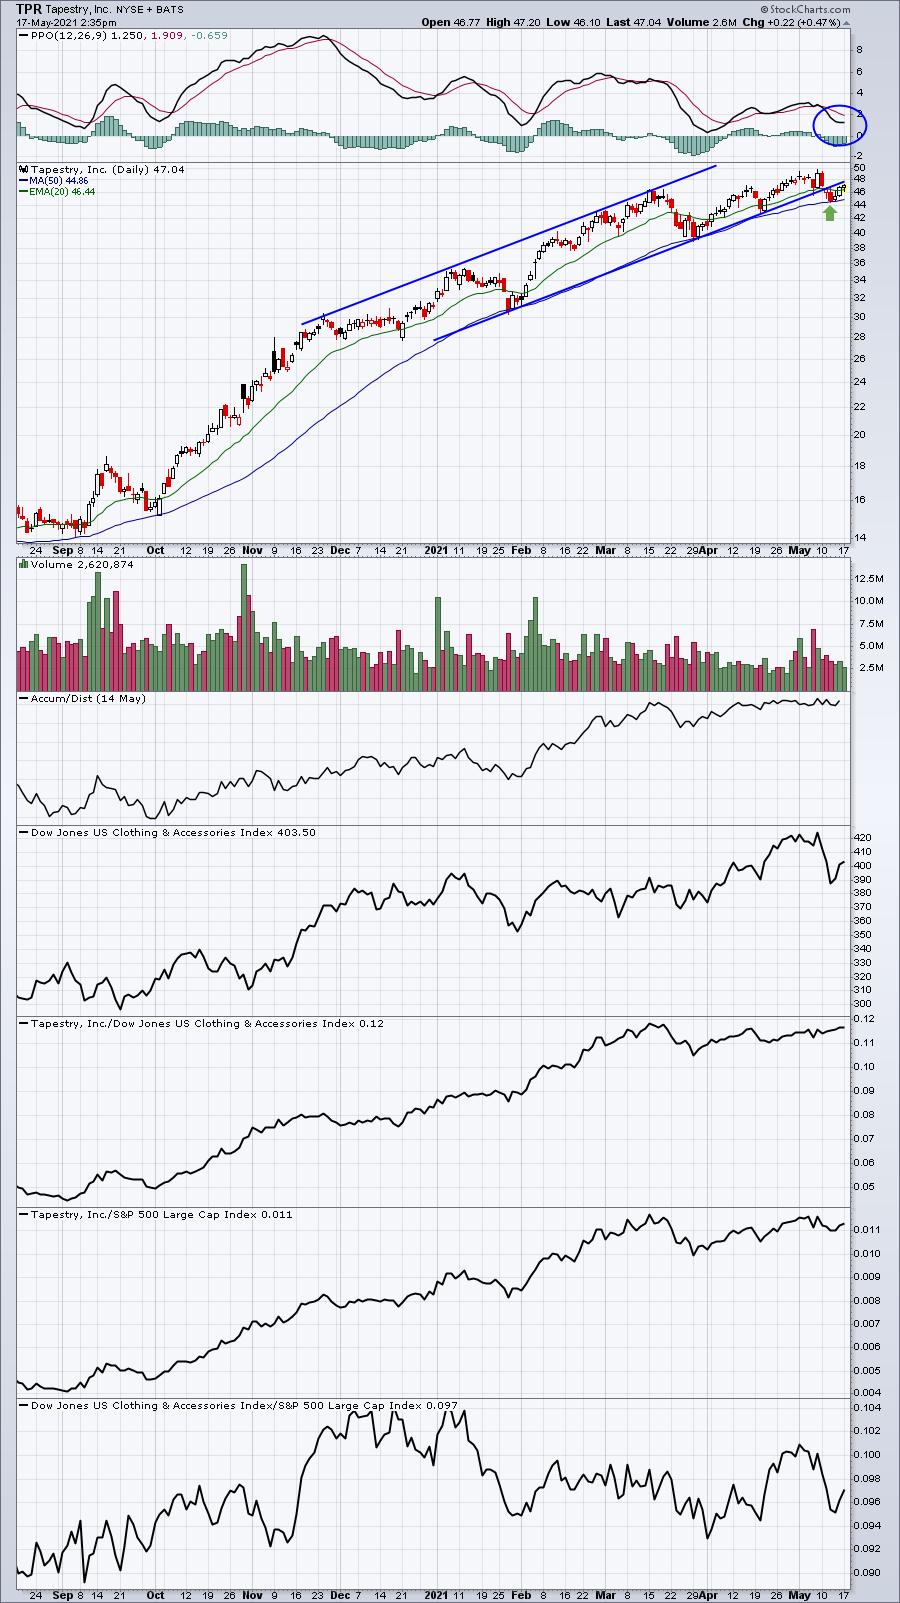
The channel broke, but the stock still trades above its 50-day SMA and its PPO remains above zero. So I could offer up a pass on the recent weakness, but ONLY if it holds above its closing support at 44.74.
KTB:
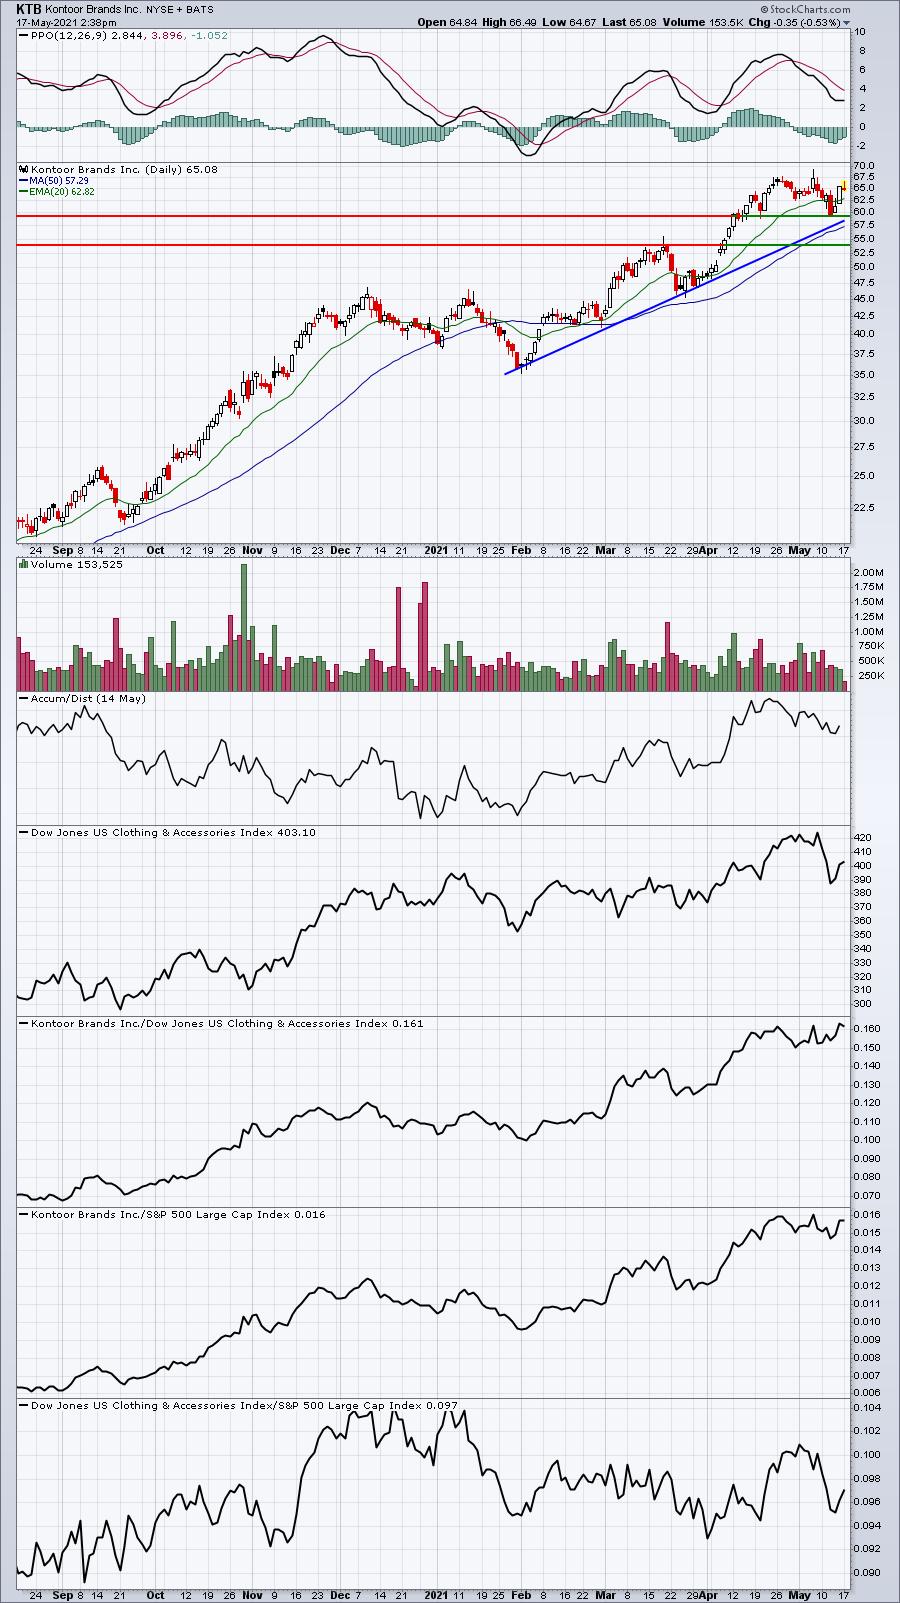
On KTB, the key closing price low is 59.72. A break below there would likely lead to a test of the next support level closer to 54. The PPO was very overbought at 8 and the failed breakout two weeks later was a short-term warning. The selling is likely providing an opportunity, but it may have a bit further to go. Watch the two support levels provided.
Earnings Reports
Here are the key earnings reports for the next two days, featuring stocks with market caps of more than $10 billion. I also include a few select companies with market caps below $10 billion. Finally, any portfolio stocks that will be reporting results are highlighted in BOLD. If you decide to hold a stock into earnings, please understand the significant short-term risk that you are taking. Please be sure to check for earnings dates for any companies you own or are considering owning.
Monday, May 17:
TME, FSR, RIOT, PRPL, TWNK
Tuesday, May 18:
WMT, HD, SE, NTES, BIDU, TCOM, TTWO, STE, IQ, KC, M, DQ, DOYU
Economic Reports
May empire state manufacturing index: 24.3 (actual) vs. 25.0 (estimate)
May housing market index: 83 (actual) vs. 83 (estimate)
Happy trading!
Tom