
EB Daily Market Report - Tuesday, May 25, 2021
Executive Market Summary
- Futures were up overnight once again and we gapped higher to start the day
- While yesterday saw relative weakness in small and mid caps, today is the opposite with those two asset classes showing relative strength
- Asian markets were up significantly overnight with China's Shanghai ($SSEC) up 2.40%
- The U.S. Dollar (UUP) pushes slightly lower, enabling commodities to forge a bit higher
- Despite the dollar weakness, energy (XLE, -1.23%) is the weakest sector and materials (XLB, -0.23%) are also in negative territory
- The five aggressive sectors are leading today's action, but all are just fractionally higher, led by industrials (XLI, +0.29%) and consumer discretionary (XLY, +0.28%)
- Airlines ($DJUSAR, +2.62%) and cruise lines are littering the S&P 500 leaderboard; Boeing (BA, +2.27%) leads the Dow Jones
Market Outlook
Rising crude oil prices ($WTIC) are typically synonymous with a rising stock market as international demand for crude oil is a sign of a strengthening global economy. So it should be taken as a bullish signal when the WTIC is at or near a 52-week high:
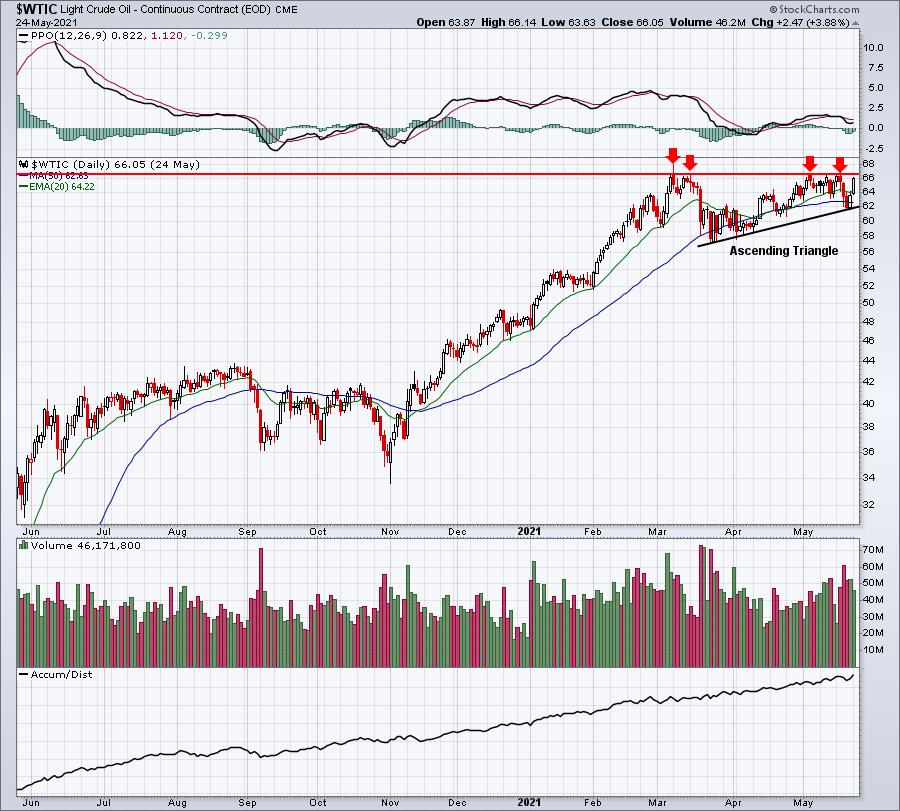
The bullish ascending triangle continuation pattern certainly doesn't hurt. A breakout in crude oil, while resulting in higher prices at the pump, would be yet another signal of our current secular bull market.
Sector/Industry Focus
Technology (XLK) has moved back above its 20-day EMA, a positive short-term signal for sure. Consumer discretionary (XLY), however, has failed to do so thus far:
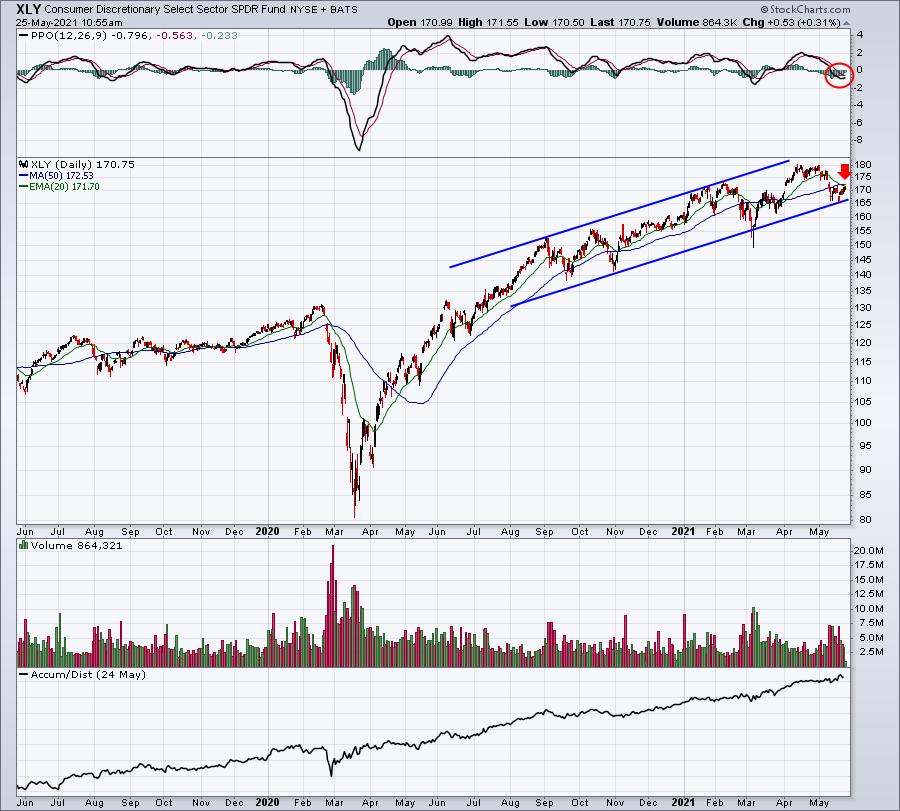
Drawing channels or trendlines can be quite subjective as everyone sees key highs and lows differently. Also, some will connect closing highs and lows, while others connect intraday highs and lows. So they can be a moving target, making them a bit less reliable than other technical indicators. Still, I view them as providing a visual foundation. The red arrow on the chart above highlights the 20-day EMA resistance that the XLY continues to face.
ChartLists/Strategies
Here are a couple of charts from our ChartLists that look interesting technically to me:
OPCH:
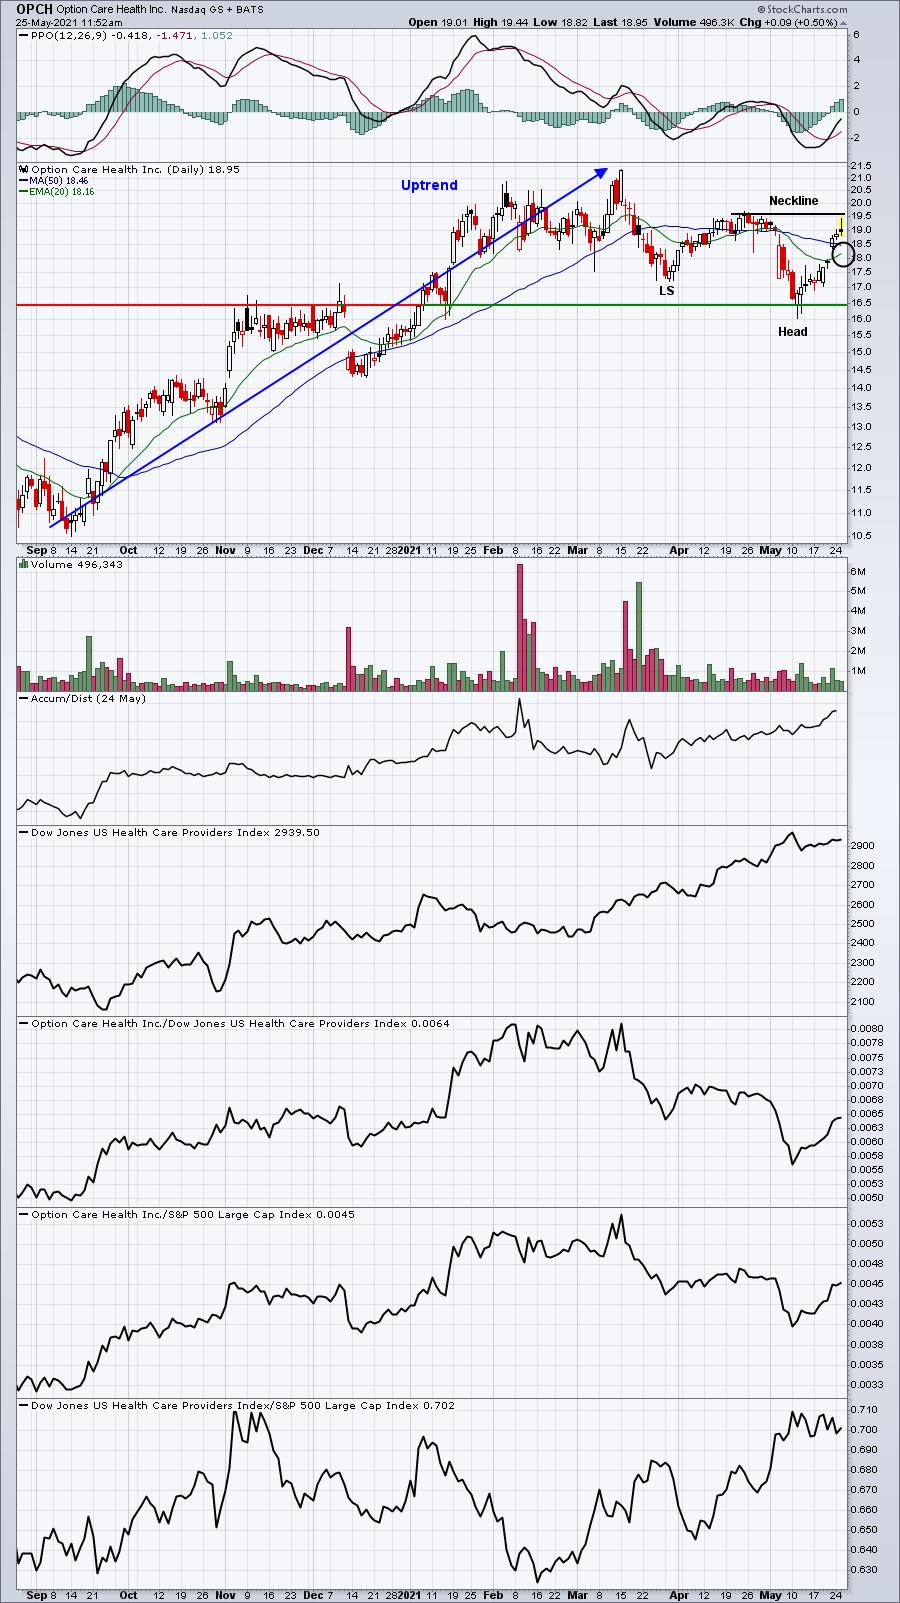
OPCH is approaching a key price resistance level where we could see a neckline form. If I owned a stock like this, I'd consider selling on any type of false breakout, realizing the potential pattern here.
CNQ:
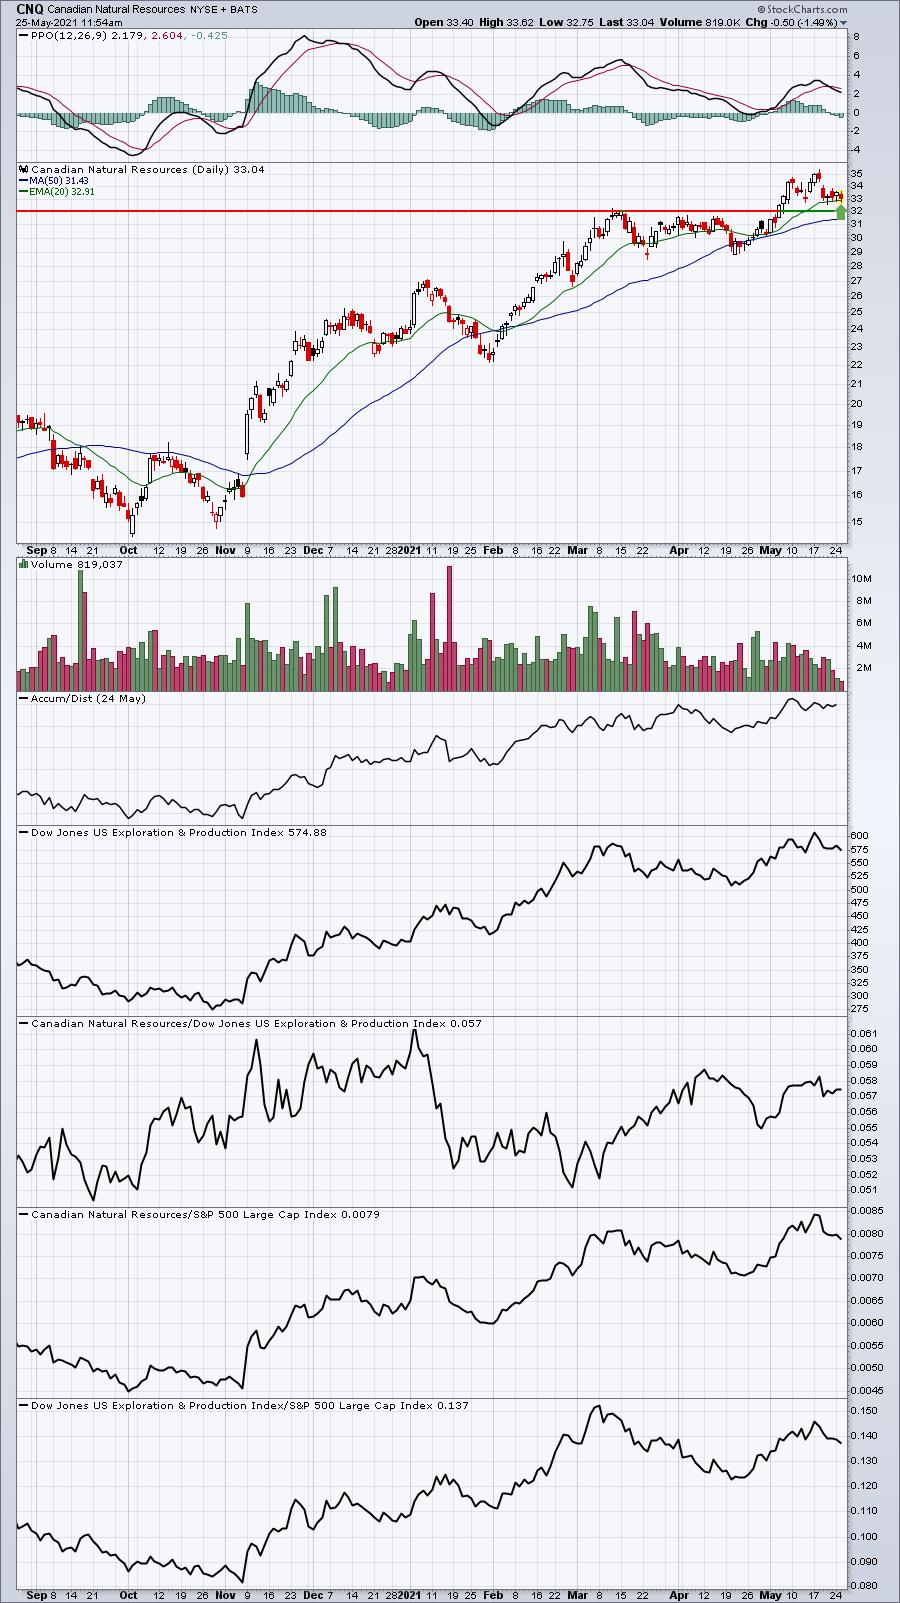
Energy has seen some weakness of late and buyers of CNQ could benefit. The rising 20-day EMA and price support closer to 32 are two levels worth considering in terms of entry. A tight stop could be maintained. The strong PPO suggests to me that holding this area of support is much more likely.
Earnings Reports
Here are the key earnings reports for the next two days, featuring stocks with market caps of more than $10 billion. I also include a few select companies with market caps below $10 billion. Finally, any portfolio stocks that will be reporting results are highlighted in BOLD. If you decide to hold a stock into earnings, please understand the significant short-term risk that you are taking. Please be sure to check for earnings dates for any companies you own or are considering owning.
Tuesday, May 25:
INTU, A, AZO, ZS, HTHT, HEI, TOL, JWN, URBN, VSAT, RAMP, VNET, CTRN, RRGB
Wednesday, May 26:
NVDA, PDD, SNOW, BMO, WDAY, OKTA, LI, AGL, WSM, UHAL, DXC, CPRI, DKS, NTNX, APPS, AEO, PSTG, ANF, ZUO, ELF, QADA, DBI, NXGN, PLAB
Economic Reports
March Case-Shiller home price index: +1.6% (actual) vs. +1.1% (estimate)
March FHFA house price index: +1.4% (actual) vs. +1.0% (estimate)
April new home sales: 863,000 (actual) vs. 955,000 (estimate)
May consumer confidence: 117.2 (actual) vs. 119.5 (estimate)
Happy trading!
Tom