
EB Daily Market Report - Tuesday, June 1, 2021
Annual Spring Special
We've just begun our annual Spring Special, which is our best annual deal of the year. There's not a better time to extend your current membership. At the current rate of $997 for 14 months (2 bonus months), your monthly cost is 52% below our regular published monthly rate. It won't get any better than this, so please hurry. Our special will end on Tuesday, June 15th. We appreciate your loyalty and support.
For more information, CLICK HERE.
ChartList Updates
Many ChartLists were updated over the weekend or earlier today, so I wanted to pass along a list of those:
- Strong Earnings ChartList (SECL)
- Strong Future Earnings ChartList (SFECL)
- Raised Guidance ChartList (RGCL)
- June Seasonality ChartList (SEASCL)
- Short Squeeze ChartList (SSCL)
- Upcoming Earnings ChartLists
Links and passwords are provided on our website. So you can download these ChartLists into your StockCharts.com account at your leisure. If you don't have a StockCharts.com account, Extra or Pro, you can still view the charts on our ChartLists one at a time.
Executive Market Summary
- Futures were higher overnight and our major indices opened June on a positive note
- However, selling has taken place since that opening bell with both the S&P 500 and NASDAQ turning negative at last check
- Small caps ($SML, +1.18%) are showing relative strength
- Energy (XLE, +3.26%) is soaring as crude oil prices ($WTIC) have jumped 2% to nearly $68 per barrel, their highest level in more than two years
- Materials (XLB, +1.09%) are also performing well, as the dollar retreats (UUP, -0.24%)
- Health care (XLV, -1.63%) is the primary laggard as medical equipment stocks ($DJUSAM, -2.70%) are under pressure
- Boeing (BA, +2.96%), Goldman Sachs (GS, +2.42%), and Chevron (CVX, +2.40%) are Dow Jones component stocks all higher by more than 2%
- The S&P 500 laggards are represented mostly by health care stocks like Abbott Labs (ABT, -8.35%) and Thermo Fisher (TMO, -4.79%)
Market Outlook
Crude oil prices ($WTIC) are breaking out of a bullish ascending triangle pattern that measures to $78 per barrel:
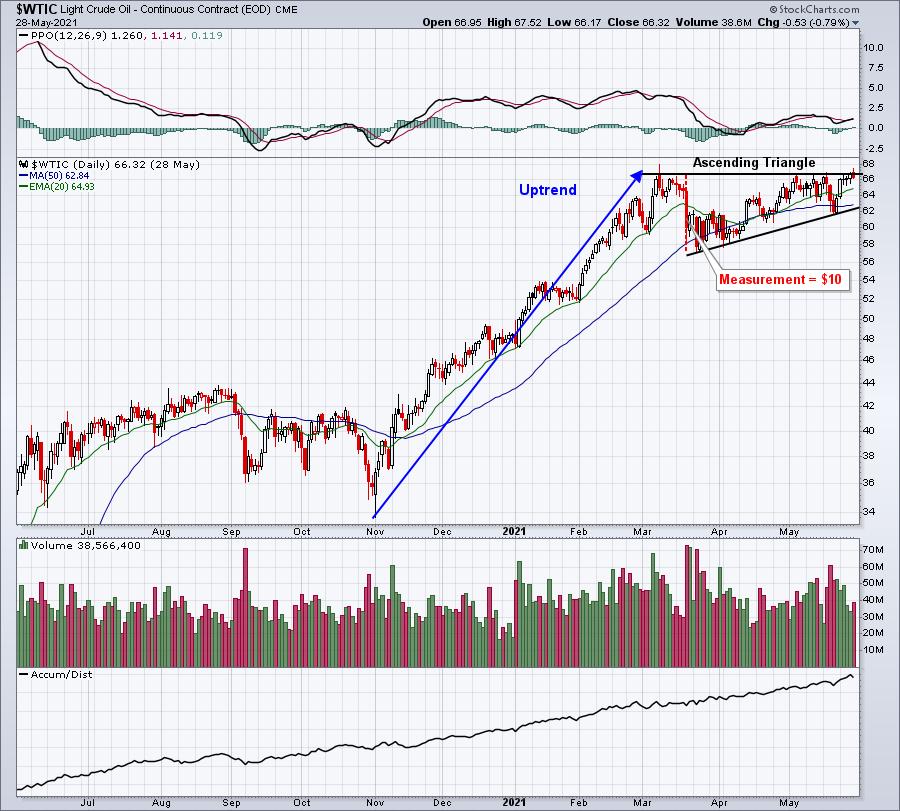
The measurement is the distance between the highs and the initial pattern low, or roughly from 67 down to 57. Upon breakout above 67, the target would be 77. Please note that the above chart only shows through Friday's close. Today, the WTIC is up more than 2% at last check and closing in on $68 per barrel.
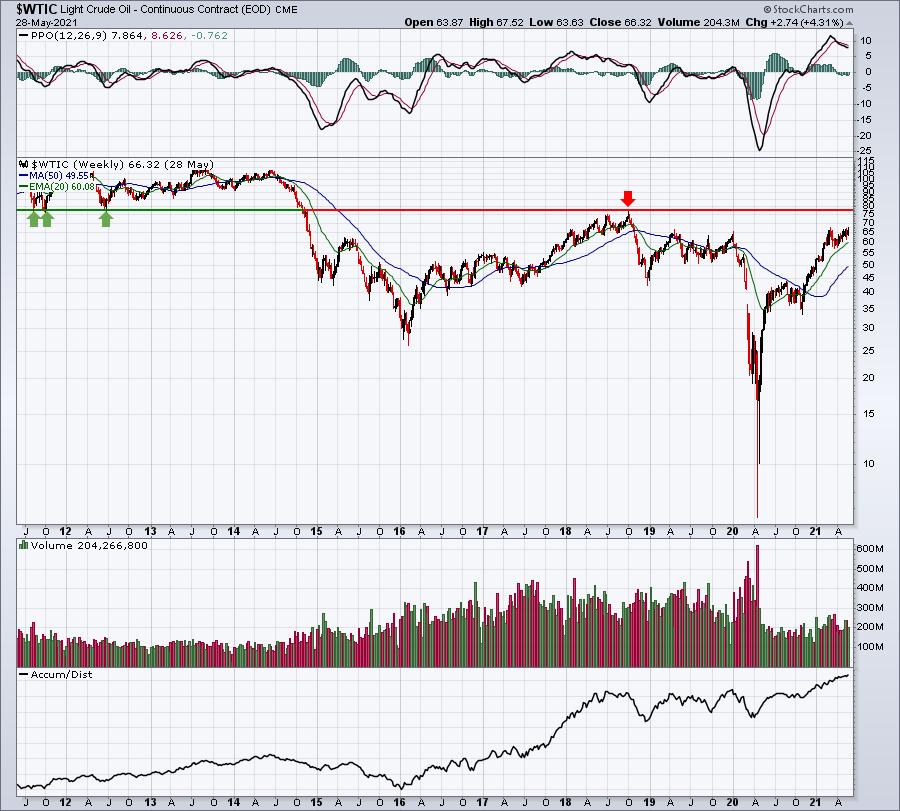
Getting back to that $77 target, it's interesting to pull up a longer-term weekly chart and see that key resistance is at that $77 level:
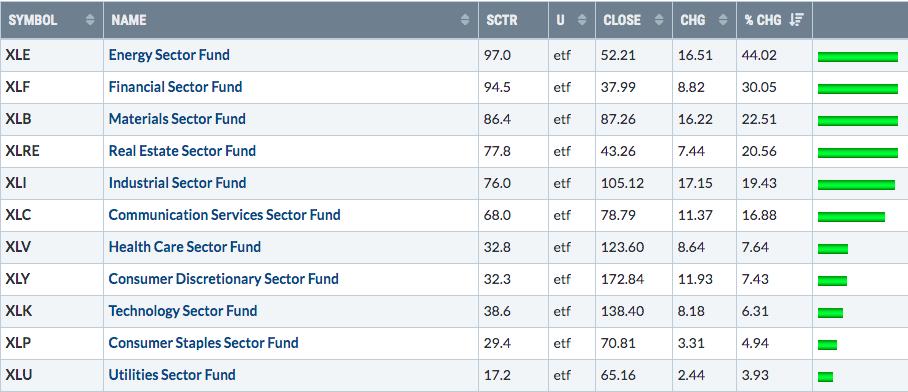
A move to $77 per barrel would likely result in further outperformance by the energy sector, which is already the leading sector year-to-date:
Sector/Industry Focus
Health care (XLV) is struggling today, but it may just be working off the last remnants of a negative divergence:
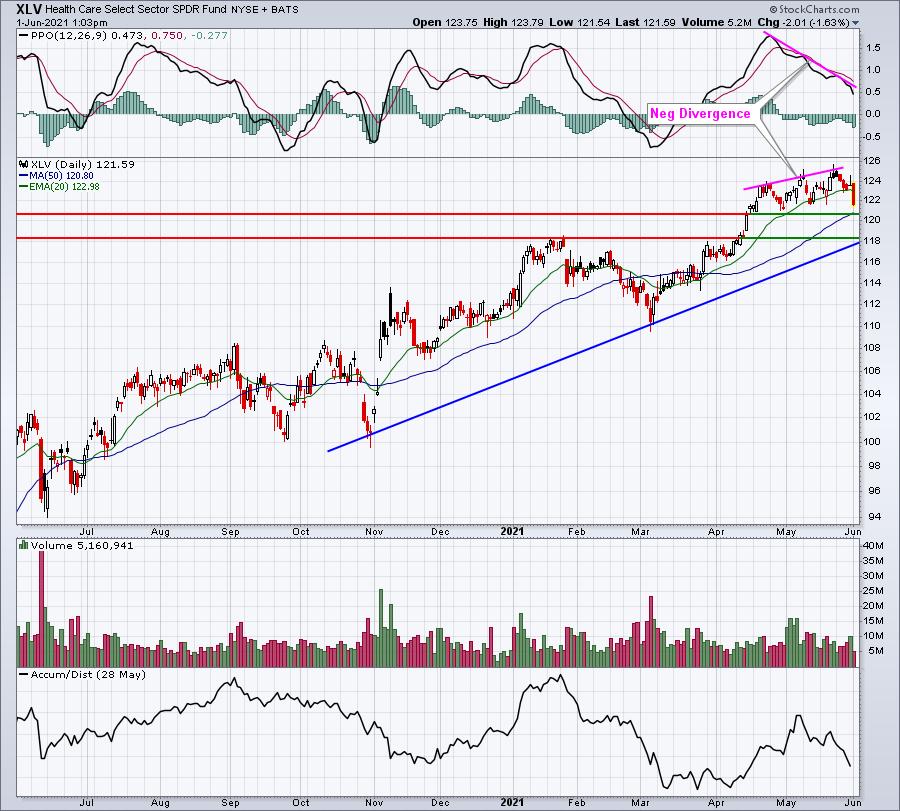
Further short-term weakness could set up very nice opportunities in health care later in June. This is a month where the sector tends to perform quite well. It's recently seen a negative divergence that could easily see a test of its 50-day SMA and a reset of its PPO back at centerline support. Price support from 118-120 should also give the group a lift if short-term selling continues.
ChartLists/Strategies
Today, I ran a scan of 52-week highs against three ChartLists (SECL, SFECL, and RGCL). Here were two stocks returned that looked interesting:
HON:
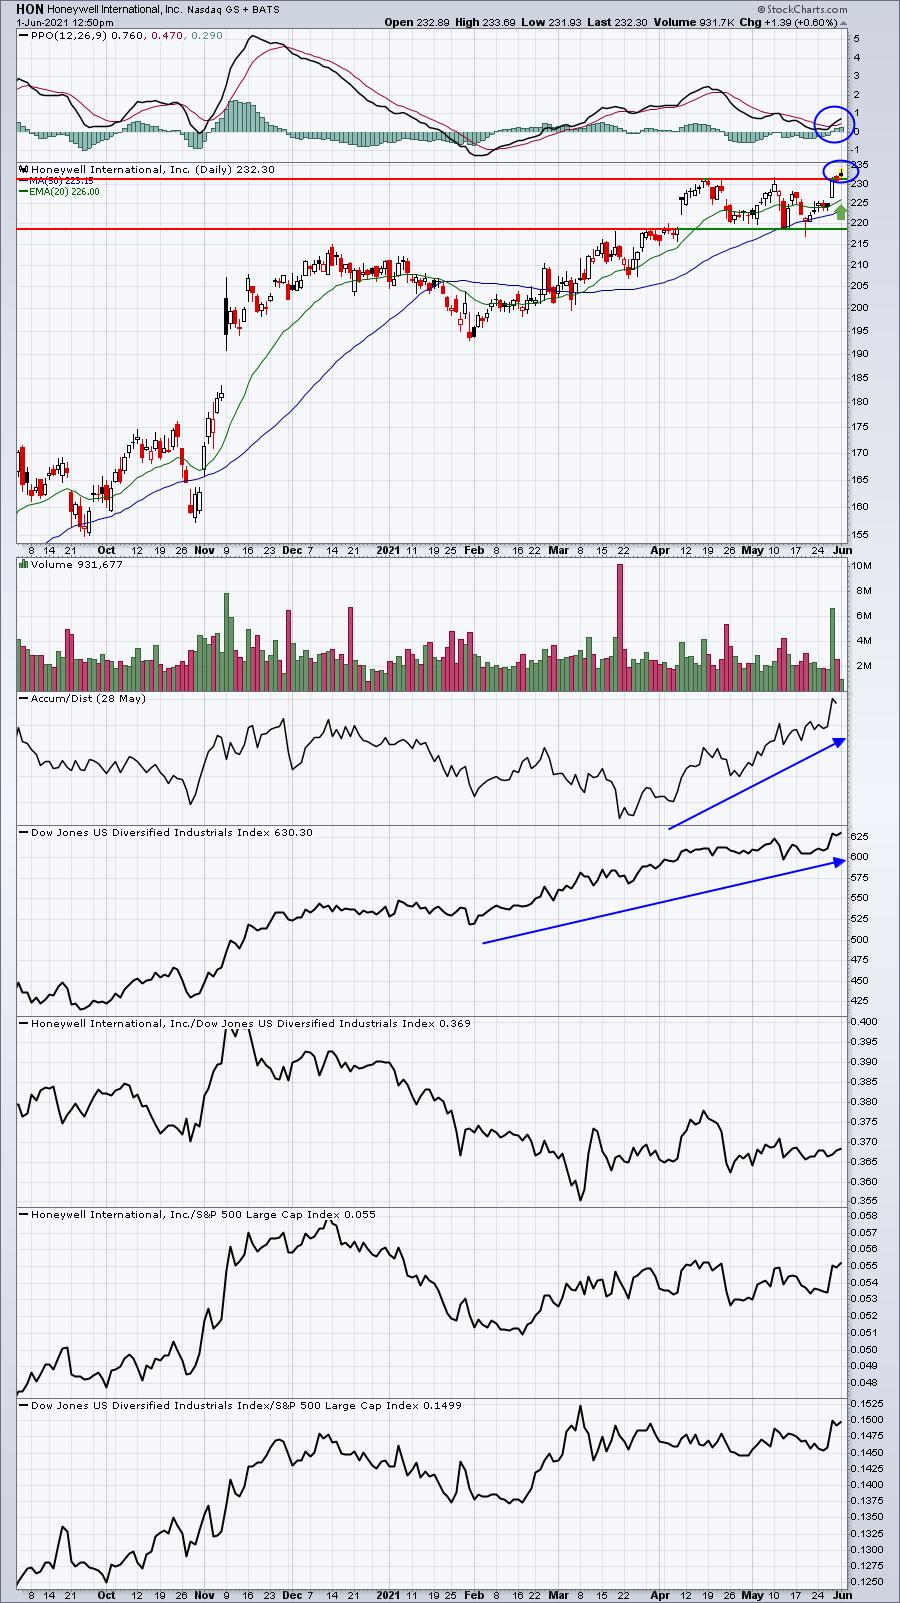
I prefer breakouts after consolidation periods and HON meets that criteria. Its PPO looks solid and its AD line is showing serious accumulation. Entering from the current price down to the rising 20-day EMA makes good reward-to-risk sense.
A:
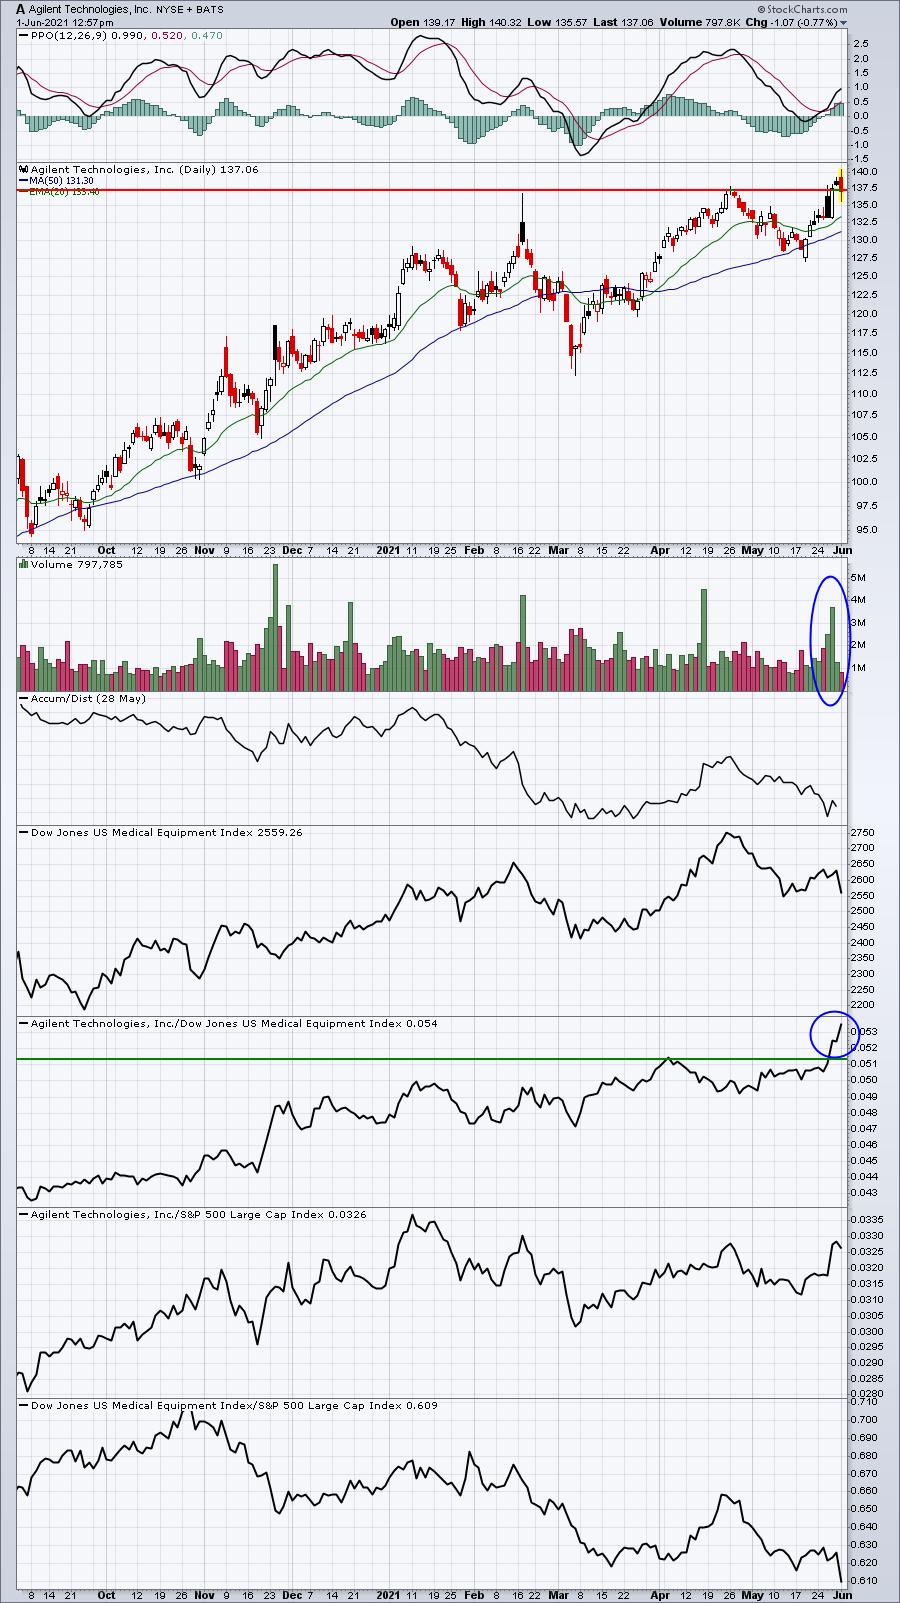
A has become one of the best performing medical equipment stocks ($DJUSAM) at a time when the group has broken to a fresh 52-week relative low. Health care stocks do tend to perform well during June, however, so I believe buying A on a pullback is a solid opportunity, especially considering the overall caution that should be used currently. Like HON, I believe buying down to the rising 20-day EMA makes sense.
Earnings Reports
Here are the key earnings reports for the next two days, featuring stocks with market caps of more than $10 billion. I also include a few select companies with market caps below $10 billion. Finally, any portfolio stocks that will be reporting results are highlighted in BOLD. If you decide to hold a stock into earnings, please understand the significant short-term risk that you are taking. Please be sure to check for earnings dates for any companies you own or are considering owning.
Tuesday, June 1:
ZM, BNS, HPE, STNE, CGC, APPS, MDLA, AMBA
Wednesday, June 2:
SPLK, NTAP, PAGS, AAP, ESTC, GWRE, PVH, DCI, SMAR, SMTC
Economic Reports
May PMI manufacturing: 62.1 (actual) vs. 61.5 (estimate)
May ISM manufacturing: 61.2 (actual) vs. 60.9 (estimate)
April construction spending: +0.2% (actual) vs. +0.6% (estimate)
Happy trading!
Tom