
EB Daily Market Report - Friday, June 4, 2021
Annual Spring Special
Our Spring Special, which is our best annual deal of the year, is underway! There's not a better time to extend your current membership. At the current rate of $997 for 14 months (2 bonus months), your monthly cost is 52% below our regular published monthly rate. It won't get any better than this, so please hurry. Our special will end on Tuesday, June 15th. We appreciate your loyalty and support.
For more information, CLICK HERE.
Executive Market Summary
- Futures were strong overnight and the buyers haven't let up
- The NASDAQ is having one of its strongest days as the 10-year treasury yield ($TNX) has fallen 6 basis points to 1.56%, its biggest drop in nearly two months
- Nonfarm payrolls surged to 559,000, but that did come up nearly 100,000 short of estimates
- Technology (XLK, +1.93%) and communication services (XLC, +1.43%) are the best sector performers
- Only real estate (XLRE, -0.07%) and financials (XLF, -0.03%) are lower on the session
- Crude oil ($WTIC) continues its torrid move higher, rising another 0.93% to nearly $70 per barrel
- Automobiles ($DJUSAU, +3.00%) is the best performing industry group, led by Tesla's (TSLA) 4.26% gain
Market Outlook
Today's market action is solid after nonfarm payrolls were released this morning. I believe that bodes well for the longer-term. Today, however, is the last day of a very bullish May 26th to June 6th period. Monday is June 7th and starts what typically can be a rougher period for the S&P 500. June 12th to 17th isn't bad historically, but the 7th through the 27th has produced the following actual gains/losses since 2009:
- 2009: -2.25%
- 2010: +1.12%
- 2011: -0.47%
- 2012: +1.27%
- 2013: -0.58%
- 2014: +0.59%
- 2015: +0.42%
- 2016: -5.16%
- 2017: -0.41%
- 2018: -2.62%
- 2019: +2.86%
- 2020: -5.79%
6 of the last 11 years (all since the financial crisis low in 2009) have seen the S&P 500 drop during these next 3 weeks. While 5 of these years did see the S&P 500 move higher, the average gain was only +1.25% in those years. Meanwhile, those two years with losses in excess of 5% really stand out and it's occurred twice in just the past 5 years.
All of these seasonal stats are most definitely secondary to what's actually taking place on the charts. The S&P 500 is having a very strong day to close out the week and a breakout would be bullish, despite seasonally bearish tendencies:
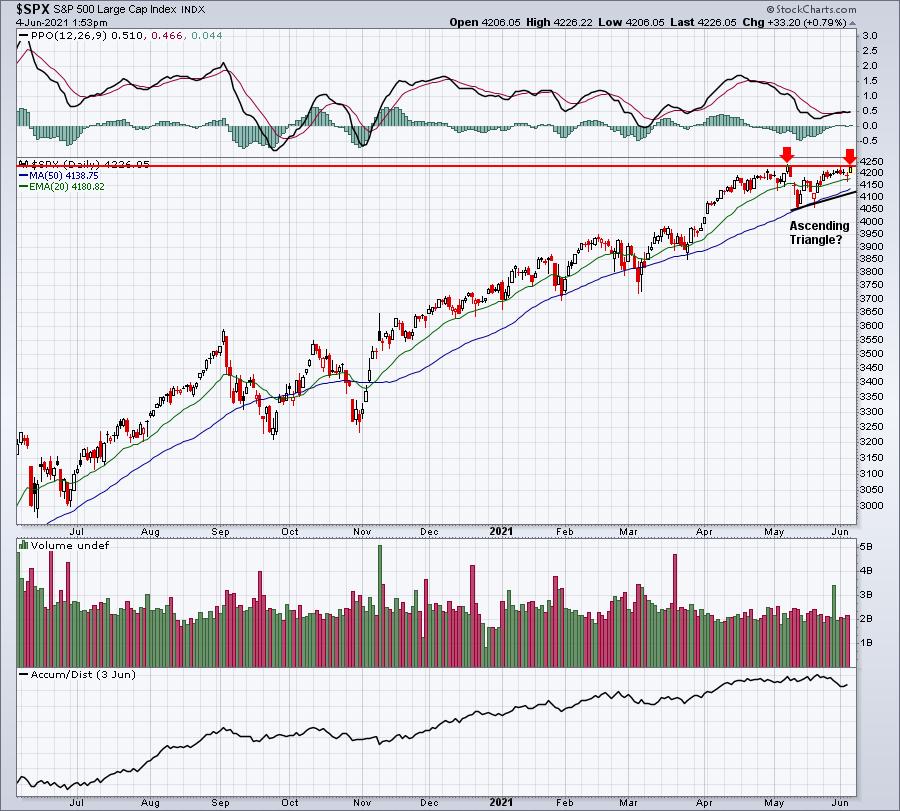
The all-time high close on the S&P 500 is 4232.60 on May 7th. The ascending triangle pattern is a bullish continuation pattern and a short-term drop to print the "D" in an A-B-C-D-E ascending triangle would establish a lower uptrend line. Or we could simply move all the way back down to test that May low, which was caused by April's inflation reports that were reported in May. That would represent rectangular consolidation. Or a third option is that the stock market completely ignores the inflation hype and breaks out to new record highs and keeps the momentum rolling along. I don't believe this is the highest probability, but as we know, anything can happen in the stock market.
Sector/Industry Focus
Home improvements ($DJUSHI) has been one of the worst performing industry groups over the past week, but it is at a very important short-term support level:
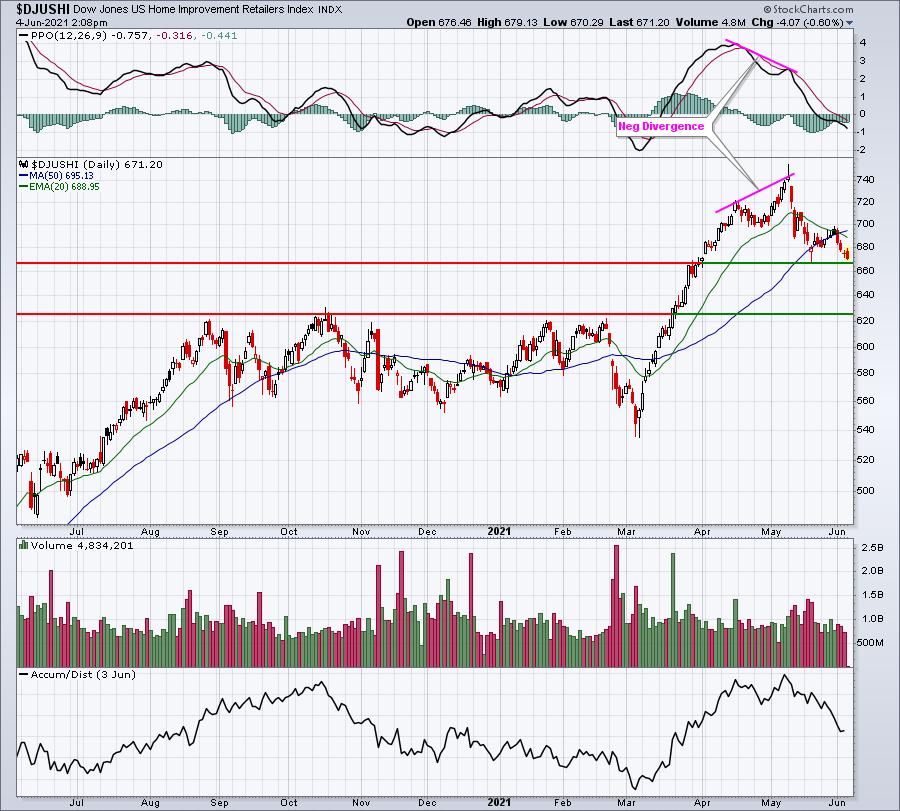
Its absolute and relative strength both tumbled after printing that negative divergence. If the low at 668.22 fails to hold as support, home improvement stocks could have much further weakness ahead.
ChartLists/Strategies
I scoured the Strong Earnings ChartList, looking for potential trades with very tight stops in place. I wanted to avoid stocks that had made big runs of late as they could pose considerable risk if the market tops short-term. Here are 3 that caught my eye and are either at key lows or on the verge of bigger breakdowns. Be sure to keep stops in place:
SBH:
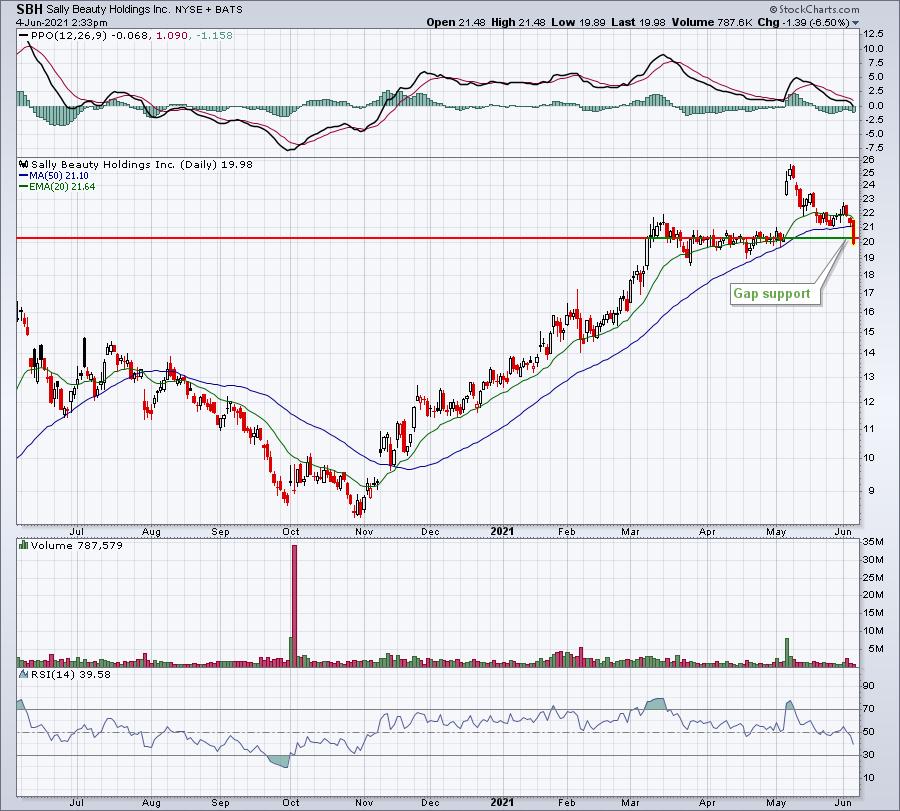
SBH is one of our portfolio stocks and it's been hurt recently by weakness in specialty retailers ($DJUSRS). Also ULTA, another stock in the space, has been trending in similar style. Gap support is at 20.26. A close below that support would be short-term bearish, at least until the stock can recover back above that level. This possible trade would bank on a rebound in the final 90 minutes of the trading day.
JBHT:
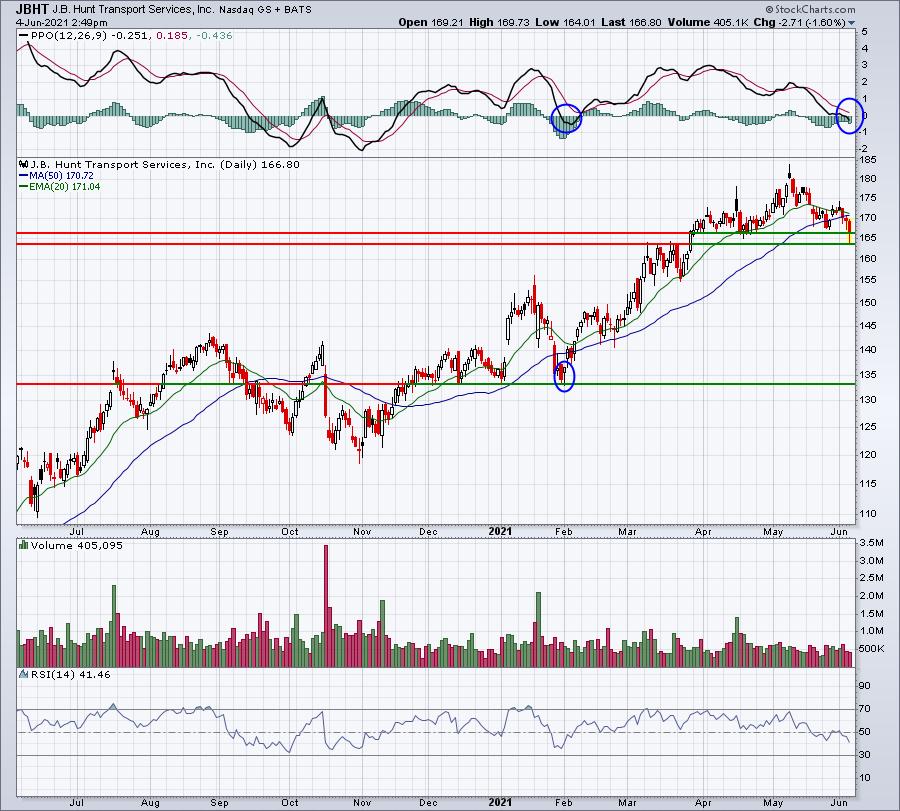
Like SBH, JBHT is looking for a rebound from today's low, so a very tight stop could be kept in place (anything below today's low). I circled the reversing candle after testing price support back in February and also circled the PPO just breaking below zero. The PPO is a secondary indicator to price action. You can also see the RSI very close to 40 back in February. We're seeing that same setup here.
AEO:
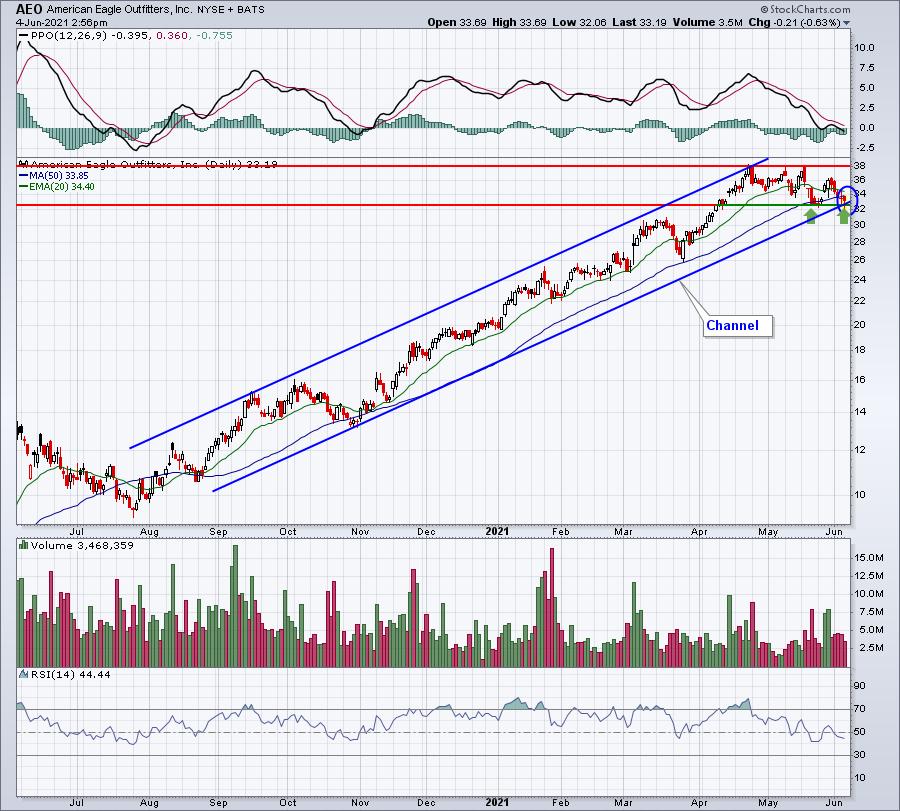
AEO has both price and channel support connecting just above the 32 level. A trip back to the 38 resistance is what I'd look for. Meanwhile, keeping a fairly tight stop beneath today's price low makes sense.
Earnings Reports
Here are the key earnings reports for the next two days, featuring stocks with market caps of more than $10 billion. I also include a few select companies with market caps below $10 billion. Finally, any portfolio stocks that will be reporting results are highlighted in BOLD. If you decide to hold a stock into earnings, please understand the significant short-term risk that you are taking. Please be sure to check for earnings dates for any companies you own or are considering owning.
Friday, June 4:
None
Monday, June 7:
MRVL, COUP, MTN, HQY, SFIX, GIII, REVG
Economic Reports
May nonfarm payrolls: 559,000 (actual) vs. 650,000 (estimate)
May private payrolls: 492,000 (actual) vs. 625,000 (estimate)
May unemployment rate: 5.8% (actual) vs. 5.9% (estimate)
May average hourly earnings: +0.5% (actual) vs. +0.2% (estimate)
April factory orders: -0.6% (actual) vs. +0.1% (estimate)
Happy trading!
Tom