
EB Daily Market Report - Monday, June 14, 2021
Spring Special
Just a quick reminder that our Spring Special, our best annual deal of the year, ends tomorrow. The annual special provides 14 months of membership (two bonus months!) for $997, 52% off the regular monthly rate of $147. For more information, CLICK HERE!
ChartLists Updated
The following ChartLists were updated over the weekend and are available for download/review:
- Strong Earnings ChartList (SECL)
- Strong Future Earnings ChartList (SFECL)
- Raised Guidance ChartList (RGCL)
- Short Squeeze ChartList (SSCL)
In addition, I wrote a recap of last week's market action in my Trading Places blog at StockCharts.com and offered everyone the top 5% of performers in each of the following key indices:
- Dow Jones Industrial Average
- S&P 500 (large cap)
- NASDAQ 100
- S&P 400 (mid cap)
- S&P 600 (small cap)
There were 82 charts in all and you can download them into your account by clicking on the following link and then entering the password PERFORM12:
Once downloaded, if you view the ChartList in "Edit" form, you'll see notes under the "Comments" column. Those are the charts where I annotated key technical developments.
Executive Market Summary
- Futures were mixed overnight, but did favor the growth-oriented NASDAQ
- Action today has been bifurcated with much more bullishness in the NASDAQ, while the Dow Jones retreats; the S&P 500 is down, but in the middle of the other two
- The 10-year treasury yield ($TNX) is up nearly 4 basis points to 1.50%, but the money coming out of treasuries is moving into growth stocks
- The IWF:IWD (growth vs. value) ratio is up solidly today above 1.64, the highest level since the beginning of May
- Earlier today, the XLY:XLP (discretionary vs. staples) ratio moved to a one-month high - a bullish signal as well
- Technology (XLK, +0.42%) is leading today's action, while materials (XLB, -1.54%) and financials (XLF, -1.18%) trail
- The second key June inflation report will be released tomorrow morning - the June PPI report; expect another hot report
- On an industry level, computer hardware ($DJUSCR) is leading technology stocks higher
Market Outlook
Technology (XLK) is nearing a key breakout level at 143.66 - that's the highest candle body that's printed on the XLK. Here's the latest look at this very important area of the market:
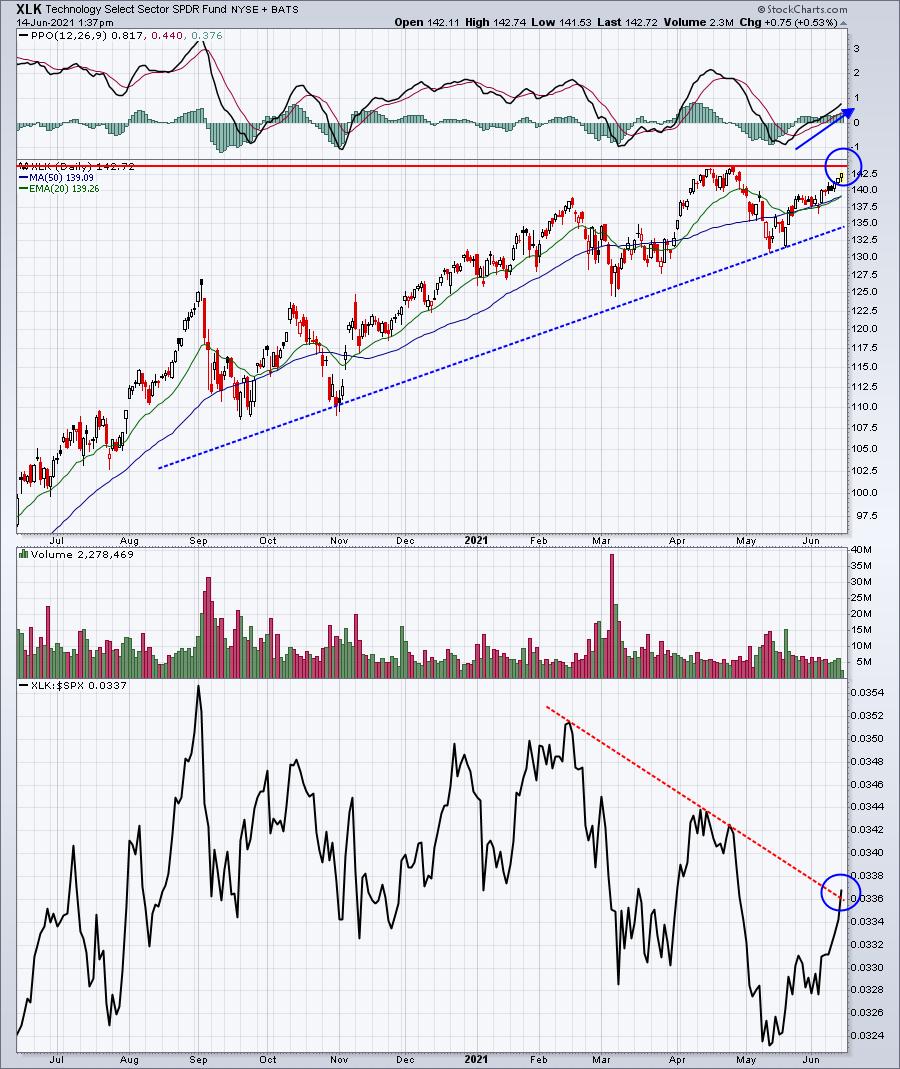
The PPO is strengthening, which is a big positive. But the two blue circles are awaiting definitive absolute and relative breakouts. Those two additions to strengthening momentum would be powerful. Let's see if we can get it.
Sector/Industry Focus
Many growth industries are regaining strength. In technology, we're seeing renewed strength in computer hardware ($DJUSCR), semiconductors ($DJUSSC), and software ($DJUSSW). The following chart highlights the improving technical picture of each:
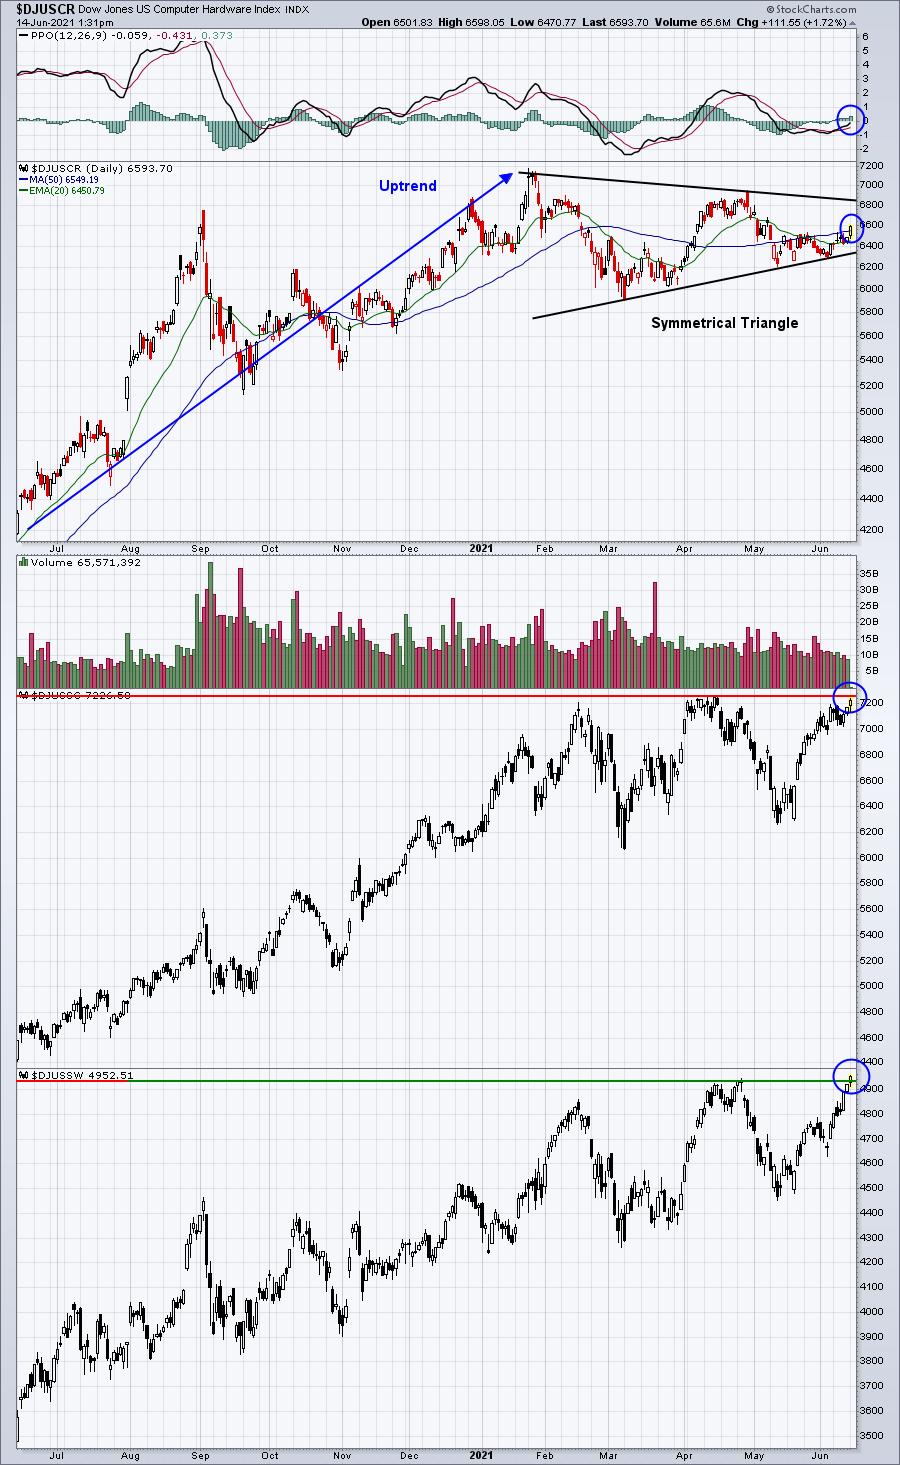
Software is breaking out on an intraday basis, while semiconductors are nearing the same. Meanwhile, computer hardware still has a long ways to go to break above its January high, but its symmetrical triangle breakout is closer. Simply breaking back above its 20-day EMA is a start to perhaps a pre-earnings run. Typically, I look for pre-earnings advances to start later in the month, but we can't rule anything out.
ChartLists/Strategies
In the technology space, here is the scan to run to identify stocks that are on both our Strong Earnings and Raised Guidance ChartLists. These would be stocks likely poised to perform extremely well in a more growth-oriented environment:
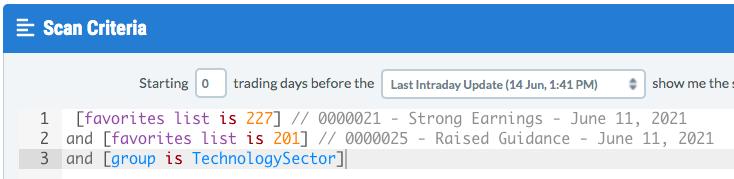
Keep one thing in mind. The "favorites list" above refers to specific ChartLists within my StockCharts.com account. If you simply type the above scan into your StockCharts.com account, it won't work. You must select these ChartLists in YOUR account before running this scan. YOUR StockCharts.com account will not recognize the "favorite lists" in MY account.
Here were the top 24 SCTRs - SCTR = StockCharts Technical Rank - (in SCTR order) among the 56 stocks that were returned:
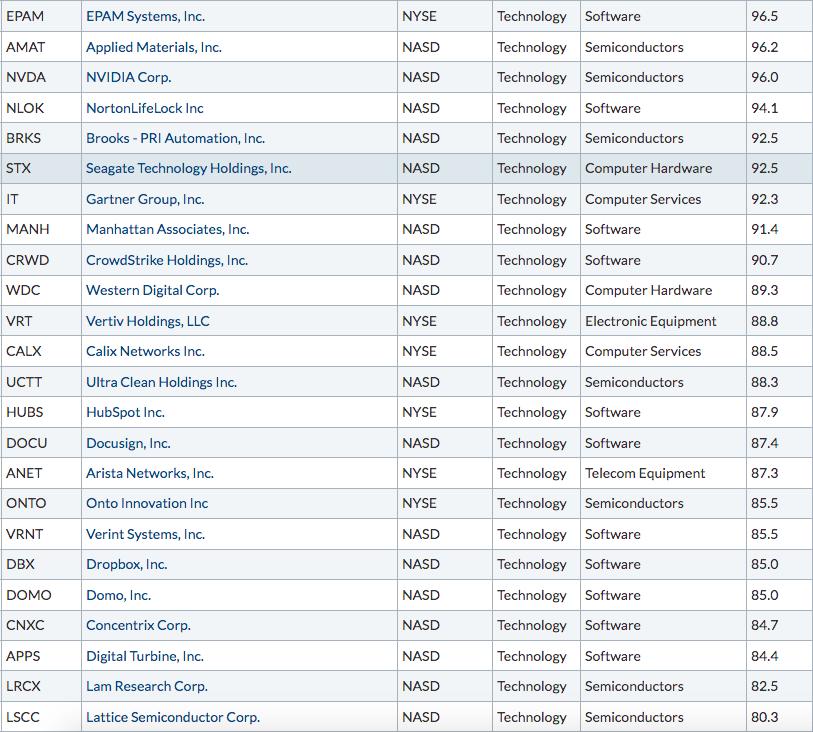
AMAT and IT are portfolio stocks this quarter. Here are 2 stocks that look interesting at current price levels:
MANH:
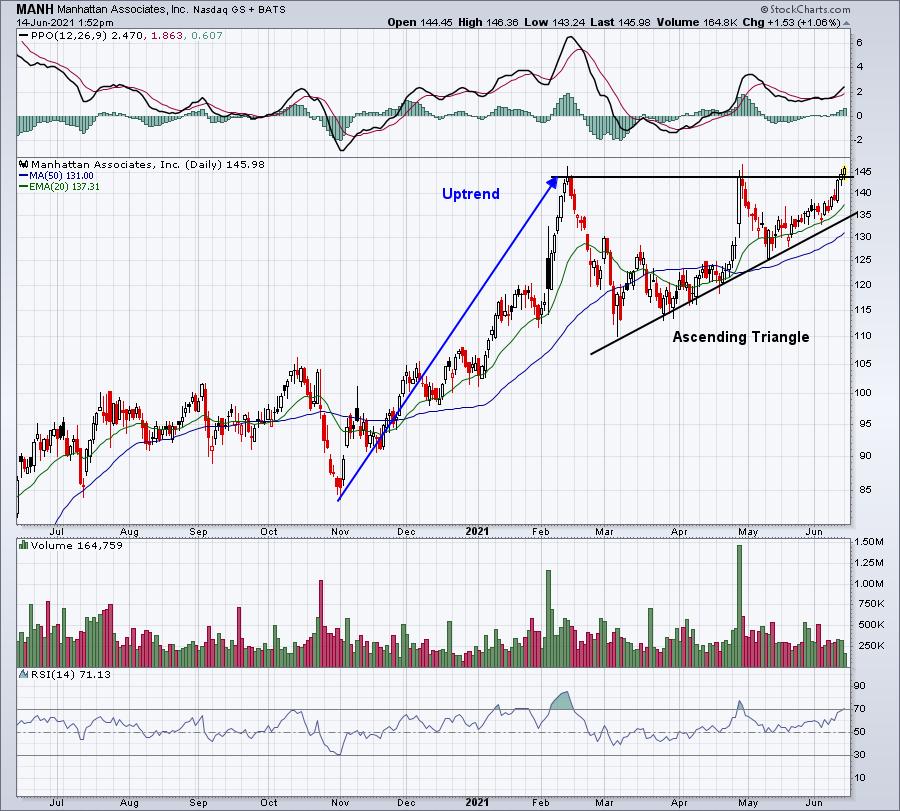
I like the breakout here, though I'd really like to see volume pick up this afternoon.
CALX:
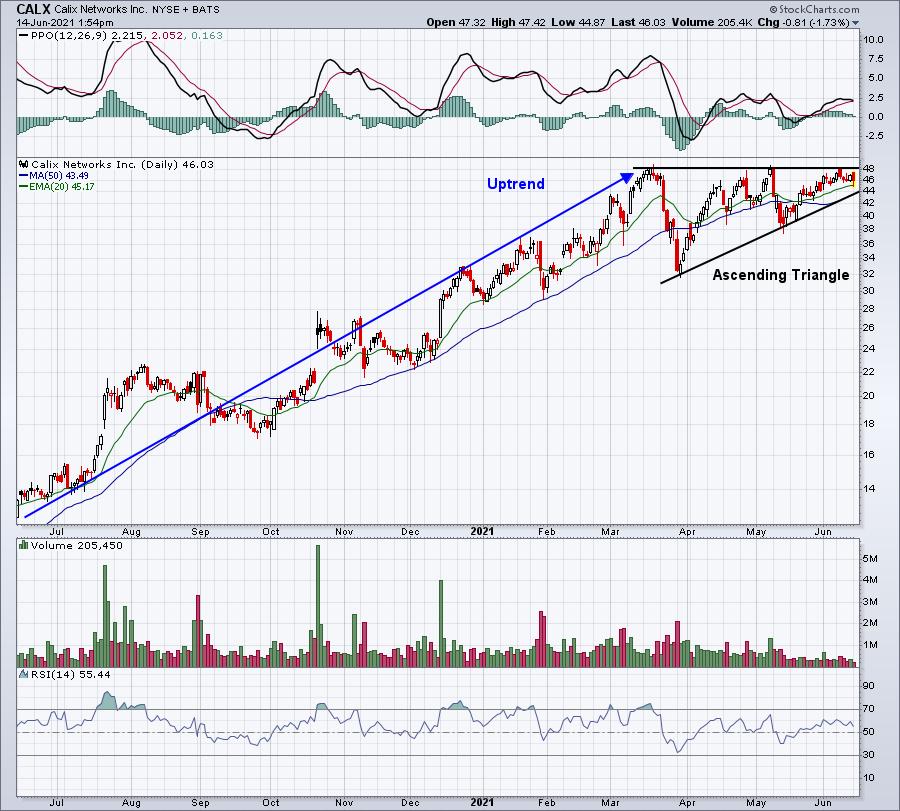
This is a very bullish pattern, but we'll need to see a breakout with confirming volume. If we get that, this pattern measures to 64, a very nice advance from current price.
Earnings Reports
Here are the key earnings reports for the next two days, featuring stocks with market caps of more than $10 billion. I also include a few select companies with market caps below $10 billion. Finally, any portfolio stocks that will be reporting results are highlighted in BOLD. If you decide to hold a stock into earnings, please understand the significant short-term risk that you are taking. Please be sure to check for earnings dates for any companies you own or are considering owning.
Monday, June 14:
None
Tuesday, June 15:
ORCL, HRB, LZB
Economic Reports
None
Happy trading!
Tom