
EB Daily Market Report - Tuesday, June 15, 2021
Spring Special Ends TODAY
Today is it. We've had a tremendous response over the past two weeks, but I just want to remind all of you that our Spring Special ends today. It's our best deal of the year, so please consider taking advantage of it to lower your monthly cost. The annual Spring Special provides 14 months of membership (two bonus months!) for $997, 52% off the regular monthly rate of $147. For more information, CLICK HERE!
One other reminder. If you're currently a trial member and you extend using the Spring Special, the 14 months will be added AFTER your trial period ends. You won't lose your trial period. That's a question that arises frequently, so I wanted to address it.
Event Today
At 4:30pm ET today, I'll be hosting our June Max Pain webinar. It is usually reserved for members only, but I want to provide our entire EB community information related to options expiration to help in their trading strategy. Feel free to invite family and friends to join us. They can use the link below for a free session. We will add anyone new to our community to the EB Digest newsletter, which is a 100% free subscription with no credit card required. They'll be able to unsubscribe at any time. Here's the link for today:
https://earningsbeats.zoom.us/j/81522759201
The room will open at approximately 4:00pm ET, 30 minutes before the start.
Executive Market Summary
- Futures were lower overnight and our major indices are struggling today
- A slew of poor economic reports is taking its toll on U.S. equities
- The 10-year treasury yield ($TNX) is flat despite the weak economic data; PPI data could be offsetting that weak data
- May PPI came in very hot, as expected, though materials (XLB, -0.83%) continue pushing lower
- May retail sales were much weaker than expected, pressuring many consumer discretionary (XLY, -0.70%) stocks
- Toys ($DJUSTY, -2.99%) and home improvement retailers ($DJUSHI, -1.61%) were two casualties
- Energy (XLE, +1.36%) is today's best sector, buoyed by higher crude oil prices, which are up 1.24% to nearly $72 per barrel
- Gold ($GOLD, -0.56%), silver ($SILVER, -1.65%), and copper ($COPPER, -4.29%) are all down considerably
Market Outlook
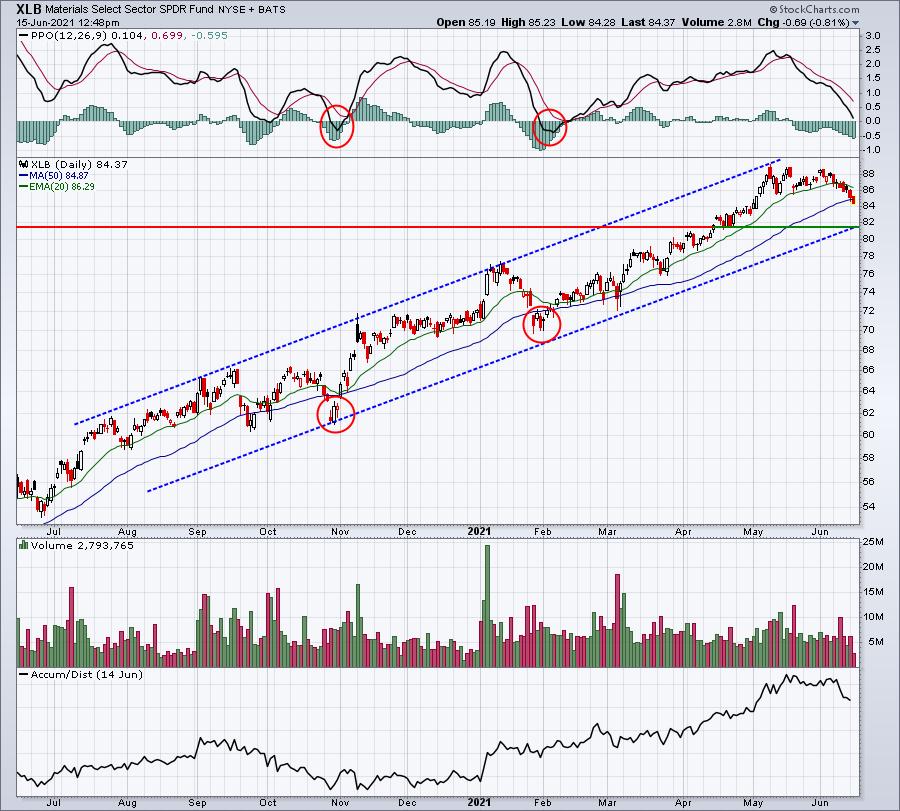
Materials (XLB) have had a rough June thus far, and it's a group that I have serious reservations about on a relative basis as we move forward. The XLB is threatening to close beneath its 50-day SMA today for the first time since early March. While I'm a bit bearish on the group, I do want to point out two other "scares" beneath the 50-day SMA that turned out to be GREAT buying opportunities on the weekly chart. Check out the breakdowns circled on the daily chart. They were both 20-week EMA tests on the weekly chart:
XLB - daily:
XLB - weekly:
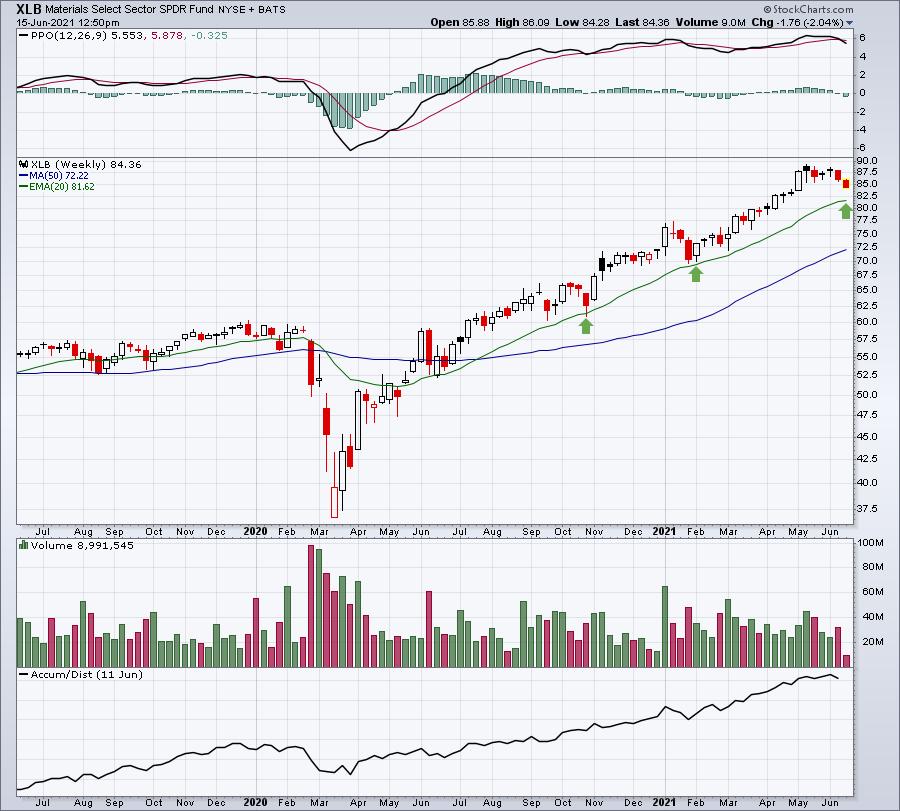
A definitive break beneath the rising 20-week EMA would really start to show the cracks in the foundation of the current uptrend. Thus far, 50-day SMA failures on the daily chart (red circles) have been held together by that rising 20-week EMA support. The exact same setup is in place now. The breakdown beneath the 50-day SMA could result in yet another successful 20-week EMA test on the longer-term chart.
Again, I'm not a long-term fan of the group, but I want to point out the other argument, which currently remains bullish.
Sector/Industry Focus
The retail sales number caught many professionals by surprise today and we're seeing fairly significant selling in many stocks within this space. The highly-diversified retail ETF (XRT) is showing a break of its rising 20-day EMA:
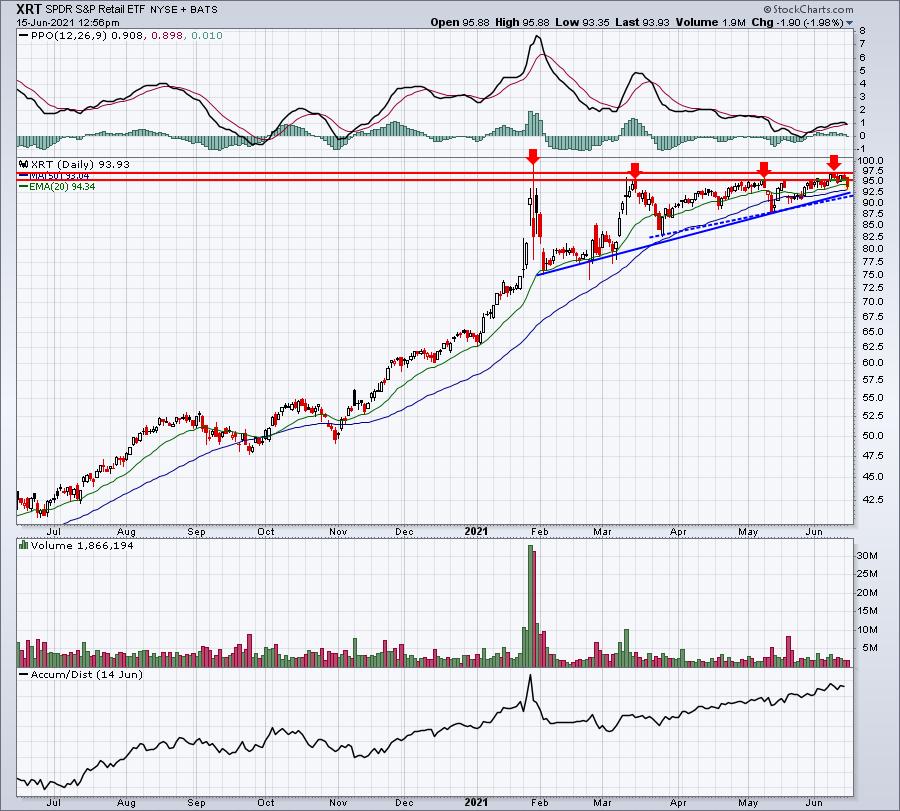
The XRT remains in a very bullish triangle pattern, but just keep in mind that a loss of 92 support opens up this group to more short-term selling. And we're heading into the middle part of June, which can be more difficult for equities in general.
ChartLists/Strategies
As we move into options expiration week, it's generally a very good idea to check out options on any stocks that you're considering trading. If the "max pain" options effect aligns opposite your intended position, I'd be very careful. I'll be discussing several max pain trading candidates later this afternoon during our June Max Pain webinar. If you didn't see my Trading Places blog article from this morning regarding options and the impact they could have on NVIDIA (NVDA), you can CLICK HERE to review this piece. NVDA continues to hold up very well, but there is a TON of net in-the-money call premium in play. That doesn't mean NVDA cannot go higher, it simply means that trading NVDA on the long side presents considerable risk that I'd be unwilling to take.
Earnings Reports
Here are the key earnings reports for the next two days, featuring stocks with market caps of more than $10 billion. I also include a few select companies with market caps below $10 billion. Finally, any portfolio stocks that will be reporting results are highlighted in BOLD. If you decide to hold a stock into earnings, please understand the significant short-term risk that you are taking. Please be sure to check for earnings dates for any companies you own or are considering owning.
Tuesday, June 15:
ORCL, HRB, LZB
Wednesday, June 16:
LEN
Economic Reports
May PPI: +0.8% (actual) vs. +0.5% (estimate)
May Core PPI: +0.7% (actual) vs. +0.5% (estimate)
May retail sales: -1.3% (actual) vs. -0.5% (estimate)
May retail sales excluding autos: -0.8% (actual) vs. +0.2% (estimate)
June empire state manufacturing index: 17.4 (actual) vs. 22.5 (estimate)
May industrial production: +0.8% (actual) vs. +0.6% (estimate)
May capacity utilization: 75.2% (actual) vs. 75.0% (estimate)
April business inventories: -0.2% (actual) vs. -0.1% (estimate)
June housing market index: 81 (actual) vs. 83 (estimate)
FOMC meeting begins today with policy statement released Wednesday, 2pm ET
Happy trading!
Tom