
EB Daily Market Report - Thursday, June 17, 2021
Executive Market Summary
- Futures were relatively flat this morning, but we've seen relative strength in the tech-laden NASDAQ throughout the session
- Initial jobless claims, after falling for several weeks, took a surprising turn back to the upside this morning
- The dollar (UUP, +0.59%) has been a huge beneficiary of yesterday's FOMC policy statement, crushing gold (GLD, -3.12%)
- Energy (XLE, -3.17%) and materials (XLB, -2.61%) have been hit hard today with the rising dollar
- Small caps ($SML) and mid caps ($MID) are lagging badly today, despite showing some leadership yesterday afternoon after the Fed statement
- Technology (XLK, +1.45%) is today's big winner as semiconductors ($DJUSSC, +2.23%) are responsible for much of that relative strength
- Enphase Energy (ENPH, +6.01%) and NVIDIA (NVDA, +5.56%) are the leaders in the S&P 500
- An all-time candle body high prints on the NASDAQ with a close today over 14,204.51; this would also represent a very bullish ascending triangle breakout
Market Outlook
The FOMC policy statement, and the subsequent bond and stock market reactions, was very interesting as always. I guessed wrong yesterday that we'd see a move into bonds, driving yields lower. But there definitely was good news as yields rallied strongly. On the surface, many might have looked at the reaction and figured hotter-than-expected inflation was the culprit for the surge in yields. However, that is not how I read Wall Street's reaction. The dollar's (UUP) late-afternoon surge, which is continuing today, suggests that yields rising has much more to do with economic expansion than it does inflationary pressures. Perhaps most notable was the reaction in gold (GLD), long viewed as an inflation hedge. Surely, if Wall Street was expecting further inflationary pressures ahead based on the Fed's acknowledgement of hotter inflation, gold would be the choice of investors. Instead, check out the reaction in the GLD since 2pm yesterday:
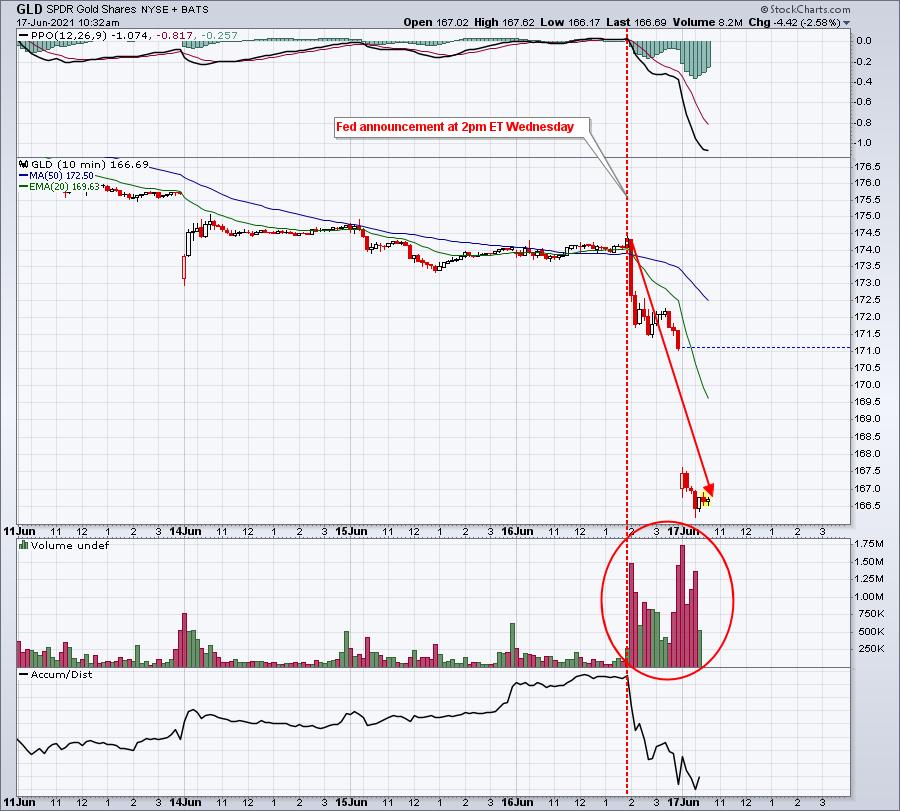
Gold has lost roughly 5% since 2pm ET yesterday, easily the worst performing area since the Fed spoke. That is NOT the reaction you'd expect if Wall Street was truly fearing inflation. I'm very comfortable saying that there is little in the way of stock market performance that suggests inflation concerns will be anything other than temporary. This is what I had discussed months ago before the March-April-May inflation data began pouring in.
I remain completely in the growth camp. While short-term it's very difficult to say we won't have another period of anxiety, I firmly believe the long-term sets up quite well for growth stocks.
Sector/Industry Focus
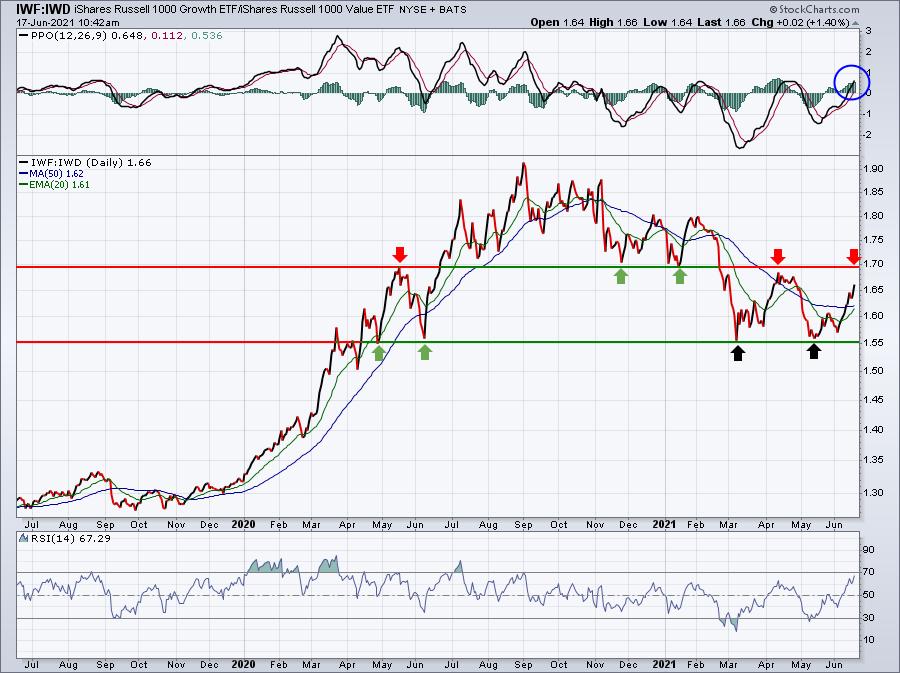
While the GLD has been tumbling, the IWD:IWF (growth vs. value) ratio has quietly climbed to another short-term high. We still need to negotiate the 1.69 level from a more intermediate- to long-term perspective, but the short-term continues to show excellent strength as evidenced by the daily PPO above the centerline and strengthening:
We see lots of head fakes in the stock market short-term, but the longer-term is different. The long-term themes that I fully expect to continue are:
- the secular bull market
- historically-low interest rates, though moving to 2.0%-3.0% is quite possible
- a rising dollar
- outperformance of growth stocks vs. value stocks
- outperformance of aggressive sectors vs. defensive sectors
- relative underperformance by commodities
- tame inflation
Many of the initial reactions to yesterday's FOMC policy statement support the long-term themes listed above
ChartLists/Strategies
Many growth stocks are showing considerable absolute and relative strength. I expected this to happen, but honestly figured it would be later in the year. But that does not appear to be the case. I'd consider accumulating your favorite growth stocks, realizing that many of the FAANG names are probably the safest from a long-term perspective, while others might make more sense for investors/traders willing to accept more risk. I ran a scan the other day that filtered those stocks on our Strong Earnings and Raised Guidance ChartLists. To find more growth-oriented stocks, I'd review stocks on both of these two ChartLists that are in either the technology, consumer discretionary, or communication services sectors. Here's how that scan would look:
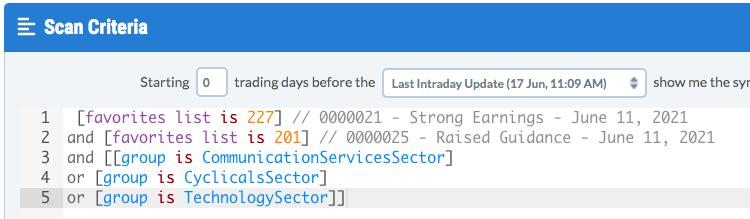
This scan returned 123 stocks. That's a great universe to start with.
NVDA, one of our Max Pain stocks that I suggested looked vulnerable in the near-term, is on this list and soaring today on extremely heavy volume. Market makers will not attempt to slow down a stock like this. They simply don't have enough capital so they'll continue buy the stock to offset the calls that they're selling. While NVDA was set up for a possible fall during options expiration week, it's one of the best semiconductor stocks right now:
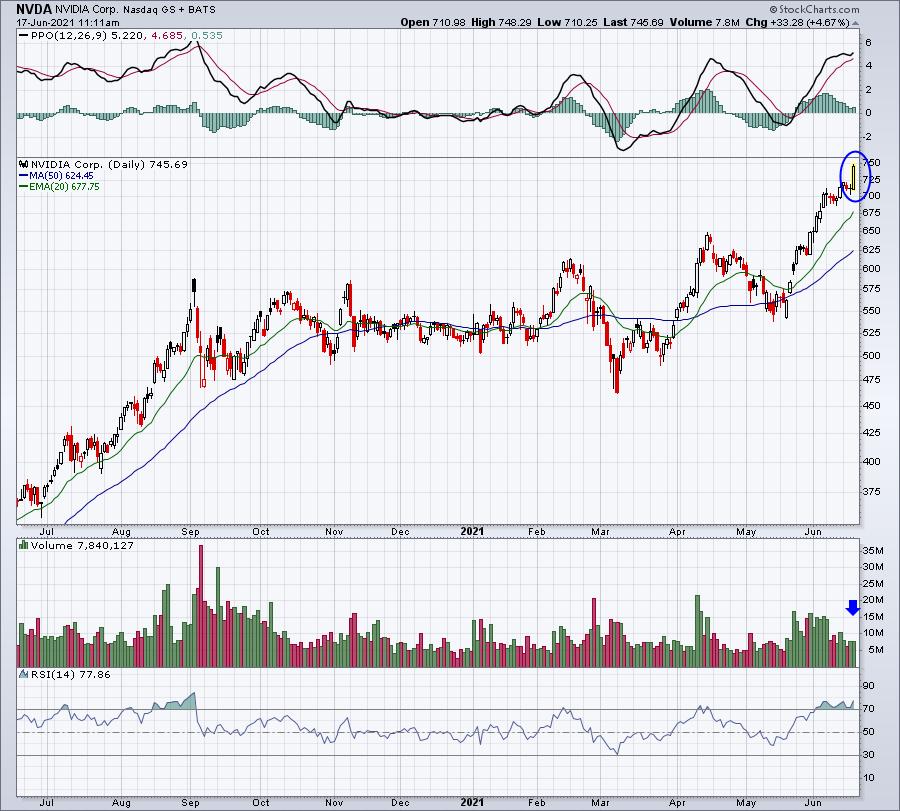
It's overbought, so NVDA definitely could pull back at some point, but I love the stock longer-term. Accumulating it on weakness makes sense to me.
HUBS:
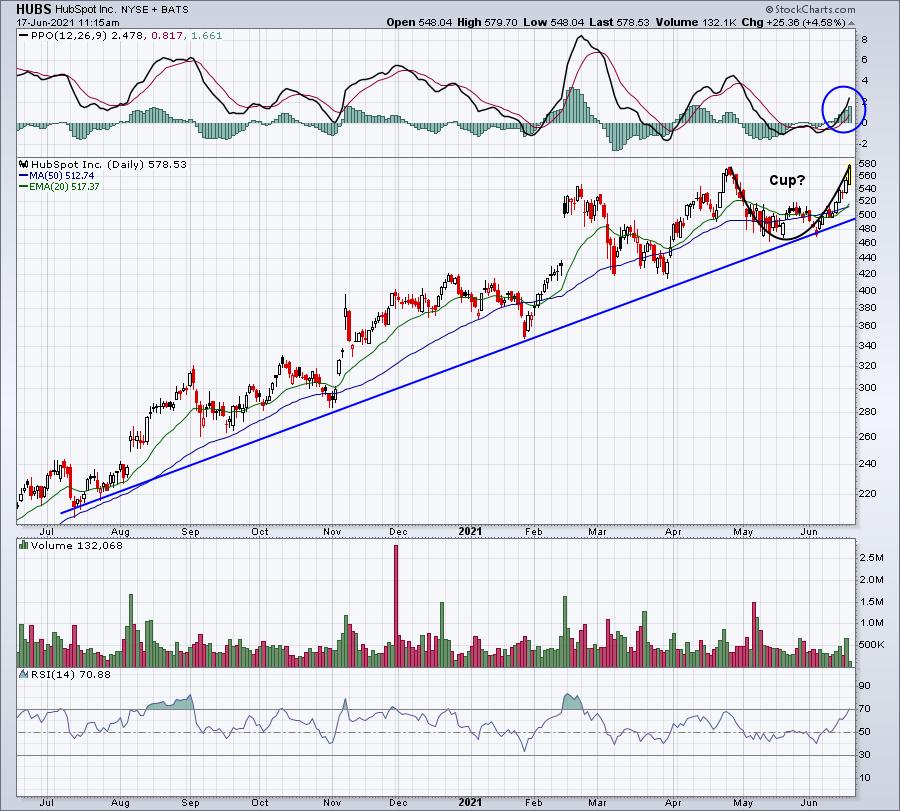
HUBS is attempting a breakout today and, even if it fails, I'd be very interested in accumulating shares on a pullback. It's been a very consistent performer, despite the hesitation of traders to buy growth stocks the past several months:
CRWD:
This is another technology stock, but breakouts need to be respected and CRWD has one rapidly approaching after months of consolidation:
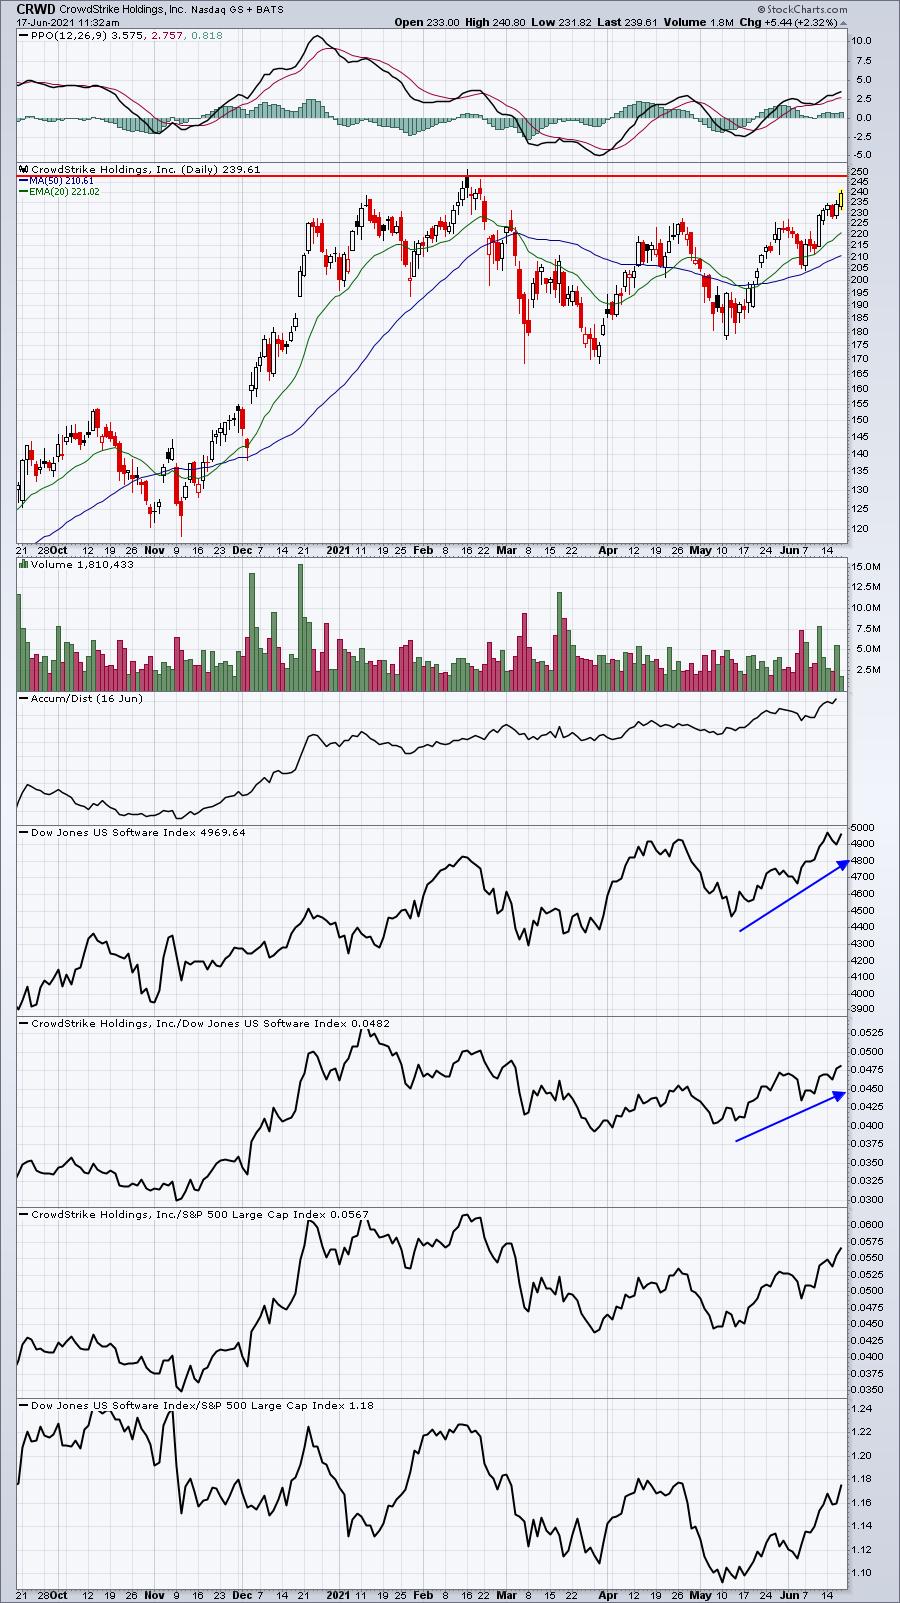
Software ($DJUSSW) is strengthening and CRWD was a former leader in the space that's showing strengthening relative strength again. I'd most definitely respect a price breakout.
Earnings Reports
Here are the key earnings reports for the next two days, featuring stocks with market caps of more than $10 billion. I also include a few select companies with market caps below $10 billion. Finally, any portfolio stocks that will be reporting results are highlighted in BOLD. If you decide to hold a stock into earnings, please understand the significant short-term risk that you are taking. Please be sure to check for earnings dates for any companies you own or are considering owning.
Thursday, June 17:
ADBE, KR, JBL, CMC, SWBI
Friday, June 18:
None
Economic Reports
Initial jobless claims: 412,000 (actual) vs. 360,000 (estimate)
June Philadelphia Fed Manufacturing Index: 30.7 (actual) vs. 31.0 (estimate)
May leading indicators: +1.3% (actual) vs. +1.3% (estimate)
Happy trading!
Tom