
EB Daily Market Report - Friday, June 18, 2021
Executive Market Summary
- Futures were down across-the-board overnight and selling pressure has continued throughout the day
- All 11 sectors are lower on the session, led by energy (XLE, -2.52%) and financials (XLF, -2.33%)
- Consumer discretionary (XLY, -0.70%) is holding up best as home construction stocks ($DJUSHB, +1.21%) are rebounding
- The 10-year treasury yield ($TNX) is down 6 basis points to 1.45%, matching its low from a week ago
- Cryptocurrencies are having another weak day, dropping mostly in the 5% to 7% range
- Commodity prices have mostly tumbled this week, though crude oil ($WTIC) remains close to $72 per barrel
- Caterpillar (CAT, +0.05%) is the only Dow Jones component stock in positive territory today; Goldman Sachs (GS, -3.27%) leads the financials lower
Market Outlook
The overall market was set up for weakness heading into options expiration Friday and that has not disappointed. The S&P 500, though volatile, has been mostly in a selling mood since the Fed announced its latest decision on Wednesday. Here's the latest look at the 60-minute chart:
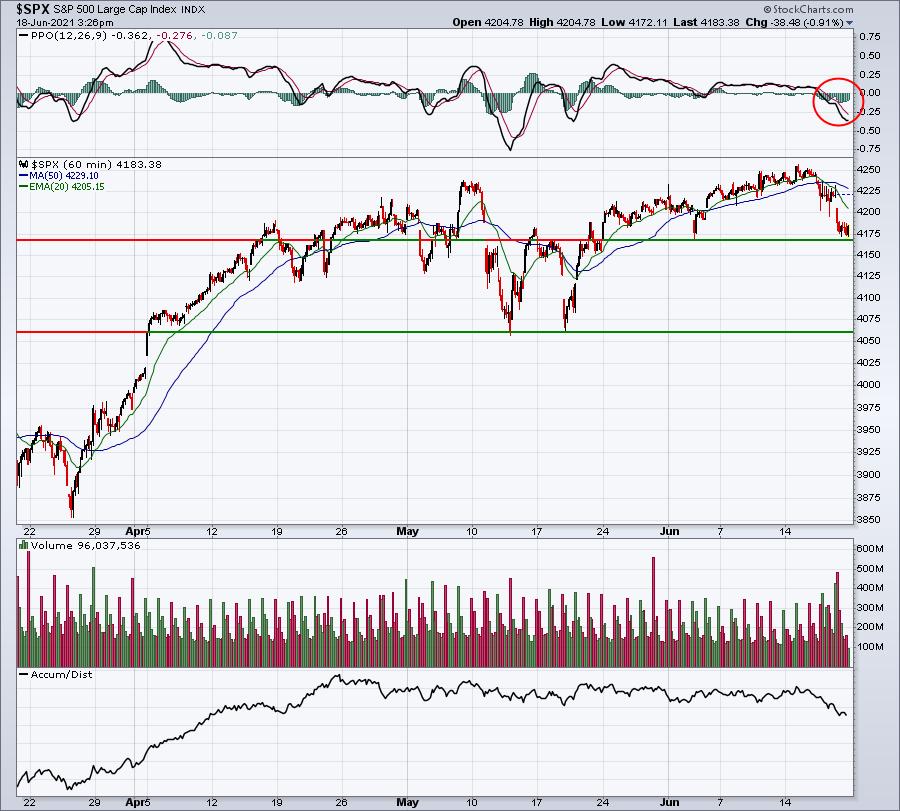
The early-June low of 4167.93 is the level I'd keep a close eye on as we move into today's close - and as we begin next week. Today's low was 4172.11. Do we have a double bottom, poised to make another advance higher? Or does the 4167 level fail to hold as support? Here's one other consideration. The 50-day SMA on the S&P 500 is 4182. So failure to hold that intraday low of 4167 would also be a violation of the 50-day SMA, something the S&P 500 has not seen since March 4th.
Sector/Industry Focus
It's a repeat of what I've been talking about lately, but growth stocks are quickly becoming the new theme once again. The IWF:IWD ratio is soaring in favor of growth stocks and this ratio is at 1.70 right now:
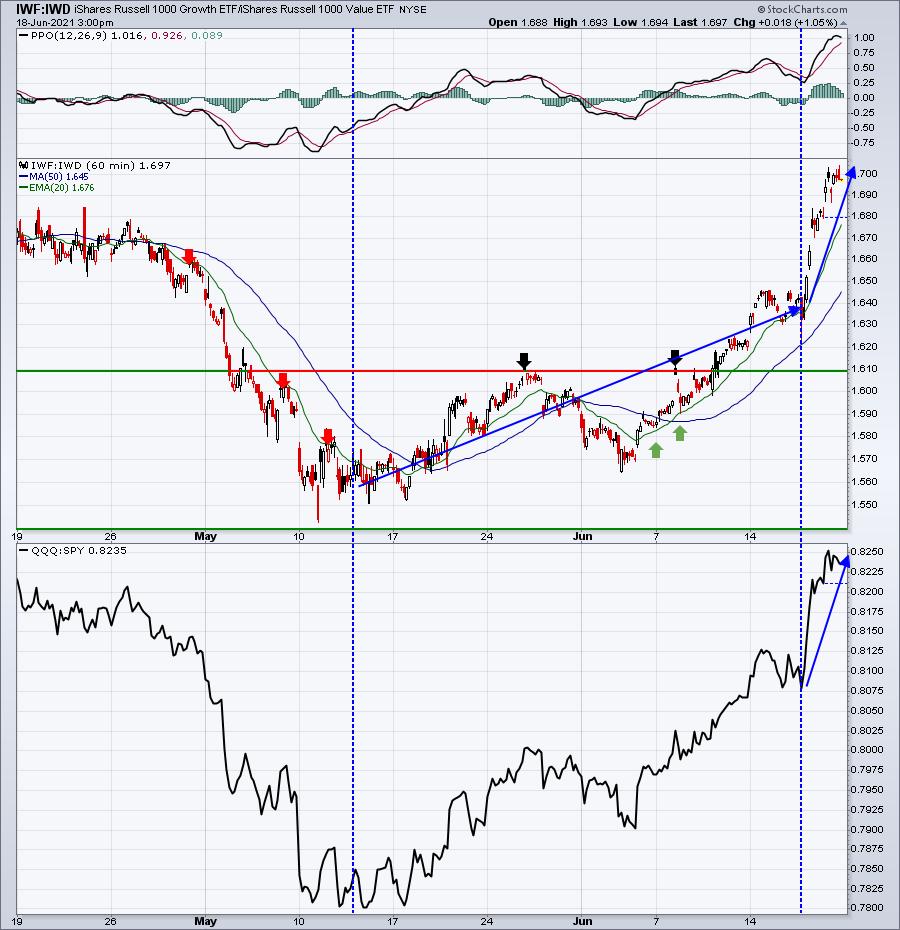
Growth stocks were already rising vs. value and the same goes with the QQQ vs. SPY (lower panel), but since the Fed's latest policy statement, the rise in both ratios has accelerated.
ChartLists/Strategies
Here is a potential trading candidate from 3 different ChartLists:
Strong Earnings ChartList -
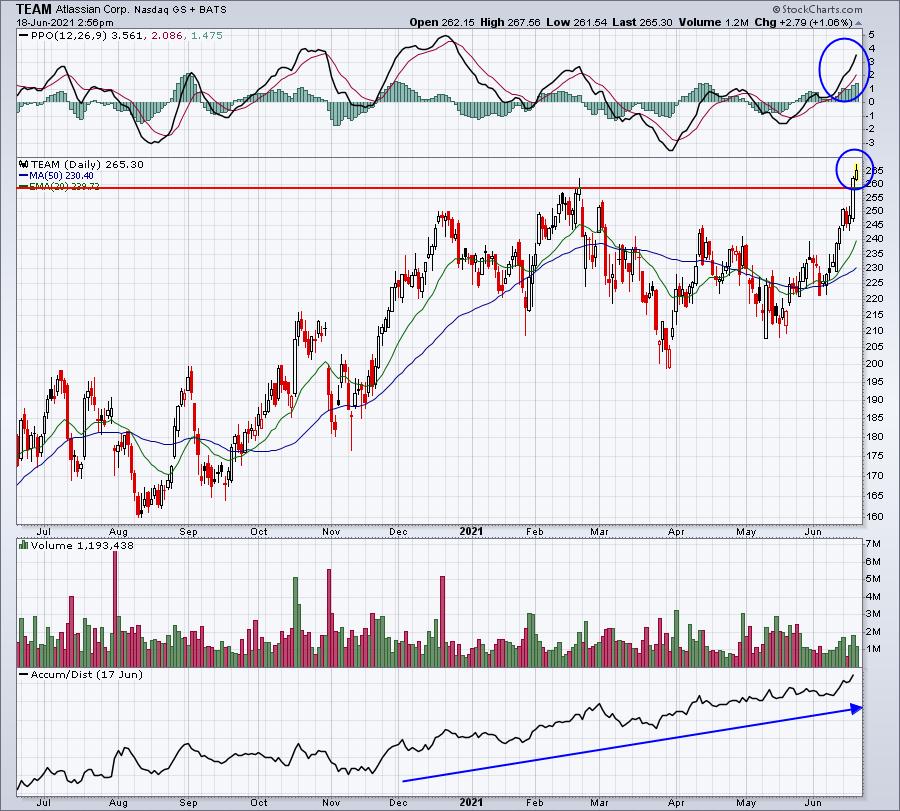
TEAM has confirmed a breakout and is continuing to push into new high territory. Its AD line has remained strong and is confirming the new price high. Bullish momentum is building, as evidenced by the rapidly-rising PPO.
Raised Guidance ChartList -
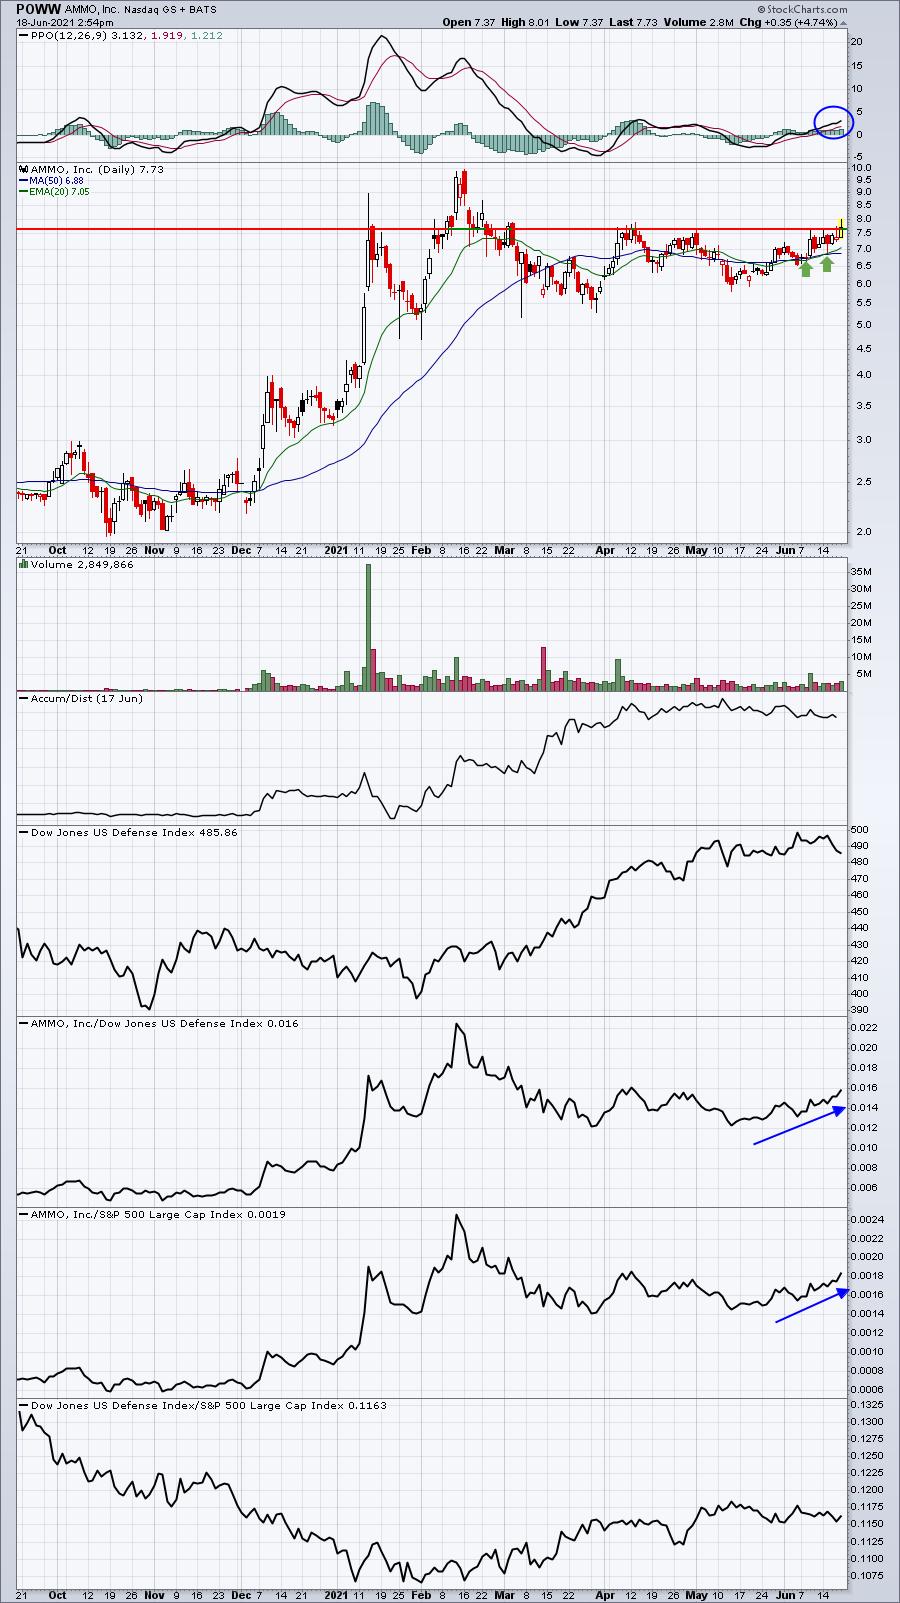
POWW has raised guidance multiple times and is trending up vs. its defense peers. The daily PPO is strengthening and the rising 20-day EMA is providing excellent support.
Short Squeeze ChartList - ASO:
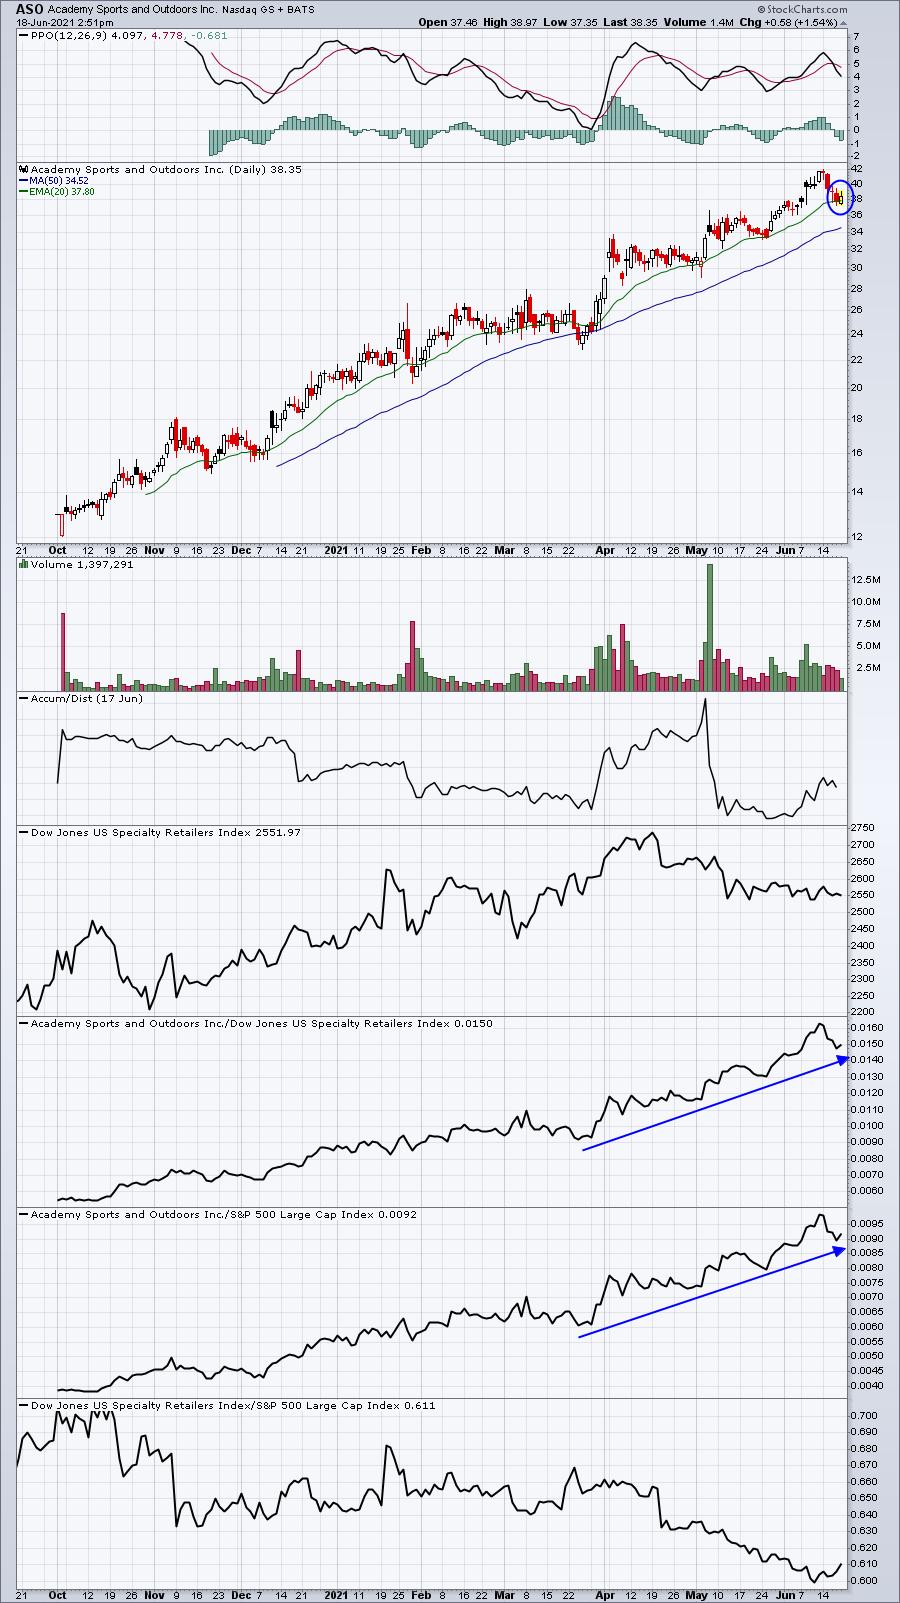
ASO has been a solid performer and its recent weakness has taken it back to test its rising 20-day EMA. Currently, there's a reversing piercing candle in play that suggests we'll see a rebound. I'd just be sure to keep a closing stop beneath this moving average.
Earnings Reports
Here are the key earnings reports for the next two days, featuring stocks with market caps of more than $10 billion. I also include a few select companies with market caps below $10 billion. Finally, any portfolio stocks that will be reporting results are highlighted in BOLD. If you decide to hold a stock into earnings, please understand the significant short-term risk that you are taking. Please be sure to check for earnings dates for any companies you own or are considering owning.
Friday, June 18:
None
Monday, June 21:
None
Economic Reports
None
Happy trading!
Tom