
EB Daily Market Report - Thursday, July 1, 2021
Executive Market Summary
- Futures were mixed overnight, but the Dow Jones has clearly had the upper hand
- Crude oil prices ($WTIC, +2.06%) have jumped to $75 per barrel, the highest level since Q4 2018
- Energy (XLE, +1.68%) is having another solid day, leading all sectors
- Technology (XLK, +0.00%) is flat and consumer staples (XLP, -0.25%) is the only sector in negative territory
- The 10-year treasury yield ($TNX) is up 3 basis points to 1.48% as this morning's weekly jobless claims came in well below expectations
- The S&P 500 leaderboard is littered with energy names - FANG (+6.01%) and OXY (+4.86%) were at the top
- The Dow Jones only had one stock with gains of greater than 2% and it was Nike (NKE, +2.09%), which has been on a heater since earnings
- Micron Technology (MU, -5.71%) fell after reporting quarterly results, dragging the entire semiconductor group ($DJUSSC, -0.94%) with it
Market Outlook
The NASDAQ has struggled the past couple trading sessions after a significant push higher throughout much of June. There was a negative divergence on the 60-minute chart that could be responsible for the relative weakness the past two days:
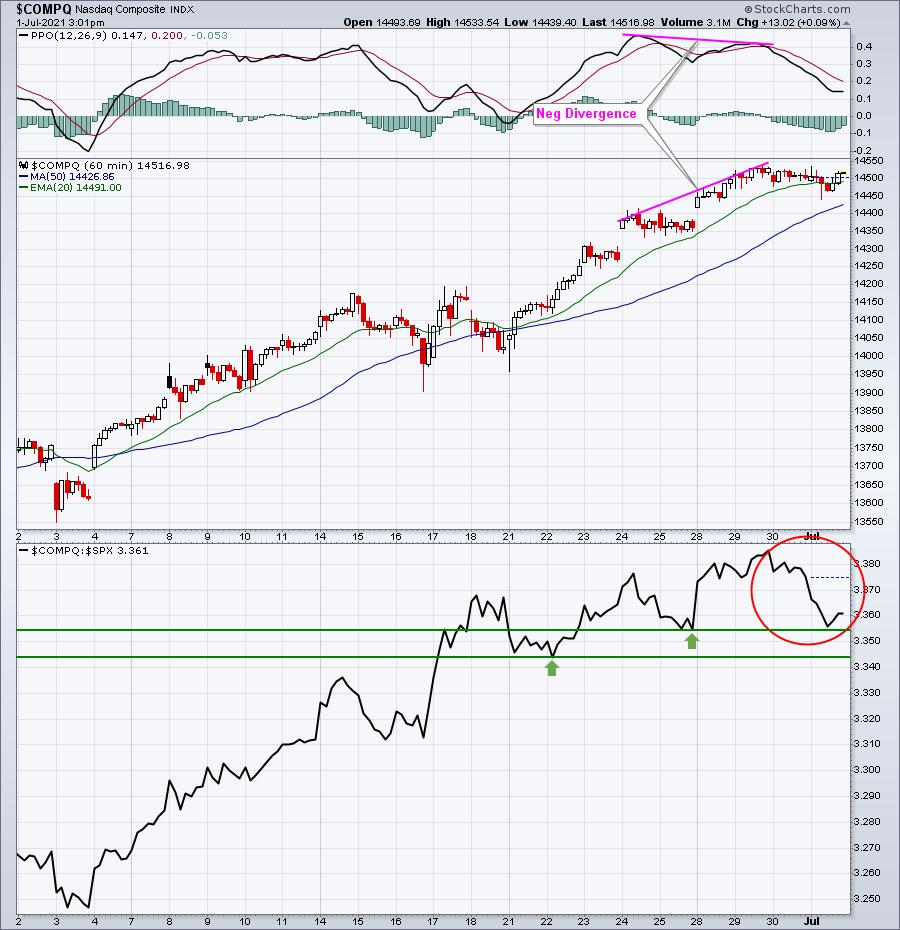
We're seeing the NASDAQ vs. S&P 500 ratio begin to turn up this afternoon. It'll be interesting to see if this continues into the close and to close out the week tomorrow.
Sector/Industry Focus
Restaurants ($DJUSRU) have been going along for the ride, moving to new highs throughout the year, just as the S&P 500 has done. But price support (green arrows) has held beautifully throughout and the daily PPO is as strong as it's been over the past six weeks:
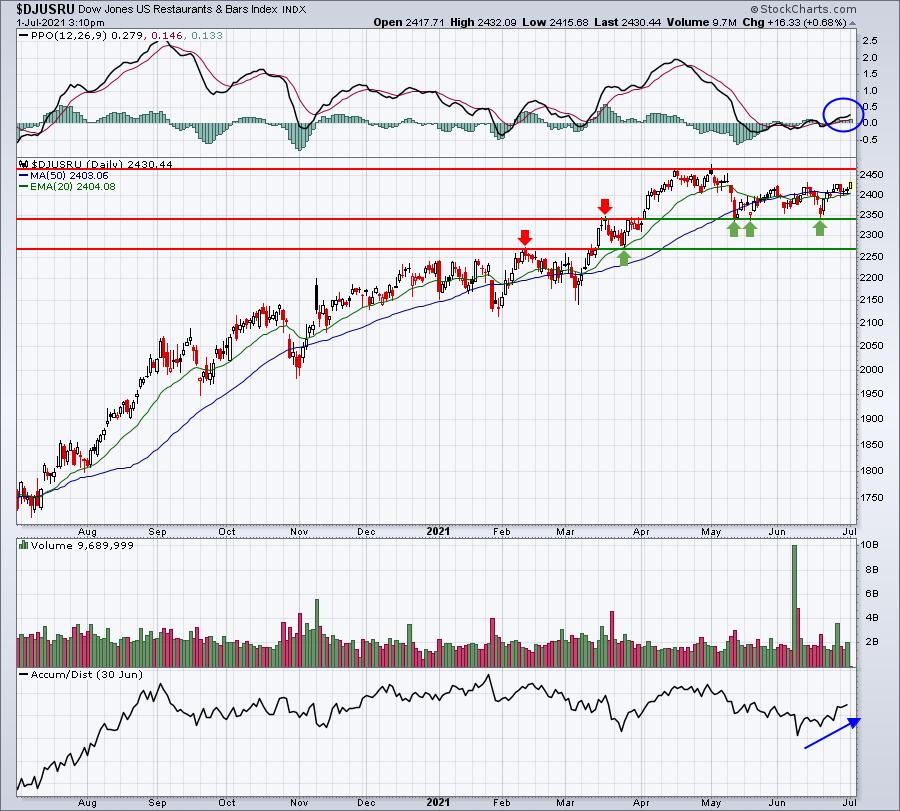
Also, volume has been strongest on up days and that's a sign of accumulation. The AD line has begun to rise over the past three weeks or so.
ChartLists/Strategies
QSR worked out nicely yesterday as a reversal candidate as it's up today. So I ran that Downtrend Reversal scan again and this was one of the stocks returned today:
EOLS:
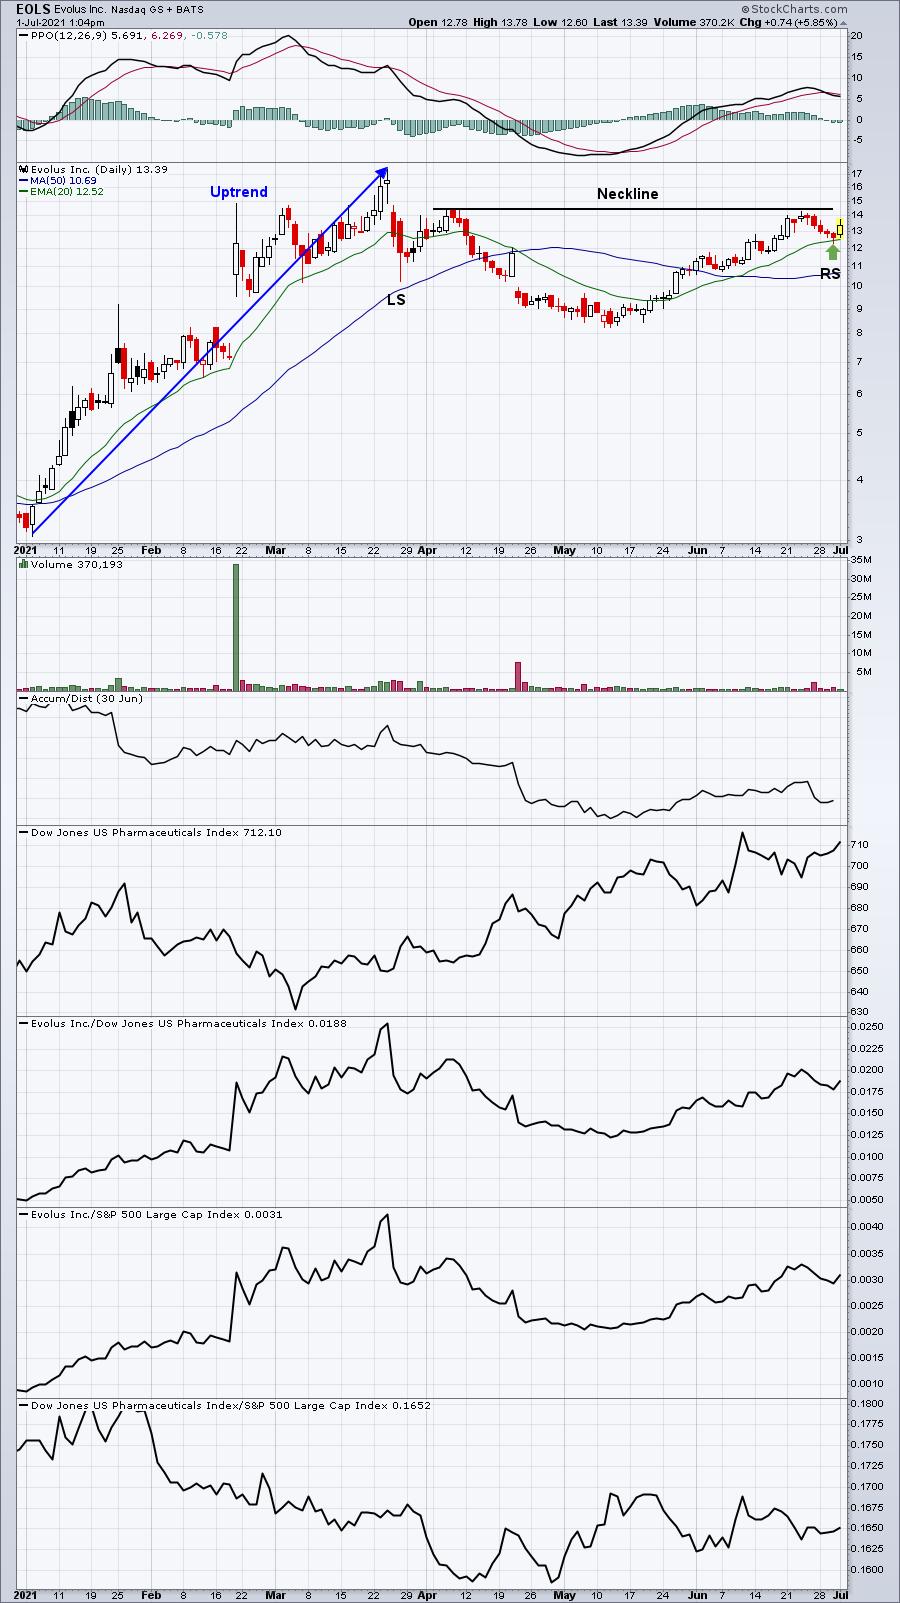
The inverse head & shoulders pattern is a bullish continuation pattern and today's bounce off the 20-day EMA could be marking that inverse right shoulder low.
Earnings Reports
Here are the key earnings reports for the next two days, featuring stocks with market caps of more than $10 billion. I also include a few select companies with market caps below $10 billion. Finally, any portfolio stocks that will be reporting results are highlighted in BOLD. If you decide to hold a stock into earnings, please understand the significant short-term risk that you are taking. Please be sure to check for earnings dates for any companies you own or are considering owning.
Thursday, July 1:
WBA, MKC, AYI, SMPL, LNN
Friday, July 2:
None
Economic Reports
Initial jobless claims: 364,000 (actual) vs. 395,000 (estimate)
June PMI manufacturing: 62.1 (actual) vs. 62.6 (estimate)
June ISM manufacturing: 60.6 (actual) vs. 61.0 (estimate)
Happy trading!
Tom