
EB Daily Market Report - Tuesday, July 6, 2021
2021 2nd Half Market Outlook Today
I hope you can join me after the market closes today at 4:30pm ET for our mid-year Market Outlook event. It's truly been a period that I'll never forget. I've never seen so much rotation over such short periods and we're seeing major rotation again today. What might that mean for the second half of the year? I'll give you my take later today.
Room instructions will be sent out later this afternoon.
Executive Market Summary
- Futures were tilted towards the Dow Jones overnight, but completely reversed this morning
- NASDAQ stocks have outperformed from the opening bell; all major indices are lower, but the the NASDAQ remains the best relative performer
- The Volatility Index ($VIX) has jumped 13% to 17.05 at last check; it hits its highest level (17.50) in two weeks earlier this morning
- Economic reports today pointed to slower economic growth, which has, in turn, sent treasury yields tumbling
- The 10-year treasury yield ($TNX) is down 6 basis points to 1.37%, its lowest level since February
- Growth stocks (IWF, +0.08%) are crushing value stocks (IWD, -1.21%) and the IWF:IWD ratio has soared to touch 1.75 - also a level not seen since February
- The dollar (UUP) is rising, pressuring energy (XLE, -2.75%) and materials (XLB, -1.62%) on a relative basis
- Technology (XLK, +0.11%), benefiting from the shift to growth stocks, has joined real estate (XLRE) as the best performing sectors
- Amazon.com (AMZN) is in breakout territory and is quite bullish if it holds above 3600 into the close
Market Outlook
I've never seen rotation like this. It's been violent and fairly sudden, although I've highlighted on several occasions the recent shift from value to growth as the IWF:IWD ratio has been trending higher. To visualize how severe this rotation has been, let's look at the relative strength of the aggressive sectors since the pandemic began:
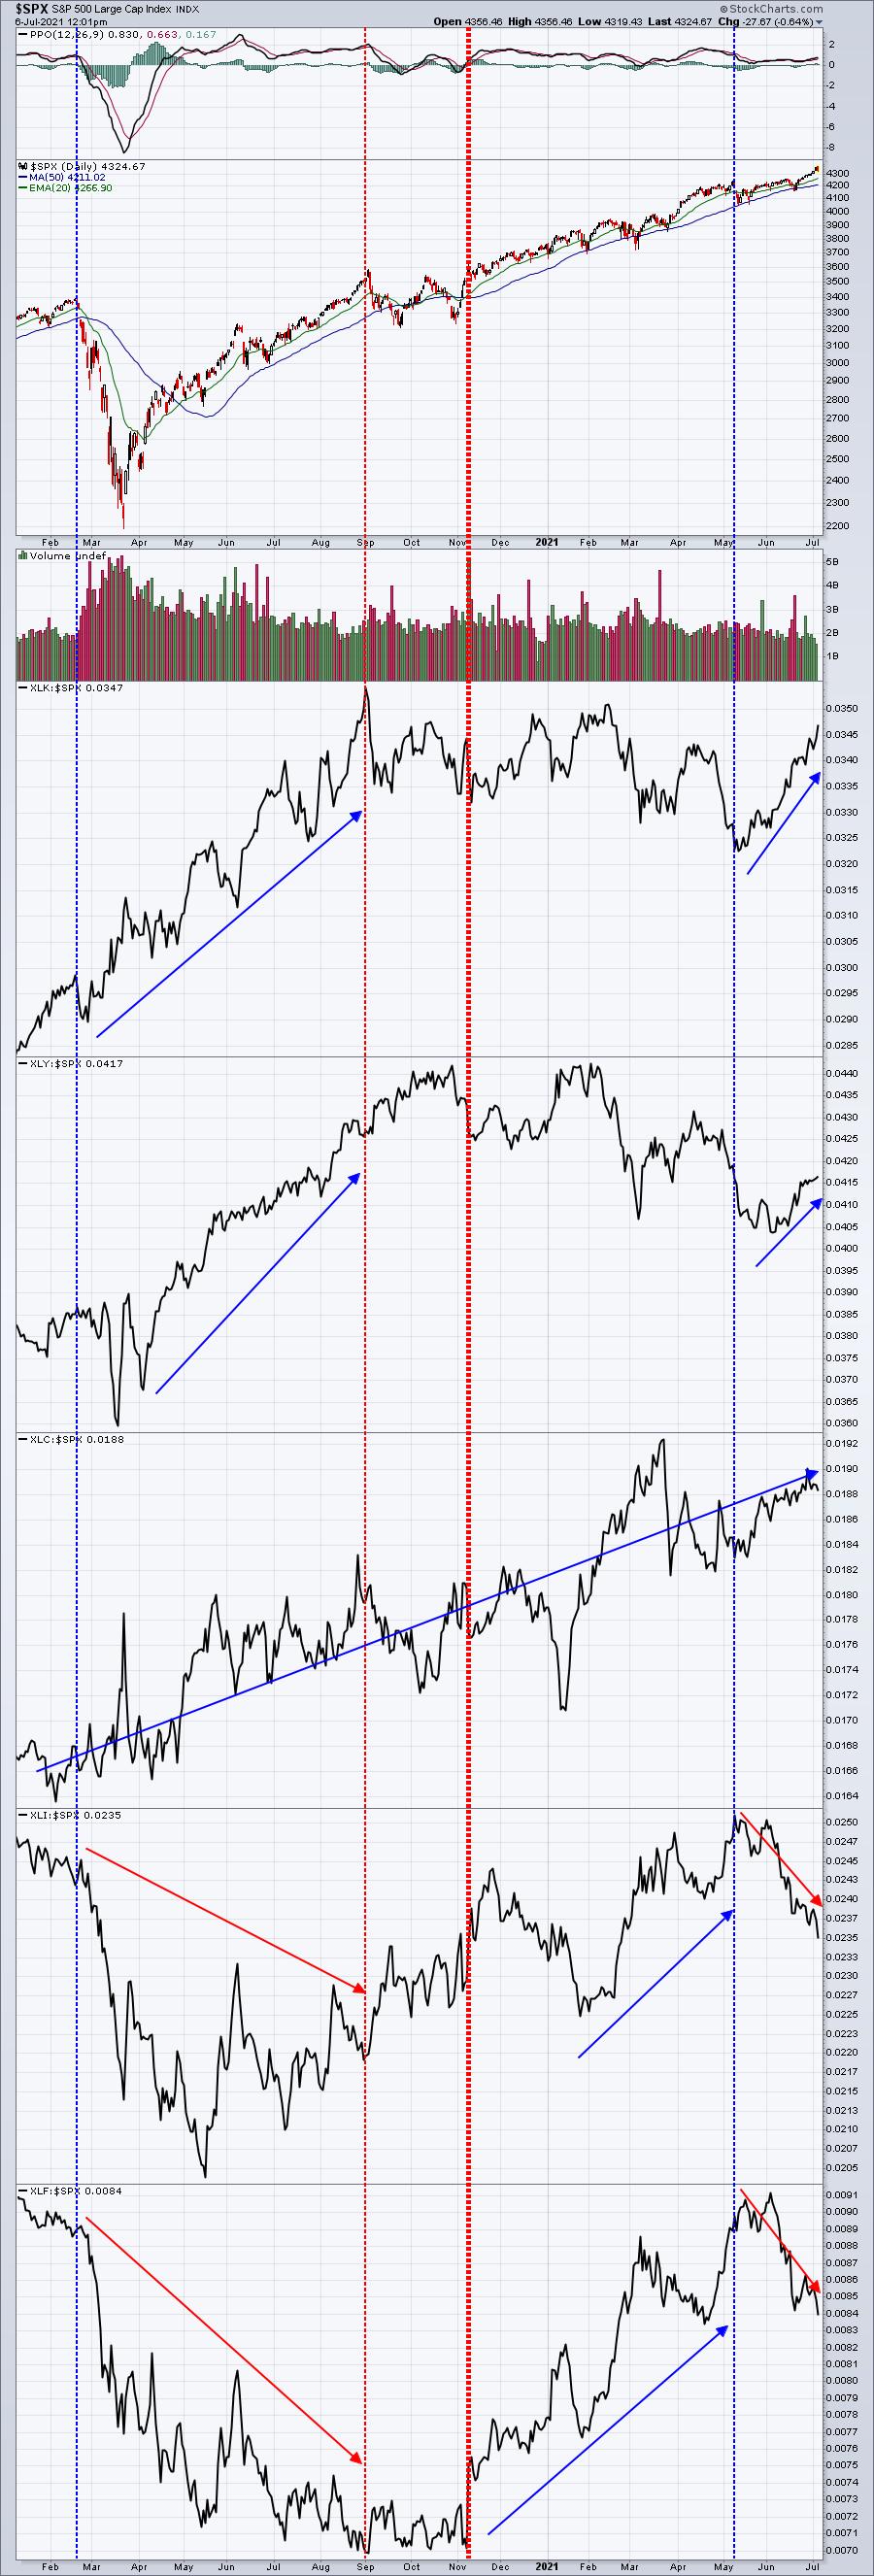
The really bullish news is that the S&P 500 seems undeterred by what leads, it just keeps pushing higher as money rotates. Technology (XLK) and consumer discretionary (XLY) have had their moments of excellent relative strength.....and then the proverbial carpet's been pulled out from under them. Now they're both moving higher again on a relative basis, but is it just because of upcoming earnings or should we expect this more intermediate-term. My educated guess is that we'll continue to see relative strength at least into August. The XLY seems to have a lot of catching up to do and its largest holding is Amazon.com (AMZN) at 23.15%. AMZN is attempting a major breakout today and that would help the XLY play catch up immensely.
Meanwhile, communication services (XLC) keeps strumming along, no matter the market environment. As treasury yields have rolled over the past month, though, financials (XLF) and industrials (XLI) have felt significant negative effects in terms of relative performance.
Sector/Industry Focus
I've repeatedly discussed the materials sector (XLB, -1.80%) and the fact that its long-term relative downtrend remain intact vs. the benchmark S&P 500. Accordingly, I had little faith that the sector's leadership role in 2021 would continue. The absolute chart is definitely broken and relative strength has been under pressure since rotation began back in the second week of May:
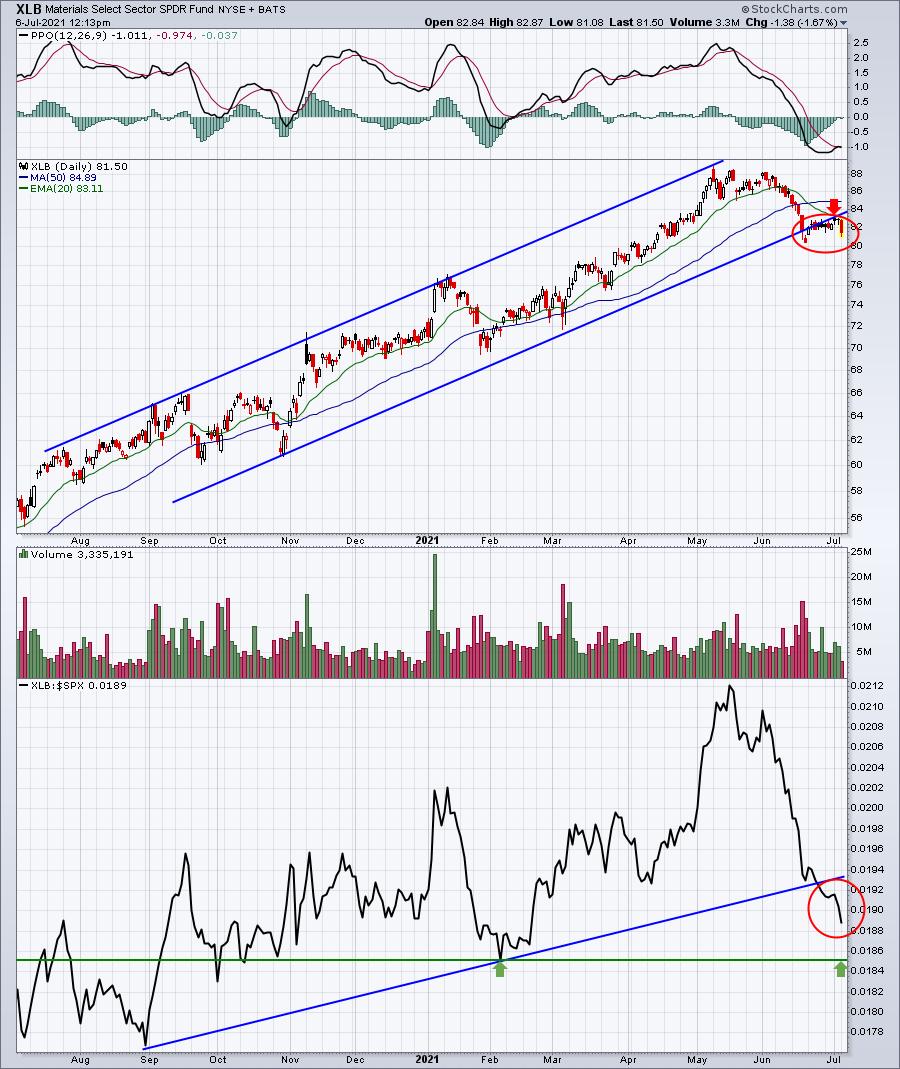
The biggest factor as to whether we see relative strength in energy (XLE) and materials (XLB) over the next 6-12 months will be the direction of the U.S. Dollar Index ($USD). I believe the USD will move higher, limiting the potential of leadership for these two sectors. That's just my opinion. If I'm wrong and the dollar weakens, that would provide a much more bullish backdrop for the XLE and XLB.
ChartLists/Strategies
As I literally watch the NASDAQ accelerate to the downside in the past 30 minutes or so, it suggests that perhaps we wait until this afternoon's Market Outlook event to address the stocks that could provide leadership during the second half of the year. My "gut" tells me that pullbacks on leading growth stocks is the correct path forward, but we'll discuss this more later.
Earnings Reports
Here are the key earnings reports for the next two days, featuring stocks with market caps of more than $10 billion. I also include a few select companies with market caps below $10 billion. Finally, any portfolio stocks that will be reporting results are highlighted in BOLD. If you decide to hold a stock into earnings, please understand the significant short-term risk that you are taking. Please be sure to check for earnings dates for any companies you own or are considering owning.
Tuesday, July 6:
None
Wednesday, July 7:
MSM, WDFC
Economic Reports
June PMI composite: 63.7 (actual) vs. 64.0 (estimate)
June ISM services: 60.1 (actual) vs. 63.5 (estimate)
Happy trading!
Tom