
EB Daily Market Report - Wednesday, July 7, 2021
Executive Market Summary
- Futures were mostly higher, though the Dow Jones did initially begin the day in negative territory
- For the third straight session, money rotated into growth vs. value (IWF:IWD) and the NASDAQ vs. the S&P 500 (QQQ:SPY) in the first couple hours
- That IWF:IWD ratio hit 1.76, distancing itself from 1.70 support; the all-time high was set in September 2020 at 1.92
- The 10-year treasury yield ($TNX) is down another 5 basis points to 1.32%, fueling the rotation to growth
- Energy (XLE, -1.61%) is clear laggard today as crude oil ($WTIC) has reversed hard since reaching its $77 per barrel measurement (more on this below); WTIC is down 1.87% to $72 per barrel today
- Meanwhile, materials (XLB, +0.83%) is bouncing after a rough day on Tuesday - today's gain comes despite another rise in the dollar (UUP, +0.12%), which is at a 3-month high
- Steel ($DJUSST, +3.41%) is helping to lift materials, but has yet to negotiate its now-declining 20-day EMA
- Apple (AAPL, +1.58%) is threatening to break to an all-time high and is the best performing Dow Jones stock
- Boeing (BA, -1.89%) is holding back this index of conglomerates, however
- Semiconductors ($DJUSSC, -1.50%) is seeing about of profit taking today with both AMD and NVDA lower
Market Outlook
An interesting question is whether the U.S. or the world excluding the U.S. leads the next phase of the global secular bull market. I like the chances of the U.S. and the chart below illustrates why:
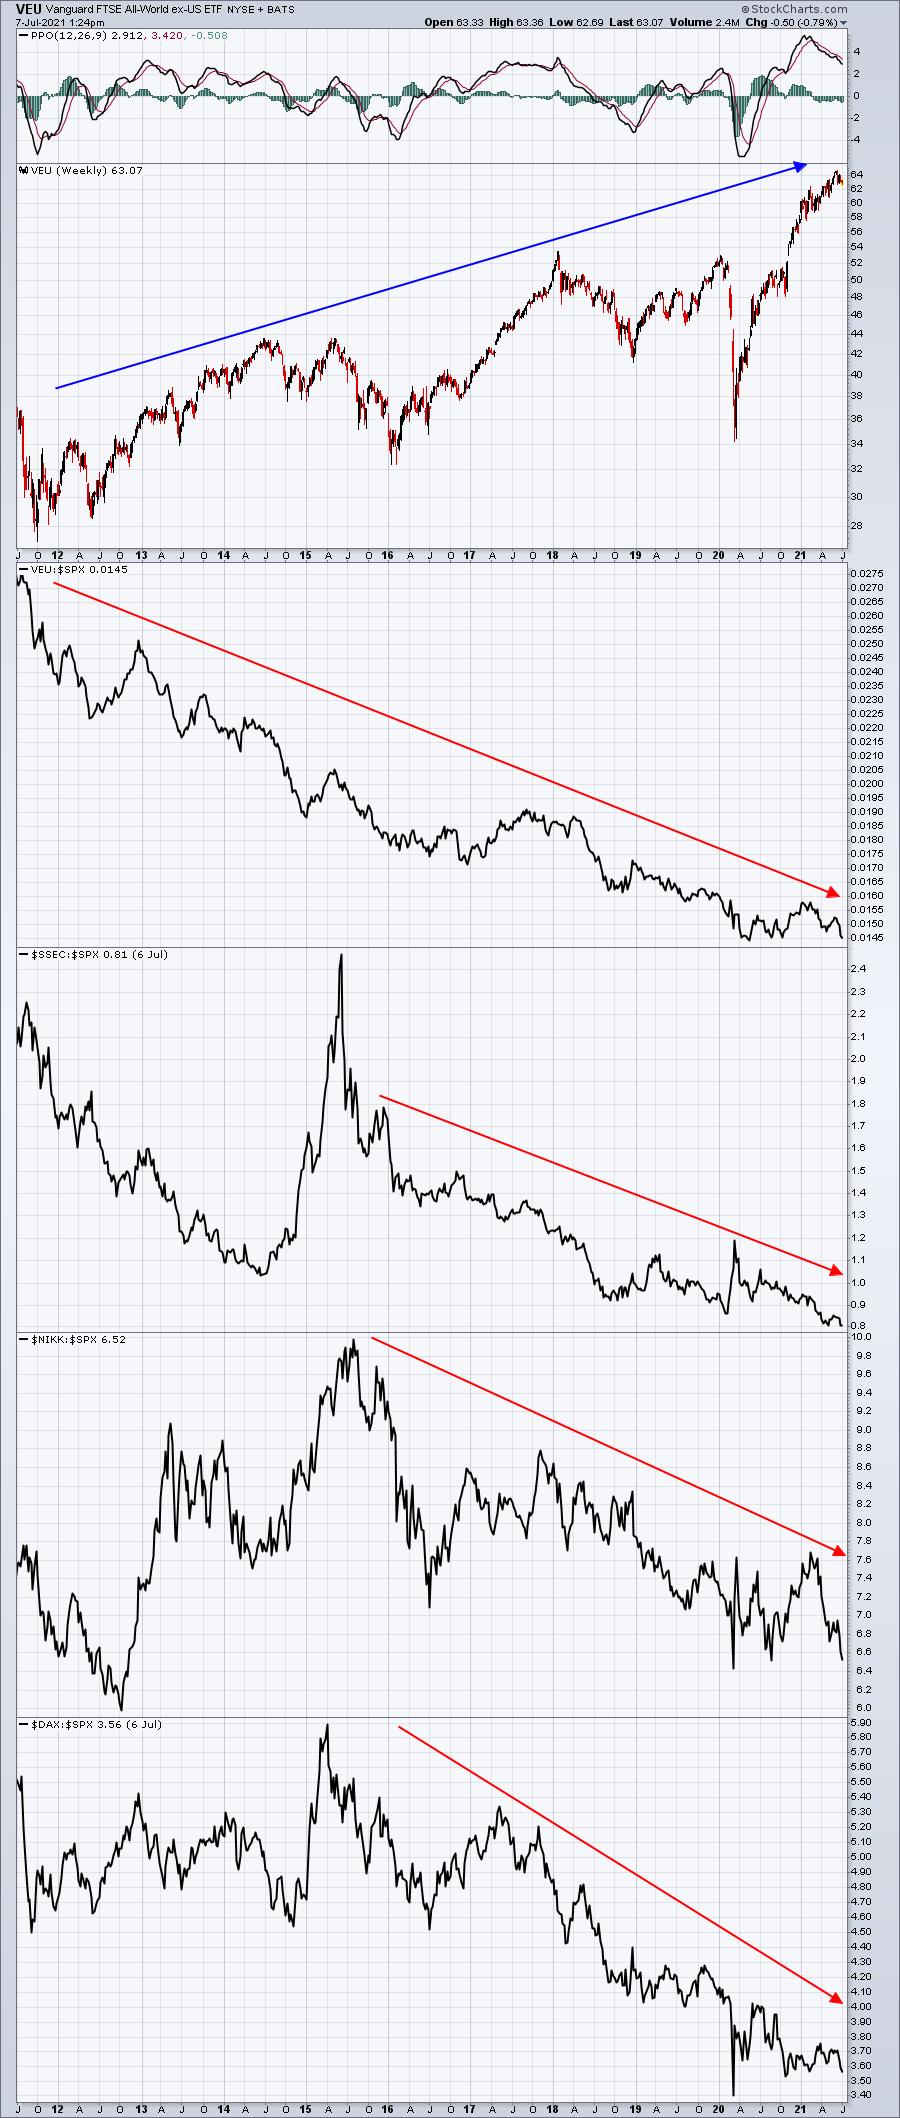
The top chart highlights the Vanguard All-World (excluding the U.S.). If you didn't have the ability to review relative strength charts, the absolute chart of the VEU looks quite compelling as an alternative to investing in the S&P 500. But the four charts below it highlight the significant relative underperformance of each major global market featured over the past decade. Do you want to place a bet that global markets are poised to outperform the U.S. based on current technical conditions?
Yeah, me neither.
Sector/Industry Focus
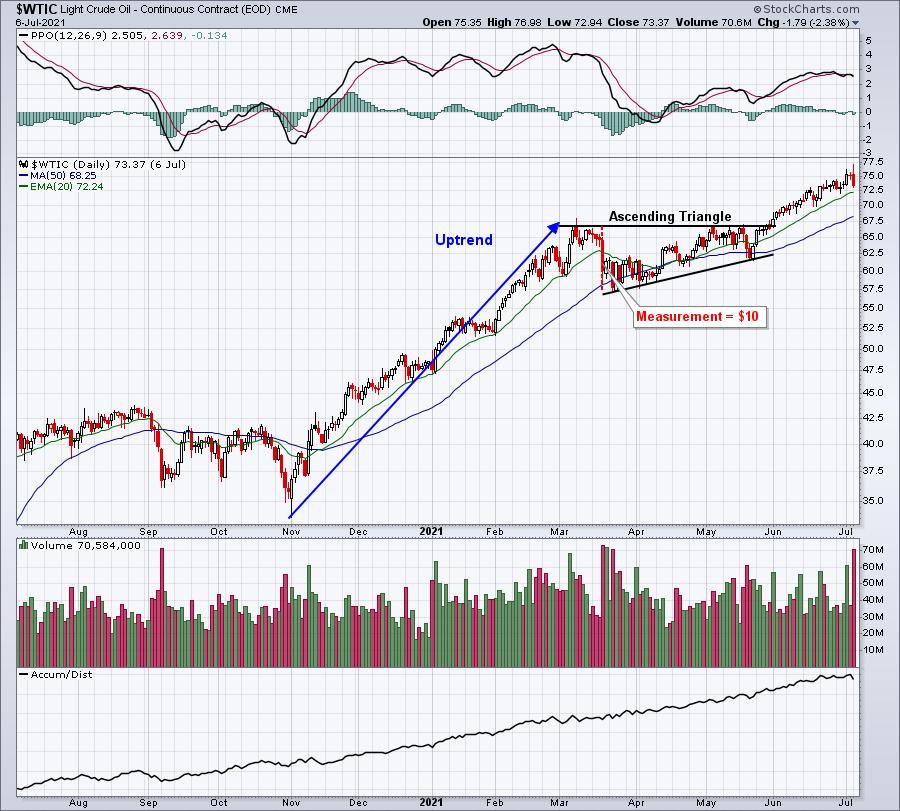
Energy (XLE, -1.61%) is having another rough session and is threatening to close beneath its 50-day SMA for the first time since late-April. I view the current action as nothing more than consolidation. We should first recognize that West Texas Intermediate Crude ($WTIC) reached its bullish continuation ascending triangle pattern measurement to $77 per barrel:
Also, as a refresher, the WTIC had significant overhead resistance at the $77 measurement level:
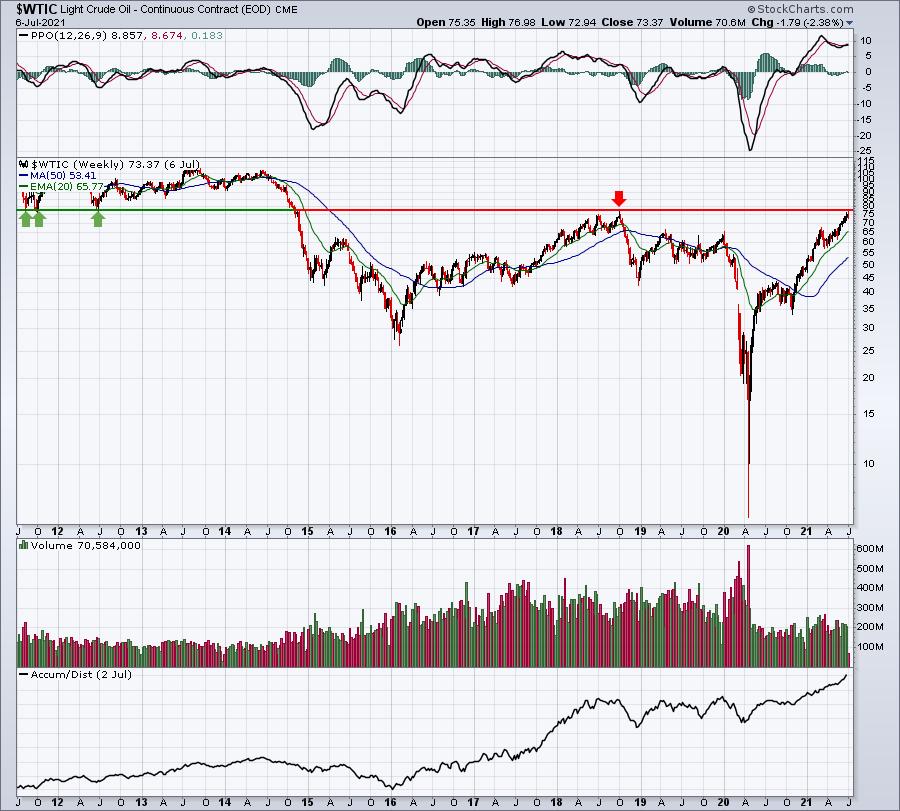
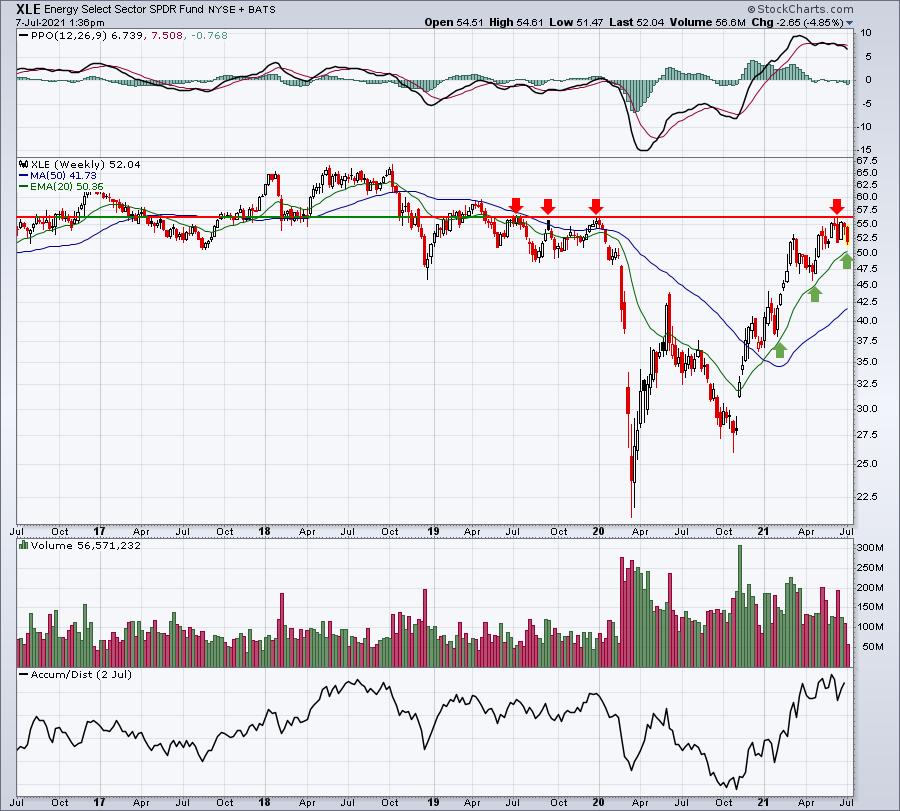
This is an area where we need to be extremely careful with energy. If it breaks out above $77 per barrel, then the XLE is likely full-speed ahead. If it serves as key resistance and oil prices back off of it, we may have seen a top in the XLE. This potential top would also line up with key overhead price resistance on this ETF:
ChartLists/Strategies
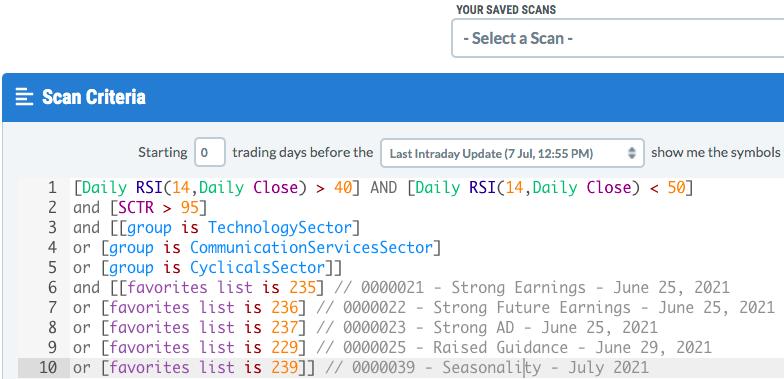
Today I ran an RSI 40-50 scan, with a filter to only look for stocks within technology (XLK), consumer discretionary (XLY), and communication services (XLC), which is where we'll find most growth stocks. The RSI 40-50 filter guarantees us that we'll not be chasing stocks. I then added a filter for SCTR scores > 95. This ensures that we're also looking at stocks that are very strong on a relative strength basis. Here's the scan syntax I used:
7 stocks were returned as follows:
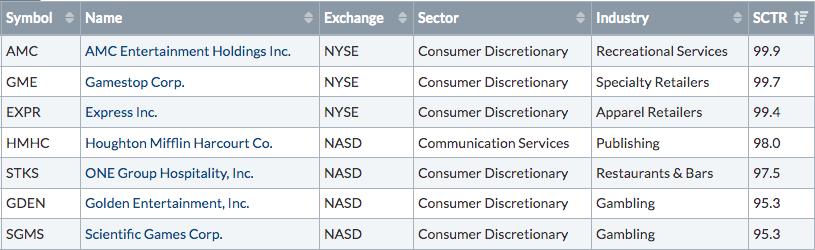
When I lowered the SCTR requirement from > 95 to > 90, the number of stocks returned rose from 7 to 22. From the original list of 7, I liked STKS as it's very close to key price support. When I expanded my search and I looked at the 22 stocks, I'd also add CONN as a solid reward-to-risk trading candidate. Here are those two charts:
STKS:
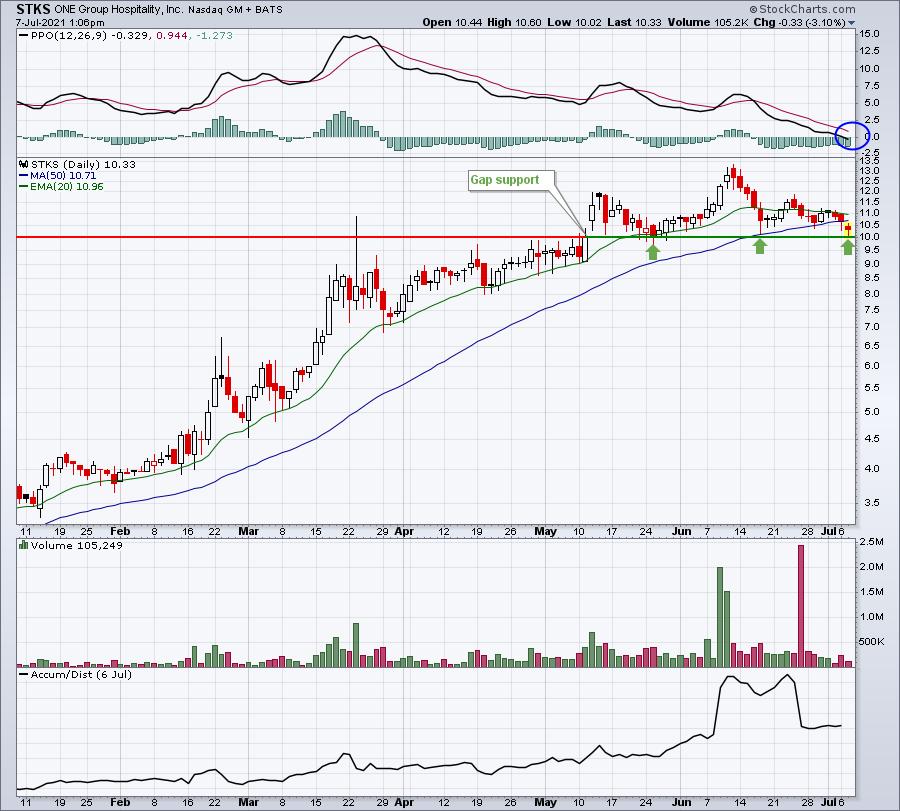
Gap support was tested earlier today and it's been holding successfully for the past two months. The daily PPO has fallen back to centerline support. A new uptrend certainly could begin from this area.
CONN:
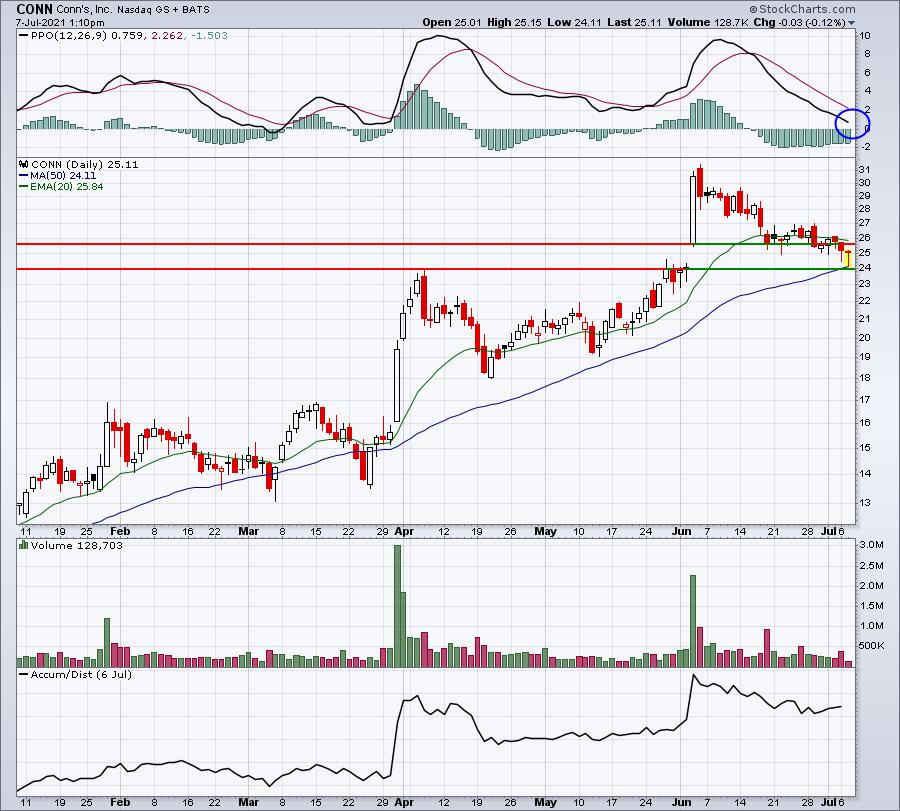
CONN has solid gap support in the 24.00-25.50 area, which is currently being tested. Also, the daily PPO is working its way back to a centerline test.
Obviously, the objective of this scan is to catch strong stocks in a pullback with solid reward-to-risk credentials. An RSI reading between 40 and 50 eliminates the possibility of buying an overbought stock. Like any other trading strategy, it doesn't guarantee a favorable trade, it's simply a different strategy that might be appealing to those traders who avoid chasing stocks in uptrends.
Earnings Reports
Here are the key earnings reports for the next two days, featuring stocks with market caps of more than $10 billion. I also include a few select companies with market caps below $10 billion. Finally, any portfolio stocks that will be reporting results are highlighted in BOLD. If you decide to hold a stock into earnings, please understand the significant short-term risk that you are taking. Please be sure to check for earnings dates for any companies you own or are considering owning.
Wednesday, July 7:
MSM, WDFC
Thursday, July 8:
LEVI, DCT, HELE, ACCD
Economic Reports
FOMC minutes released at 2:00pm ET
Happy trading!
Tom