
EB Daily Market Report - Friday, July 9, 2021
Executive Market Summary
- Futures were strong overnight and favored the Dow Jones and S&P 500
- Small caps ($SML, +2.60%) and mid caps ($MID, +2.13%) have outperformed their larger cap counterparts
- Financials (XLF, +2.87%), materials (XLB, +2.03%), and energy (XLE, +2.01%) are today's best performing sectors
- Defensive groups lag, though all 11 sectors are higher on the session
- Crude oil prices ($WTIC, +2.37%) are back on the rise, nearing $75 per barrel, aiding energy names
- Meanwhile, weakness in the U.S. dollar (UUP, -0.26%) is also helping both energy and materials, the latter of which is trying to clear its 20-day EMA (more on this below)
- The Dow Jones is approaching 35000 again and threatening to close at its all-time high, set on July 2nd at 34,786
- Only 3 Dow Jones component stocks are down today with the financial names - JPM, GS, TRV - leading
- Aluminum ($DJUSAL, +6.13%) and nonferrous metals ($DJUSNF, +5.35%) are leading materials higher
Market Outlook
The 60-minute negative divergence on the S&P 500 has been resolved. We saw a centerline test (pink arrow below) and now this benchmark index is back in all-time high territory. First, let's look at that hourly chart:
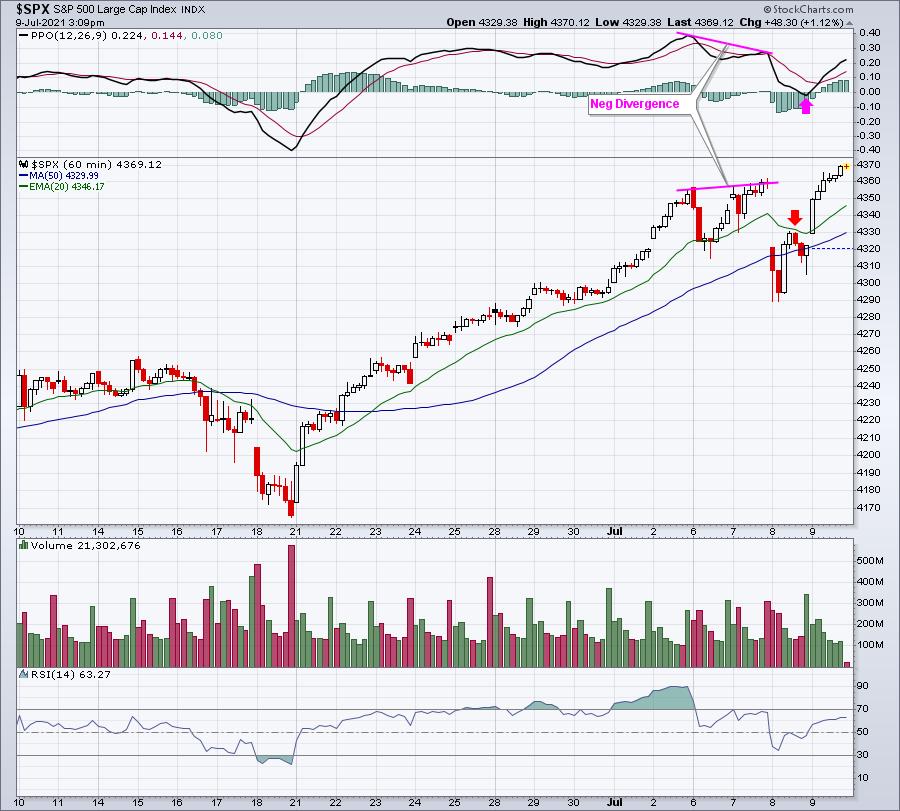
I had marked a red arrow on the 20-hour EMA, indicating that we'd need to move back through that level to support the theory that we were simply seeing a slight pullback in an uptrending market. We got that at the opening bell today and this breakout is absolutely supported by a strong PPO on the daily chart:
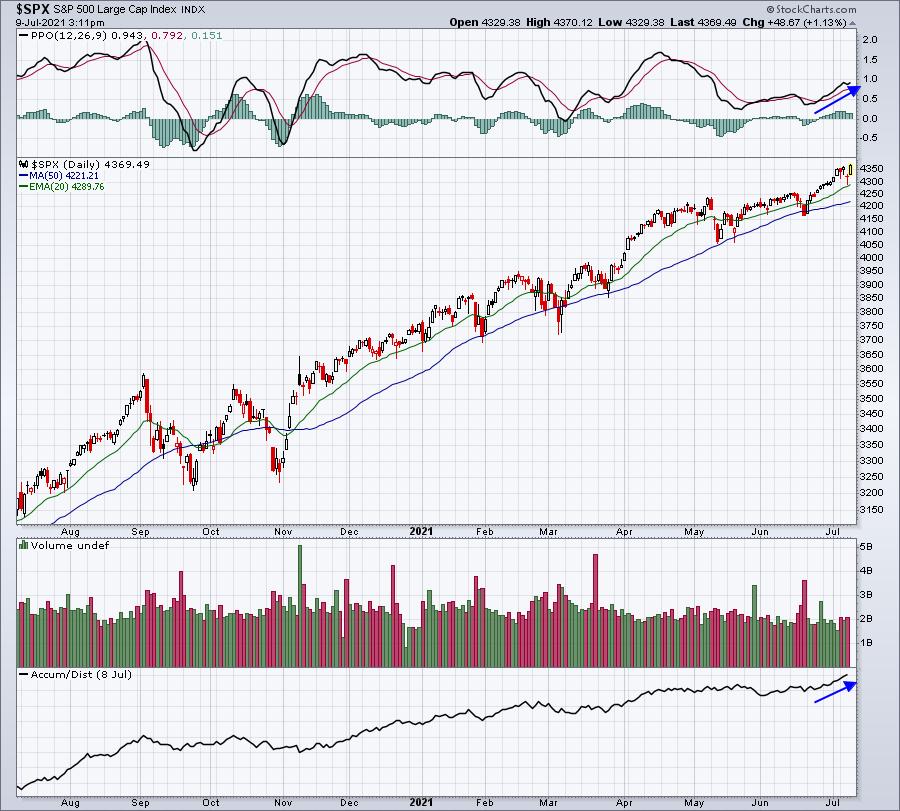
The AD line continues to strengthen as well. This pre-earnings advance seems like it still has legs, with roughly one week of historical bullishness left. As a reminder, the WORST historical period of the year runs from the July 17th close to the September 27th close. We don't always see lower prices during this period, but it does tend to be the weakest stretch of the year.
Sector/Industry Focus
Materials (XLB) is bouncing solidly today, challenging both overhead price resistance and its now-declining 20-day EMA:
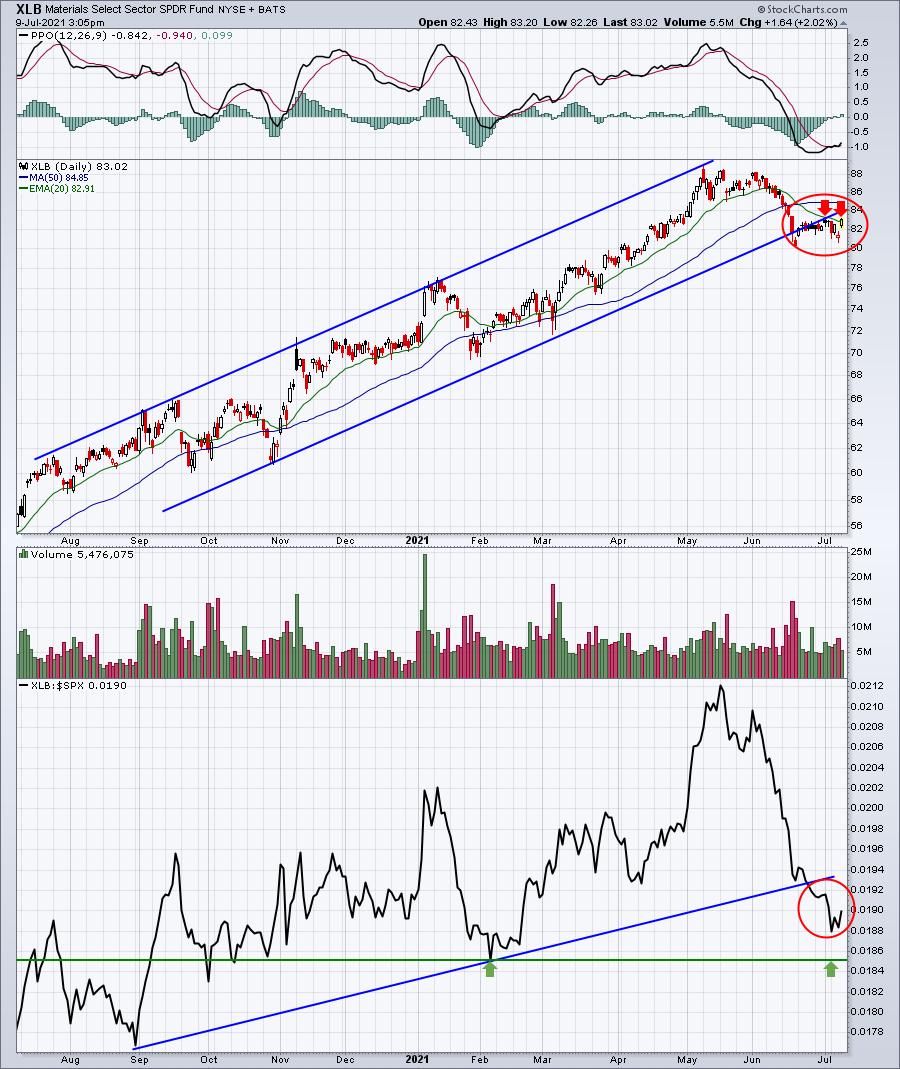
A close above 83.00 today would represent a breakout above both resistance levels discussed. While that, by itself, wouldn't suggest the selling is over, it would be the first step in repairing the technical damage from the past two months.
ChartLists/Strategies
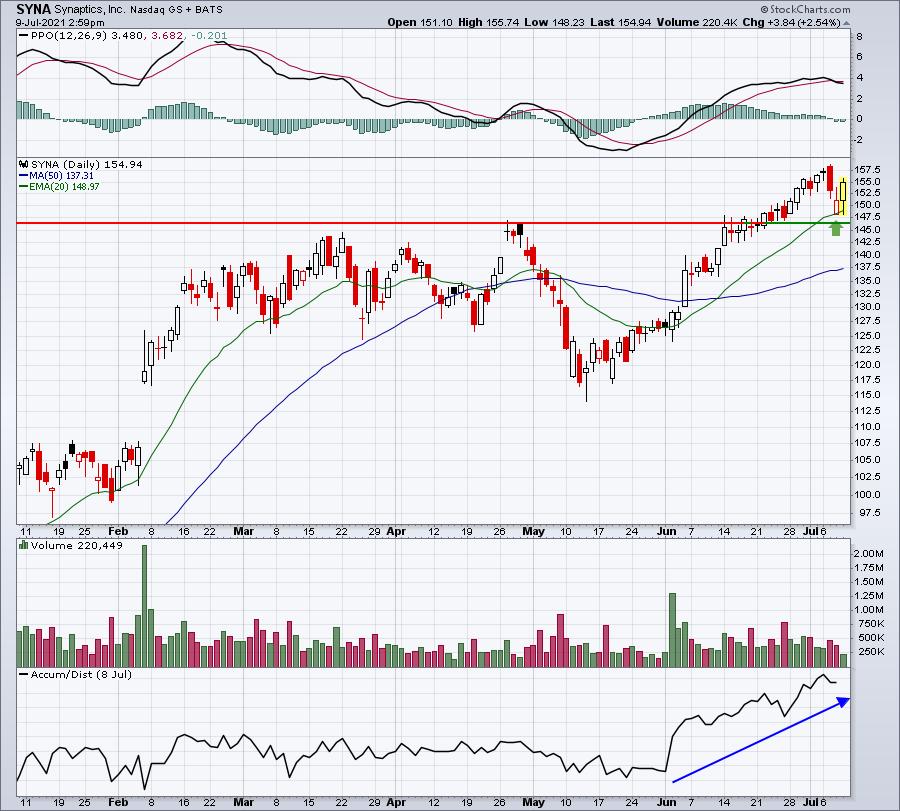
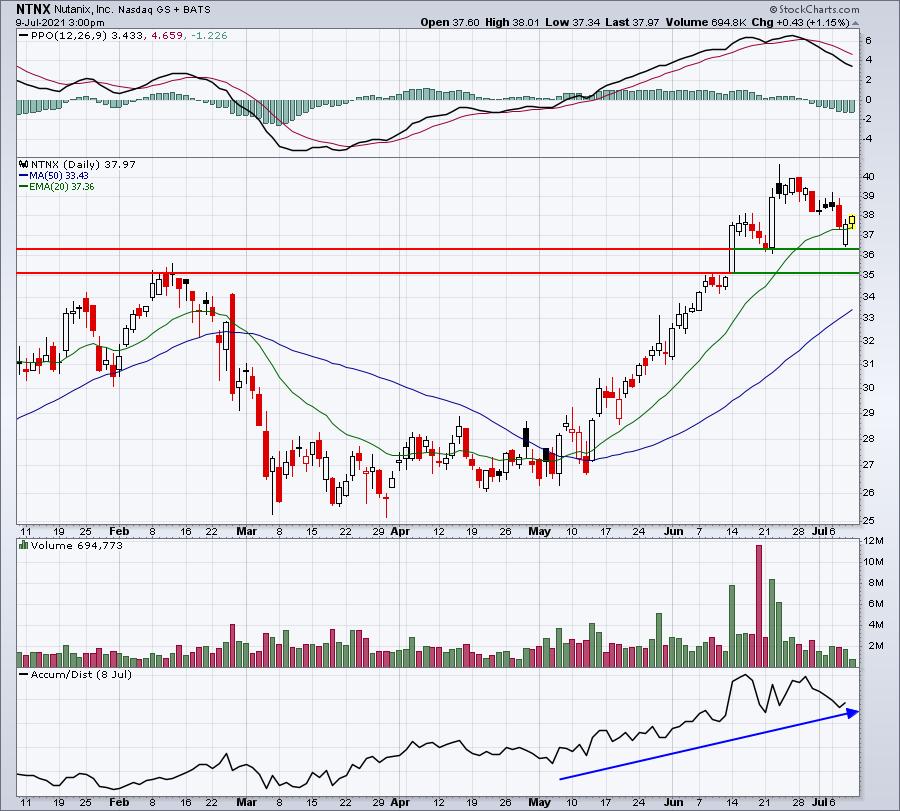
Let's review a few charts where price action has moved lower to test rising 20-day EMAs:
SYNA:
NTNX:
APO:
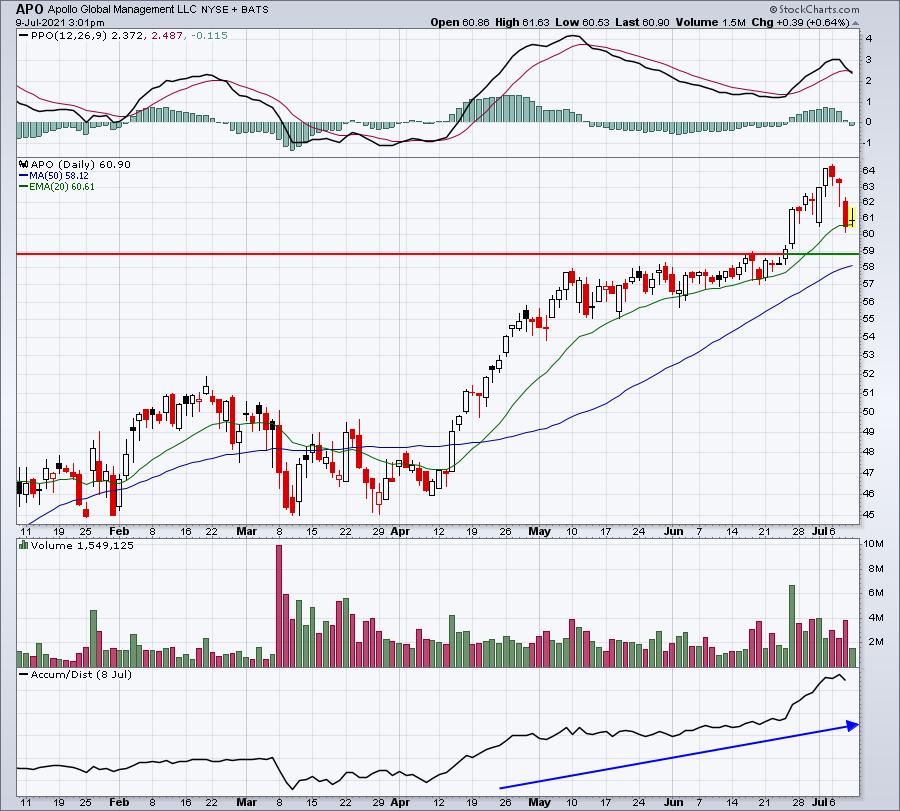
I see two key similarities on these three charts. First, all three have very solid AD lines in the bottom panel. Second, the most recent price high was accompanied by a PPO high as well. In other words, I don't see any negative divergences, or signs of slowing momentum. If there are no negative divergences, I think the odds are greater that a stock will bounce from its 20-day EMA test.
Earnings Reports
Here are the key earnings reports for the next two days, featuring stocks with market caps of more than $10 billion. I also include a few select companies with market caps below $10 billion. Finally, any portfolio stocks that will be reporting results are highlighted in BOLD. If you decide to hold a stock into earnings, please understand the significant short-term risk that you are taking. Please be sure to check for earnings dates for any companies you own or are considering owning.
Friday, July 9:
GBX, AZZ
Monday, July 12:
SLP
Economic Reports
None
Happy trading!
Tom