
EB Daily Market Report - Wednesday, July 14, 2021
ChartList Updated
The Raised Guidance ChartList (RGCL) has been updated and is now available for download and/or viewing.
Executive Market Summary
- Futures were higher today, rebounding from the selloff yesterday afternoon
- Our major indices do appear to be rolling over, however, so short-term caution is suggested
- Options expire on Friday and we know that there's financial incentive for short-term selling
- Technology (XLK) showed leadership early, but has now started to sell a bit
- Leading sectors include utilities (XLU, +1.01%), real estate (XLRE, +0.94%), and consumer staples (XLP, +0.59%) - three defensive groups
- Crude oil ($WTIC) has lost nearly 4% today as the recent high near $77 per barrel looms as a significant top
- Energy (XLE, -2.00%) is today's worst performing sector, no doubt tied to falling crude prices
- Banks ($DJUSBK, -0.86%) are struggling despite a series of better-than-expected earnings reports from the big banks the past two days
Market Outlook
For the second consecutive day, we've seen a blazing-hot inflationary report for June. Yesterday, it was at the consumer level (CPI), while today it's the producer price index (PPI). The reaction in the bond market is one great big collective yawn. The 10-year treasury yield ($TNX) is down more than 4 basis points to 1.37%, reversing most of its gain on Tuesday. Wall Street is screaming "there's NO inflation problem!" That's being confirmed by the fact that technology (XLK, +0.85%) is leading all sectors for a second straight day. These high growers would normally be crushed with inflationary fears as it eats away at real future growth rates.
That's not the problem.
I'm a little concerned about the market near-term, because earnings season is now beginning to accelerate. We know the stock market operates on a "buy on rumor, sell on news" mentality. Perhaps we have a bit further to go, but the Volatility Index - CBOE NASDAQ 100 ($VXN) is moving higher as NASDAQ 100 ($NDX):
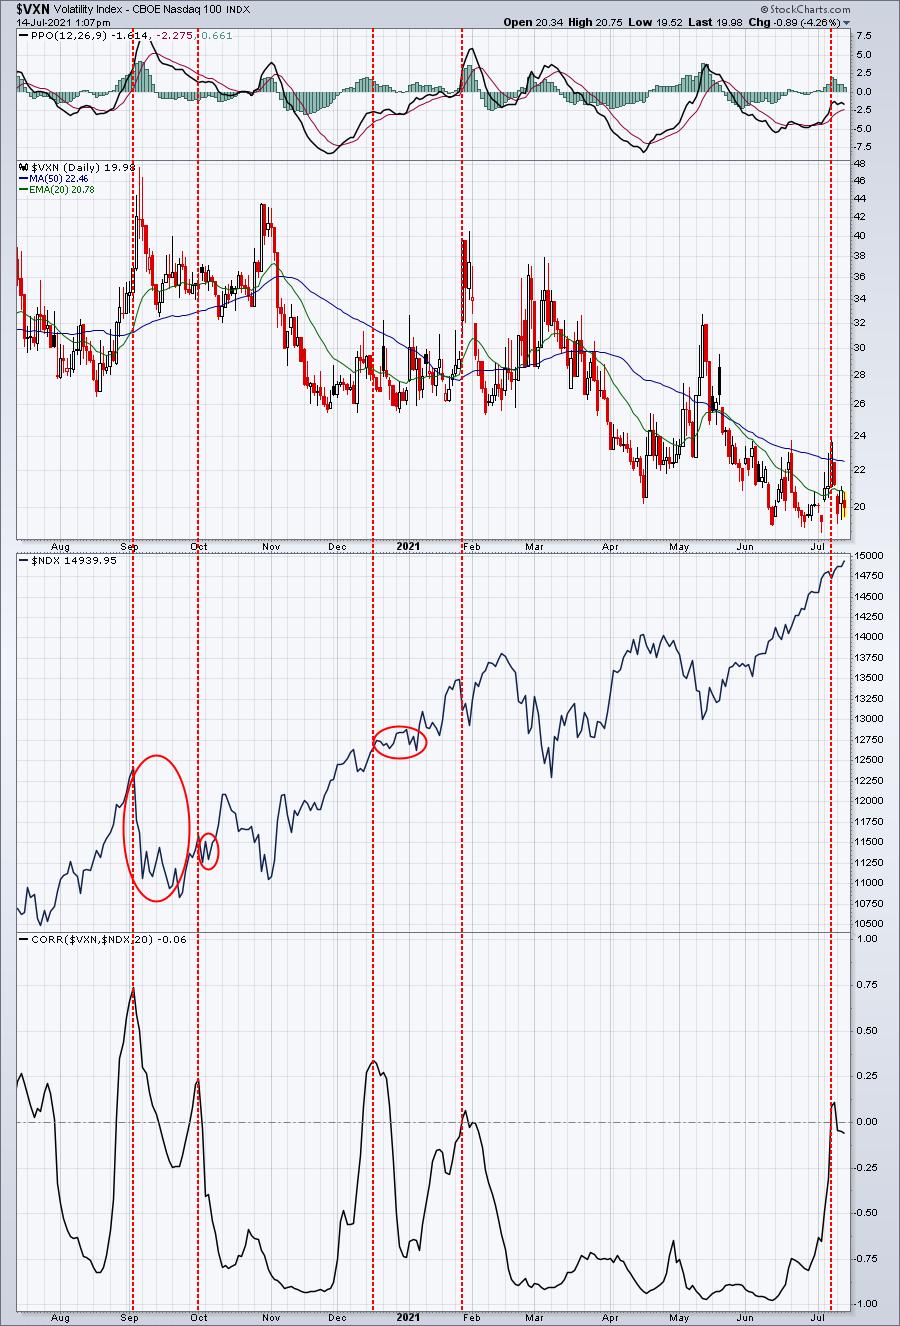
This move into positive correlation by no means ensures an upcoming selloff, but there has been a history of choppiness when NASDAQ fear elevates and accompanies a rise in NASDAQ prices. This week tends to be quite bullish for U.S. equities, but next week is a completely different story altogether. Hedging against possible downside with the use of SPY or QQQ puts makes sense as an insurance policy. If you own individual stocks, selling calls against those stocks provides at least a bit of downside protection.
Sector/Industry Focus
From our Sector Relative Strength ChartList, technology (XLK) is quickly regaining its leadership role. This is great news for the secular bull market that we've enjoyed since the April 2013 S&P 500 breakout as a strong technology area suggests that the current rally is sustainable. Even though I tend to turn somewhat cautious as the historical July 17th top approaches, the renewed strength in technology provides us a very bullish longer-term signal. Here's the current relative status of the XLK:
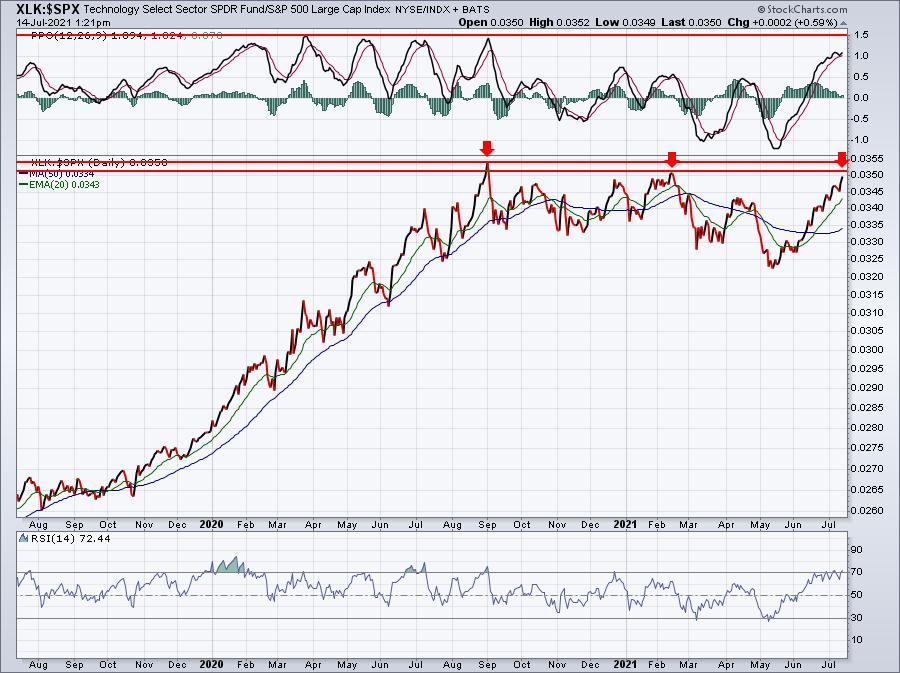
There's definitely overhead relative resistance that must be negotiated. If you look back to July 2020, the XLK got off to a great relative start, but then trended lower the balance of the month. While it's very possible that scenario repeats itself, signs point to a relative breakout down the road, so any short-term relative weakness will represent a buying opportunity, in my opinion.
ChartLists/Strategies
After the close yesterday, we held our latest monthly Max Pain webinar for July. We provided 8 individual stocks that could be influenced to move either higher or lower based upon their current options picture. One of the stocks that I suggested could move lower short-term was NVIDIA Corp (NVDA), which has a TON of net in-the-money call premium as we speed toward options expiration Friday. The value of those net calls was roughly $785 million. Today's drop of 2% cuts that net call premium to $640 million. When market makers have financial incentive to drive prices lower, it's definitely "buyer beware". Here's the NVDA chart:
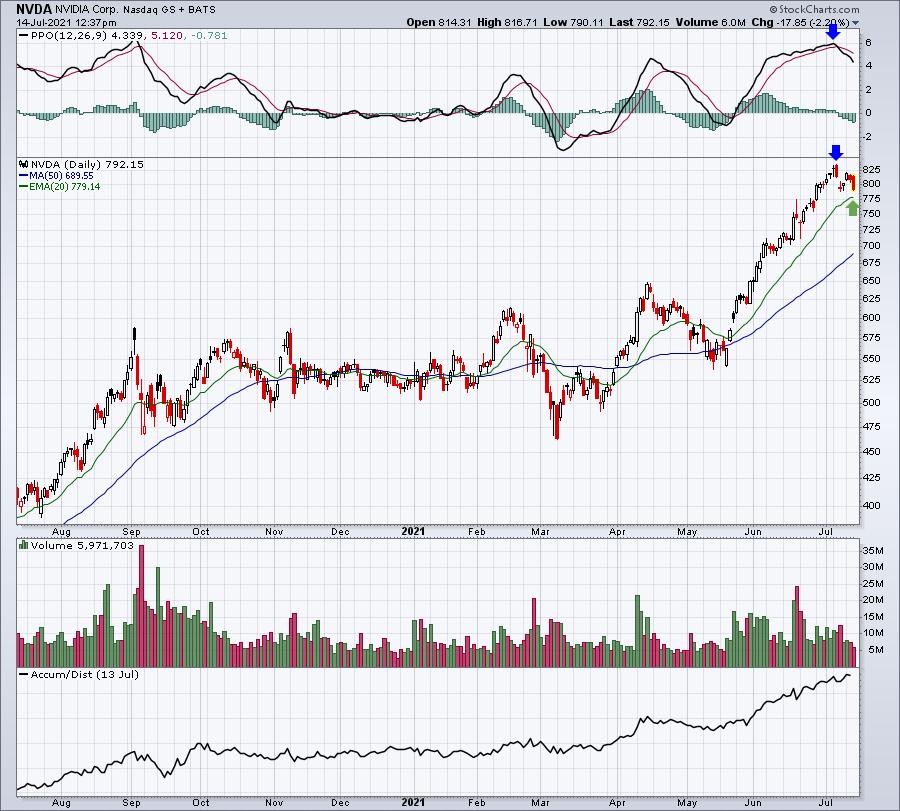
I always emphasize that options-related manipulation is a short-term market inefficiency. Long-term holders of NVDA should not be influenced by these monthly options concerns. However, traders of NVDA should absolutely be aware of this short-term influence. In my opinion, just one morning of selling justifies the max pain research that we do. In the chart above, the two blue arrows highlight that NVDA's daily PPO was at a high simultaneously with the price high. This is good news for bulls. There's no negative divergence. But a 20-day EMA test is always a possibility. That's marked with a green arrow. Market makers will bank a lot of coin if NVDA just gives up another 2%. A breakdown beneath the 20-day EMA would result in a windfall.
Earnings Reports
Here are the key earnings reports for the next two days, featuring stocks with market caps of more than $10 billion. I also include a few select companies with market caps below $10 billion. Finally, any portfolio stocks that will be reporting results are highlighted in BOLD. If you decide to hold a stock into earnings, please understand the significant short-term risk that you are taking. Please be sure to check for earnings dates for any companies you own or are considering owning.
Wednesday, July 14:
BAC, WFC, C, BLK, INFY, PNC, DAL
Thursday, July 15:
TSM, UNH, MS, USB, TFC, PGR, BK, WIT, CTAS, WAL, AA, WNS, HOMB, VLRS, MRTN
Economic Reports
June PPI: +1.0% (actual) vs. +0.6% (estimate)
June Core PPI: +1.0% (actual) vs. +0.5% (estimate)
Happy trading!
Tom