
EB Daily Market Report - Thursday, July 15, 2021
Friday Daily Market Report
I will be traveling and out of town on Friday, but John Hopkins plans to provide a very brief market update during the day on Friday. I'll be back on Monday and will publish the regular DMR.
Executive Market Summary
- Futures were lower this morning, although there was relative strength on the NASDAQ
- Relative strength has reversed back to the Dow Jones and S&P 500, but all of our major indices are lower
- Max pain and approaching options expiration could be having a short-term negative effect
- Earnings have again crushed expectations today, with every major company reporting EPS above expectations
- Unitedhealth Group (UNH, +1.33%) beat easily, $4.70 vs. $4.41, yet the initial reaction sent UNH down to test its rising 20-day EMA; it has since recovered and is nearing a breakout
- Taiwan Semiconductor (TSM, -5.68%) handily beat expectations, yet is the worst performer among companies reporting earnings this morning
- Excluding crude oil ($WTIC, -1.52%), most commodities are higher on the session
Market Outlook
Sector relative strength provides us a view of market rally sustainability. I'm never a fan of seeing defensive groups leading during a rally. Granted, I'm only using a one week look-back period, but Wall Street has turned more defensive, which typically means that we should too. Again, it's not a large sample size, but as the S&P 500 has moved to new record highs the past week, it's done so with 3 defensive sectors in the Top 4. Financials (XLF) have had the best week, but check out spots 2 through 4:
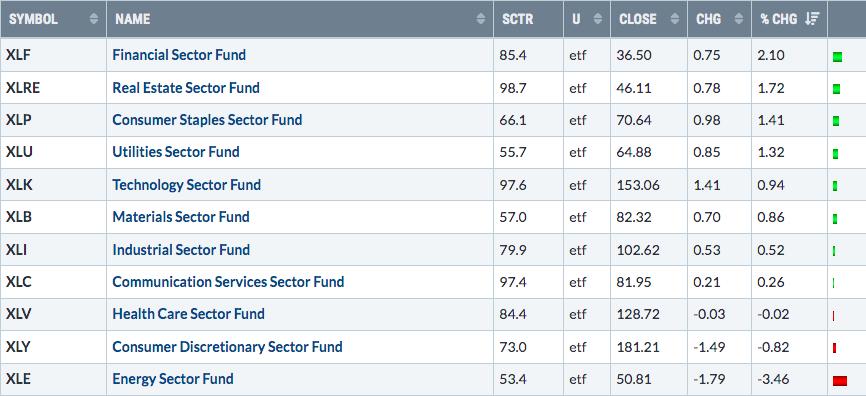
Energy (XLE) has been crushed as crude oil prices ($WTIC) have fallen close to $5 per barrel since its recent high near $77 per barrel.
This is simply one more short-term signal that suggests we rein in our bullish enthusiasm a bit - at least for now.
Sector/Industry Focus
Waste & disposal services ($DJUSPC) has re-emerged as a leading industry group and one to at least consider in your short-term trading. Here's a look at the current technical outlook:
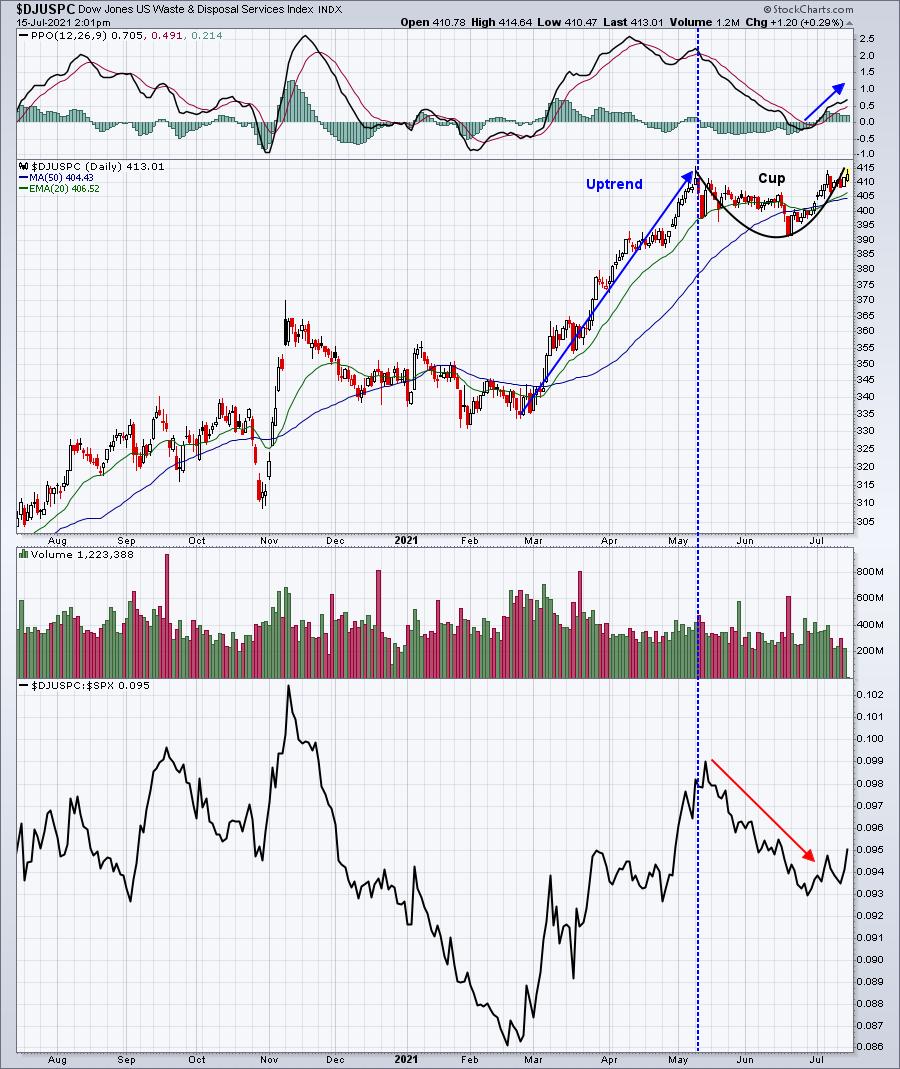
Its relative strength has turned up again after consolidating in a cup for the past two months. We could see a handle form during a shallow pullback, but anything close to the 20-day EMA would be a technically-sound entry point into the industry group.
ChartLists/Strategies
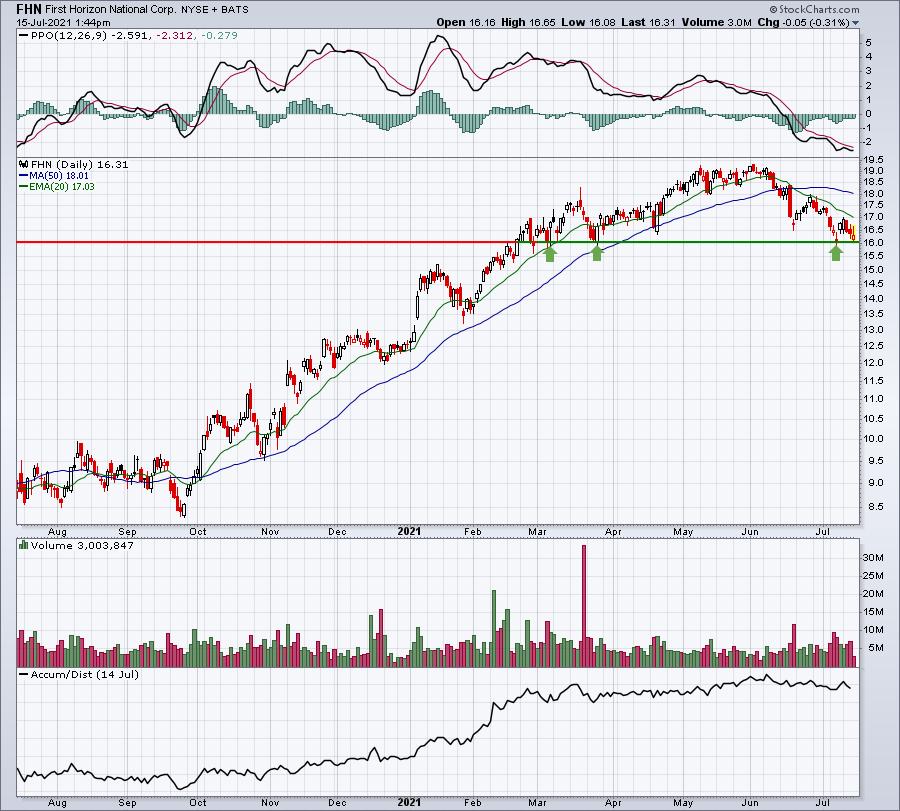
Max pain is likely helping to drive equity prices lower in the very near-term and, on the heels of this, we have one of the worst historical weeks of the year on tap for next week. Regardless of whether prices move lower, I think it's important to remain somewhat cautious from a short-term trading perspective. We've made a nice run into the start of earnings season, so a period of profit taking would not be unusual at all. The following charts are interesting, mostly because they've reached a key area of support. It doesn't mean, however, that support will hold. If I traded anything right now, I'd generally do so with fewer shares (smaller position sizes) and be willing to keep tight stops in play and accept small losses. Otherwise, I'd be patient, wait, and see how things develop.
Here are two charts off of our Strong Earnings ChartList (SECL) worth mentioning:
FHN:
IART:
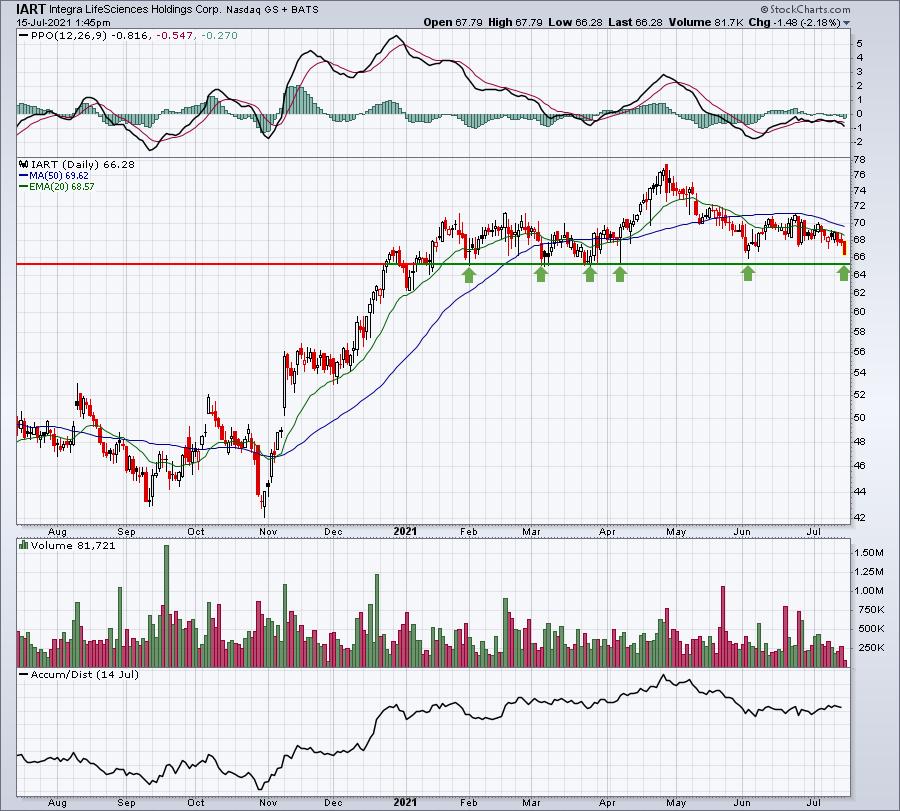
There are plenty of stocks breaking out on the SECL, but these two have pulled back and are at or nearing very important price support.
Earnings Reports
Here are the key earnings reports for the next two days, featuring stocks with market caps of more than $10 billion. I also include a few select companies with market caps below $10 billion. Finally, any portfolio stocks that will be reporting results are highlighted in BOLD. If you decide to hold a stock into earnings, please understand the significant short-term risk that you are taking. Please be sure to check for earnings dates for any companies you own or are considering owning.
Thursday, July 15:
TSM, UNH, MS, USB, TFC, PGR, BK, WIT, CTAS, WAL, AA, WNS, HOMB, VLRS, MRTN
Friday, July 16:
SCHW, ERIC, STT, KSU, FHN, ALV
Economic Reports
Initial jobless claims: 360,000 (actual) vs. 386,000 (estimate)
July Philadelphia Fed manufacturing index: 21.9 (actual) vs. 28.5 (estimate)
July empire state manufacturing index: 43.0 (actual) vs. 18.3 (estimate)
June industrial production: +0.4% (actual) vs. +0.7% (estimate)
June capacity utilization: 75.4% (actual) vs. 75.6% (estimate)
Happy trading!
Tom