
EB Daily Market Report - Monday, July 19, 2021
Model ETF Portfolio Draft
Today at 5:00pm ET, I'll be unveiling the ETFs that will be included in our Model ETF Portfolio for the next 3 months. I hope you can join us. The webinar room link to be used is as follows:
https://earningsbeats.zoom.us/j/85232118128
The room will be open no later than 4:30pm ET. If you can't make it, the event will be recorded and you'll be able to access the recording at your leisure.
Executive Market Summary
- Futures were extremely weak this morning and selling has been intense throughout the session
- The Dow Jones is on pace to have its worst day of 2021
- Today is proving to be one more example of the bearishness associated with the Monday after options expire
- Crude oil prices ($WTIC, -7.66%) have been crushed, leading to energy (XLE, -4.48%) badly lagging the S&P 500 once again
- Meanwhile, the U.S. dollar (UUP, +0.12%) is looking to close at its highest level since early April
- All 11 sectors are lower with more than half down 2% or more
- Home construction ($DJUSHB, -0.26%) has held up well despite a weaker-than-expected housing market index for July
- A rapidly-declining 10-year treasury yield ($TNX), falling another 11 basis points to 1.19%, is likely aiding the DJUSHB
- Banks ($DJUSBK, -3.37%) are performing very poorly, however, burdened by those falling yields
Market Outlook
Copper ($COPPER, -0.52%) is the one commodity that's very closely tied to global economic conditions and the one that I follow most closely. Below is a chart that shows the positive correlation between the direction of copper prices and the direction of the benchmark S&P 500:
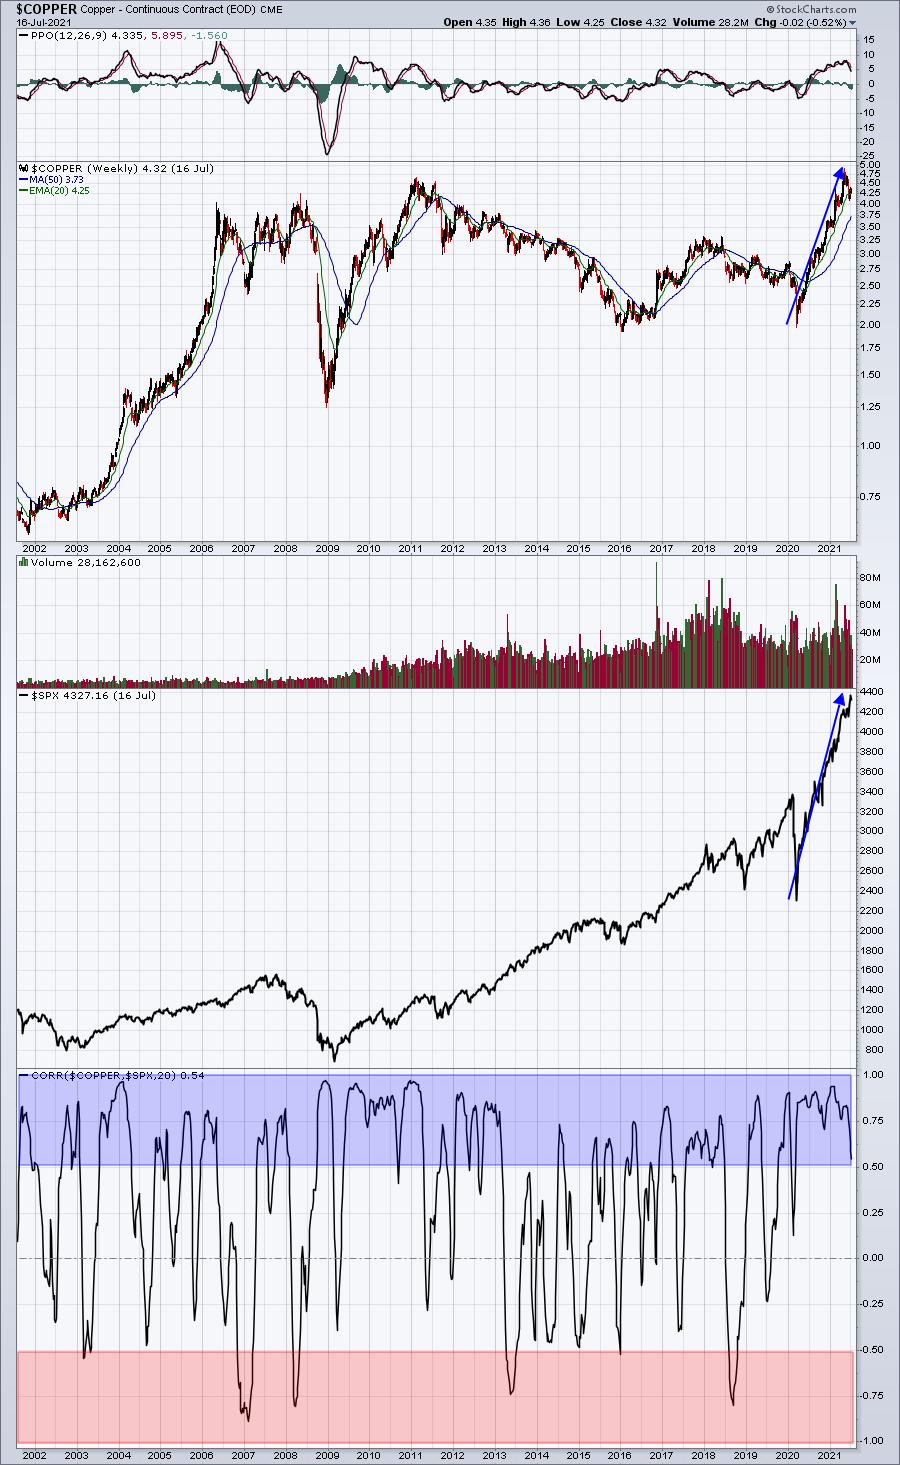
When the stock market turns weak, as it's done the past several days, it's very easy to believe all the bearish headlines that begin to surface. However, I'd continue to stick with the charts. Copper prices have a very strong positive correlation to the S&P 500 over time. Yes, copper prices have pulled back from recent highs, so the S&P 500 doing the same should be no shock.
Transportation stocks ($TRAN) also are very highly correlated to economic conditions. Transportation stocks and copper are showing similar charts over the past several years:
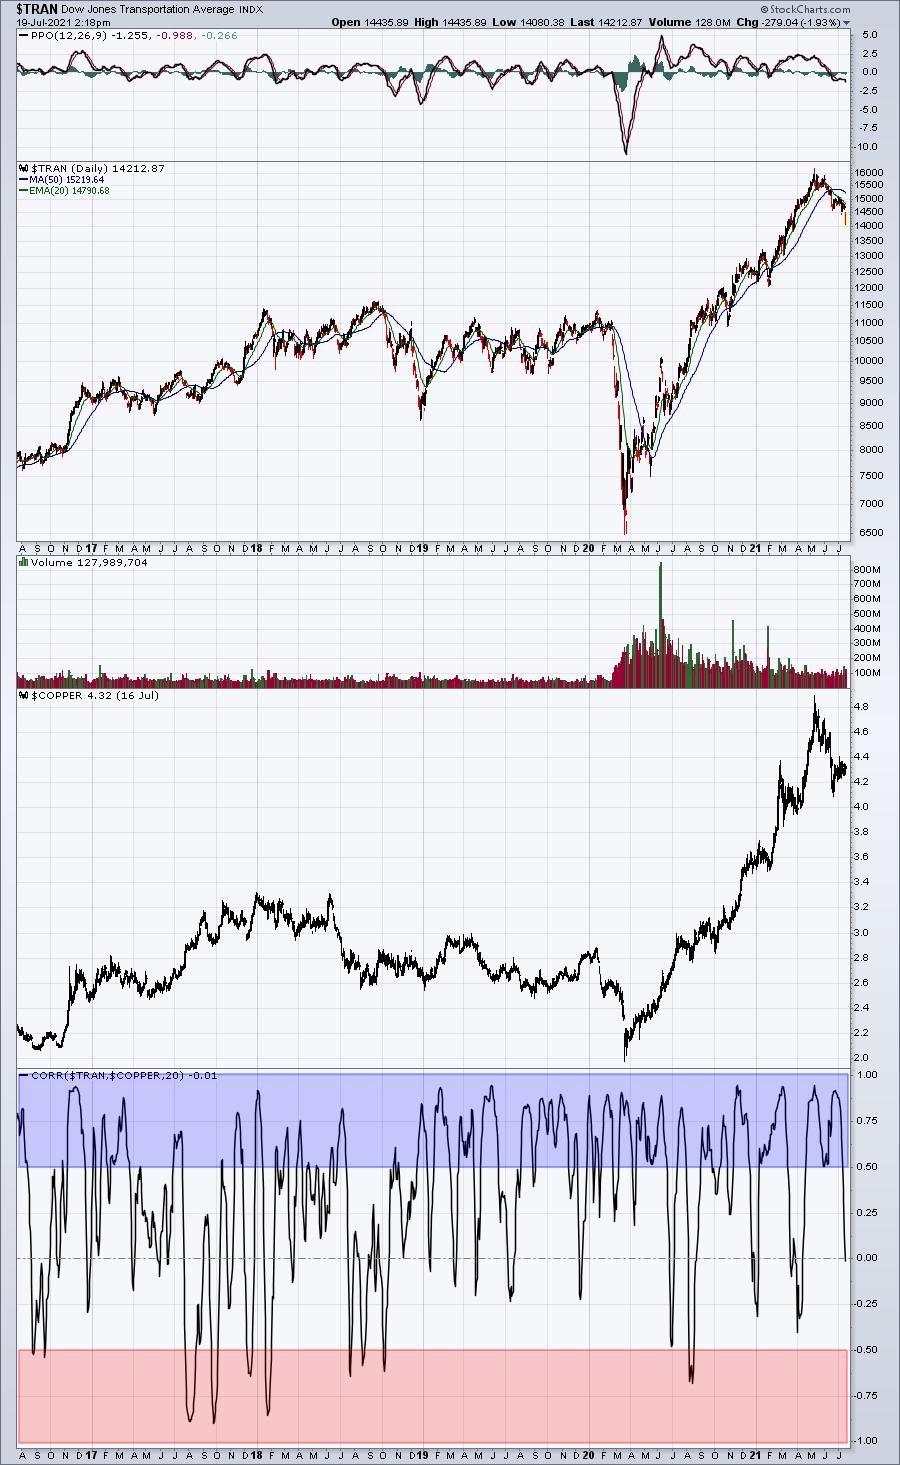
I absolutely believe that stock prices are heading higher and that the secular bull market marches on. However, it is now the second half of July and we know that seasonal patterns do not favor the bulls right now. Accumulation on weakness makes sense and will likely be rewarded over time.
Sector/Industry Focus
Volatility ($VIX, +33.44%) is spiking significantly, which is indicative of increasing fear. Key bottoms are carved out with high VIX readings, but it's difficult to say how high the VIX might go. During secular bull markets, any VIX reading above 30 could mark a bottom, especially as it moves into the 35-37 range. Here's a quick look at prior bottoms and where the VIX topped:
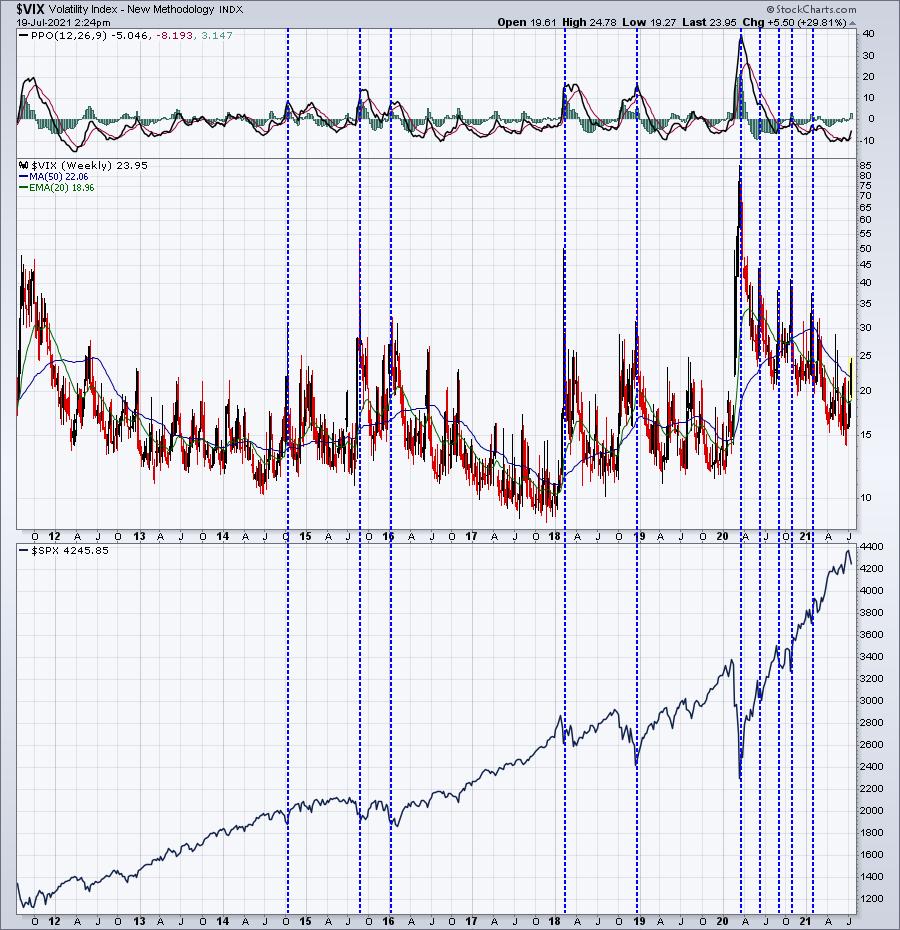
The blue-dotted vertical lines mostly line up with key tradable market bottoms. These dotted lines represent VIX spikes to 30 or above throughout this secular bull market. If we see further stock market weakness, I believe we'll see the VIX pop into the 30s. Anything in the mid-30s would indicate a bottom is forming. There's no guarantee we get to the mid-30s, but if we do, I'd be looking for other corroborating evidence of a bottom - price support, trendline support, 60-minute positive divergence, oversold readings, etc.
ChartLists/Strategies
I'm not a big fan of shorting stocks in a secular bull market, which is why I rarely feature any stocks to short in this section. Cash is definitely a position and a choice and it's one that I lean toward when the VIX is rising, especially during periods that typically see selling. Currently, we're still feeling the effects of last week's July monthly options expiration. We're also experiencing a bit of "sell on news" as earnings are reported. Tractor Supply (TSCO) is a perfect example of what can happen after earnings are reported:
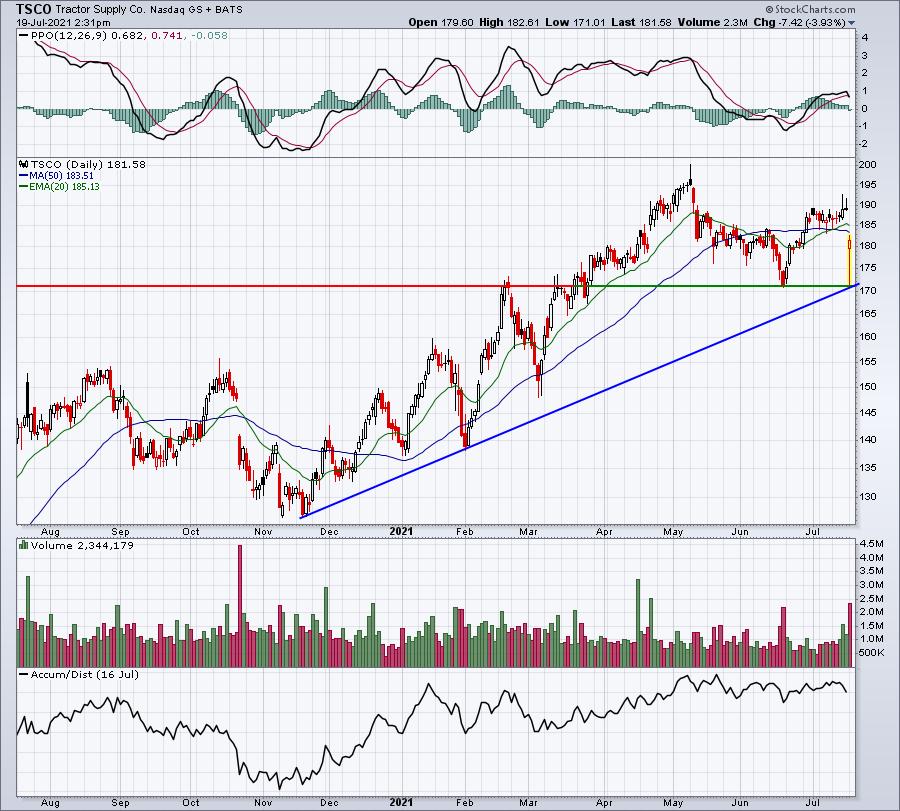
There was a huge gap lower on TSCO this morning, despite the company easily beating EPS expectations. After gapping lower, TSCO appeared to be in the midst of a major selloff, reaching key price support at 171 in the opening minutes of trading before rebounding throughout the day. These wild swings take emotional tolls on everyone. It's difficult not to panic sell a stock like TSCO when it's dropping so fast at the opening bell, yet today's big recovery on heavy volume could result in a new high in its AD line. Longer-term, nothing has really changed. TSCO remains above key support and below key resistance.
Earnings Reports
Here are the key earnings reports for the next two days, featuring stocks with market caps of more than $10 billion. I also include a few select companies with market caps below $10 billion. Finally, any portfolio stocks that will be reporting results are highlighted in BOLD. If you decide to hold a stock into earnings, please understand the significant short-term risk that you are taking. Please be sure to check for earnings dates for any companies you own or are considering owning.
Monday, July 19:
IBM, PLD, PPG, TSCO, JBHT, ELS, CCK, STLD, ZION, AN, FNB, CALM, HTLD
Tuesday, July 20:
NFLX, PM, ISRG, CNI, HCA, UBS, CMG, TRV, SYF, IBKR, DOV, KEY, CFG, ALLY, HAL, XM, OMC, AGR, UAL, SBNY, SNV,MAN, IRDM, SNBR, AIR
Economic Reports
July housing market index: 80 (actual) vs. 82 (estimate)
Happy trading!
Tom