
EB Daily Market Report - Thursday, July 22, 2021
Executive Market Summary
- Futures were relatively flat, but we have seen the NASDAQ outperform the S&P 500 since the opening bell
- Technology (XLK, +0.45%) and health care (XLV, +0.43%) are leading the market slightly higher
- Software ($DJUSSW, +1.21%) is leading technology as Microsoft (MSFT, +1.17%) reaches a new high
- Financials (XLF, -1.28%) is the primary sector laggard as the 10-year treasury yield ($TNX) drops 3 basis points
- Energy (XLE, -1.02%) is the second worst performing sector, despite crude oil ($WTIC, +1.54%) jumping
- Earnings continue to pour in mostly ahead of expectations
- Dominos Pizza (DPZ, +13.08%) is soaring after beating estimates and announcing a $1 billion share buyback
- Meanwhile, Texas Instruments (TXN, -4.78%) is a laggard despite revenue and earnings beats; guidance was underwhelming
Market Outlook
Technology (XLK), after a few days of selling, has quickly returned to key short-term price resistance, threatening another breakout to all-time record-high territory:
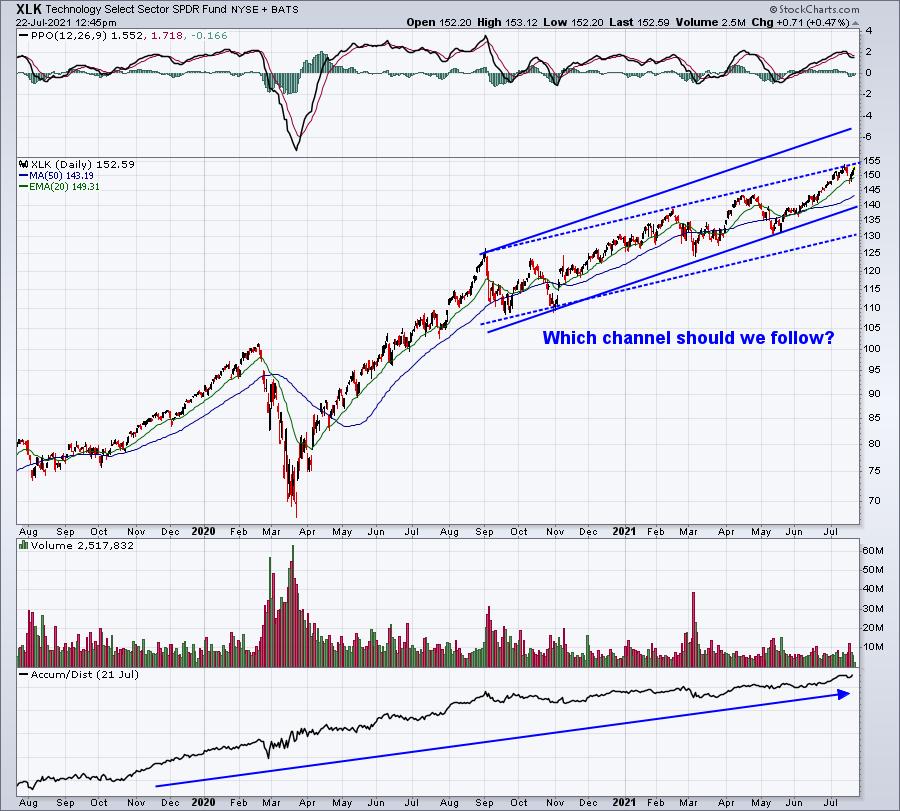
We don't have a clearly-defined channel established at this point. If we connect the recent highs and then drag that line lower to connect the low (blue-dotted lines), we see a much more modest uptrend in place. However, if we connect the lows and then drag that line higher to connect the major September top, then it appears as though we have a lot more room to the upside available. If the XLK can forge to a new high, it would begin arguing for that latter channel - the much more bullish one.
Sector/Industry Focus
Defense stocks ($DJUSDN) are a great example of how a negative divergence can play out in sideways action. It doesn't mean that we should be looking for some type of major selloff. Check this out:
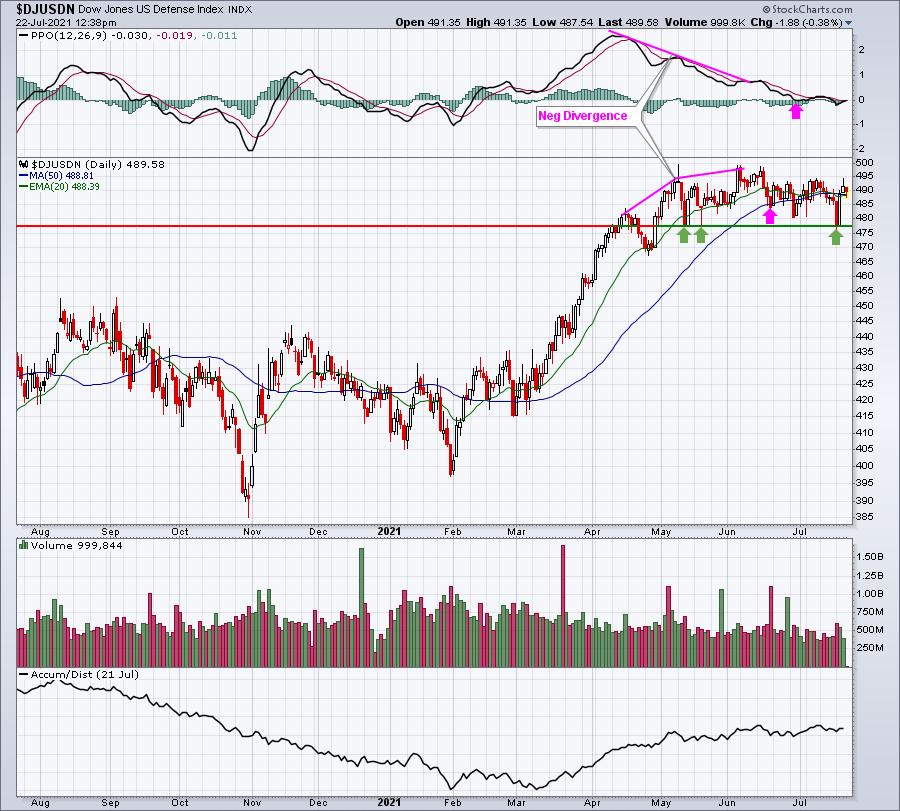
The pink arrows demonstrate what I look for after a negative divergence prints. Once I see a 50-day SMA test and a PPO centerline test, the slowing momentum issue is resolved. From there, the DJUSDN could go higher or break down and begin a new downtrend. Based on the pattern here (uptrend following by a bullish rectangular consolidation), I believe the odds are that the bulls take this group higher. A close below that 475-477 support area would require re-evaluation.
ChartLists/Strategies
Today I ran the RSI scan against the updated Raised Guidance ChartList (RGCL), changing the upper limit of RSI from 50 to 43 (so it was any stock on the RGCL with an RSI reading between 40 and 43), and 47 stocks were returned. 2 that looked interesting are as follows:
POWW:
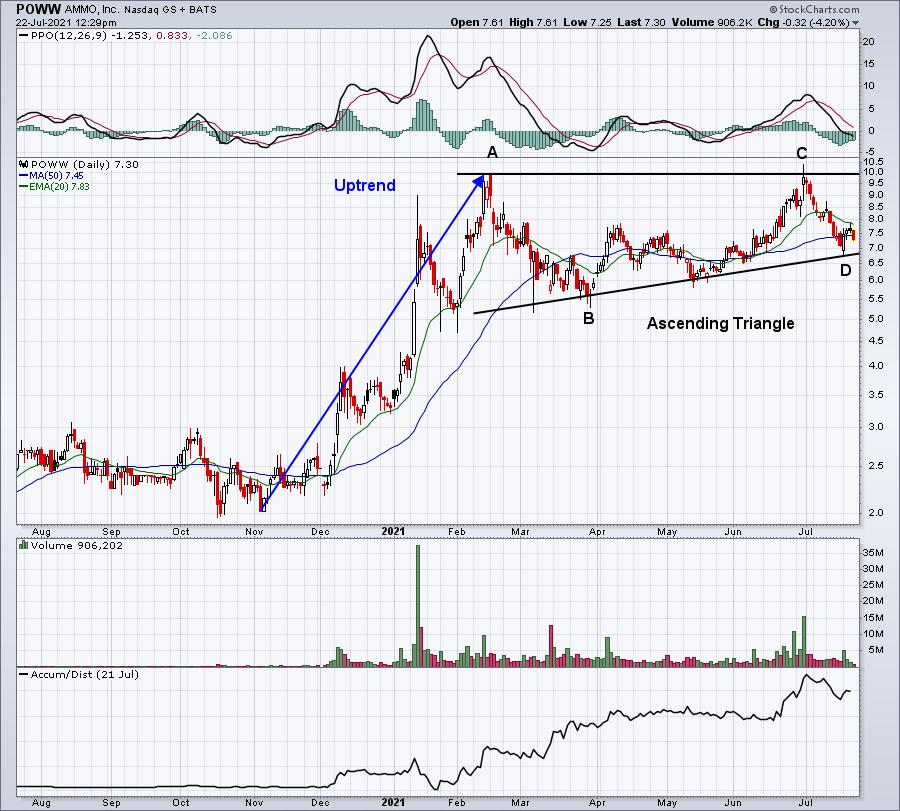
The AD line here remains quite strong and this bullish ascending triangle continuation pattern looks compelling. The current price down to the 6.75 area looks like a great area to accumulate. It is a smaller stock, so you must be comfortable taking on additional risk, but POWW looks solid to me.
LQDT:
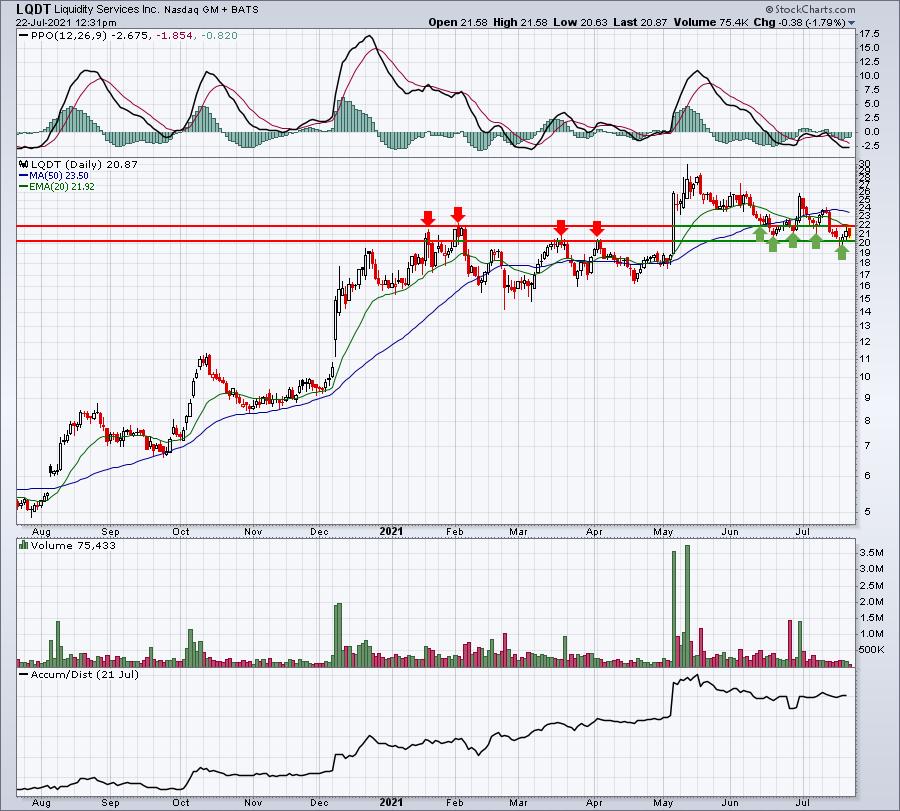
The red arrows highlight the significant price resistance in the 20-22 area. Now, on the way down, we're seeing that same 20-22 range hold as support. LQDT's AD line remains strong, so I'd expect for its next major move to be higher.
Earnings Reports
Here are the key earnings reports for the next two days, featuring stocks with market caps of more than $10 billion. I also include a few select companies with market caps below $10 billion. Finally, any portfolio stocks that will be reporting results are highlighted in BOLD. If you decide to hold a stock into earnings, please understand the significant short-term risk that you are taking. Please be sure to check for earnings dates for any companies you own or are considering owning.
Thursday, July 22:
INTC, ABT, DHR, T, UNP, SNAP, MMC, ABB, COF, TWTR, BIIB, NEM, FCX, DOW, AEP, DHI, SIVB, LUV, NUE, VRSN, FITB, FE, DPZ, POOL, GPC, KB, DGX, CE, WRB, ALLE, AAL, SNA, SAM, WSO, CSL, CLF, RHI, EWBC, RS, CBSH, CROX, ORI, SKX, GTLS, BCO, TRN, HTH, TPH
Friday, July 23:
HON, NEE, AXP, ROP, KMB, SLB, RF, GNTX, NEP, AIMC, SXT
Economic Reports
Initial jobless claims: 419,000 (actual) vs. 350,000 (estimate)
June existing home sales: 5,860,000 (actual) vs. 5,900,000 (estimate)
June leading indicators: +0.7% (actual) vs. +1.0% (estimate)
Happy trading!
Tom