
EB Daily Market Report - Friday, July 3, 2021
Executive Market Summary
- Futures were very weak this morning after Amazon.com (AMZN) dropped an earnings bomb
- Despite today's weakness, the S&P 500 should end July with a solid gain, its 6th consecutive monthly gain
- Crude oil ($WTIC, +0.20%) is climbing slightly today, while other commodities are mostly lower
- The 10-year treasury yield ($TNX) is down 4 basis points to 1.23% and hit its lowest level in the past 8 days
- While crude oil has moved higher, energy (XLE, -1.77%) is today's worst sector
- Consumer discretionary (XLY, -1.62%), burdened by AMZN, is a close second
- Meanwhile, defensive sectors are showing relative strength, led by real estate (XLRE, +0.52%) and health care (XLV, +0.28%)
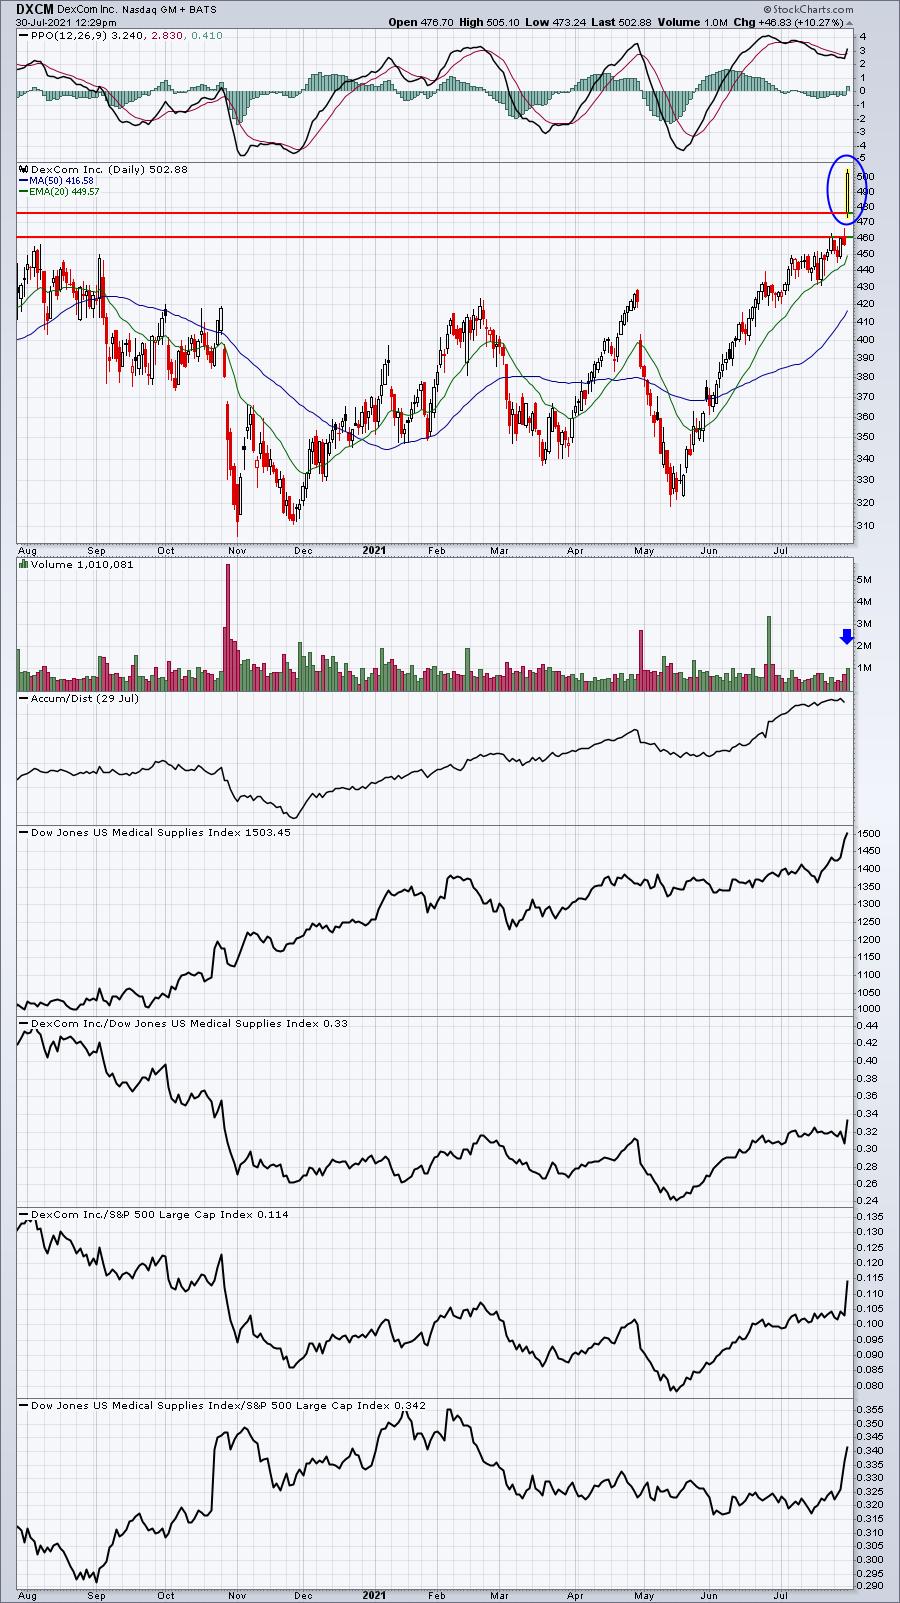
- Skyworks Solutions (SWKS, -8.27%) is the worst S&P 500 performer, while DexCom (DXCM, +10.65%) is having a stellar day after beating estimates; DXCM is featured below
Market Outlook
I break the 11 sectors down as follows:
Aggressive:
- Technology (XLK)
- Consumer Discretionary (XLY)
- Communication Services (XLC)
- Industrials (XLI)
- Financials (XLF)
Defensive:
- Health Care (XLV)
- Consumer Staples (XLP)
- Real Estate (XLRE)
- Utilities (XLU)
Neutral:
- Energy (XLE)
- Materials (XLB)
The key to following sector performance is relative strength. During secular bull markets, aggressive sectors tend to lead, while defensive groups lead during bear markets as money rotates from aggressive to defensive. A period of relative strength in defensive stocks during a secular bull market rally can be problematic as it indicates a shift in mentality.
Those last two sectors, energy and materials, are an odd lot. They are impacted by not only the economic strength associated with a bull market, but they also are subject to other outside influences like geopolitical concerns and the direction of the U.S. dollar (UUP). The XLE and XLB have struggled recently, especially the XLB, as the UUP has regained strength. The past 1-2 weeks, however, has seen the dollar fall back beneath its 20-day EMA support and it's fairly obvious that's been aiding both the XLE and XLB:
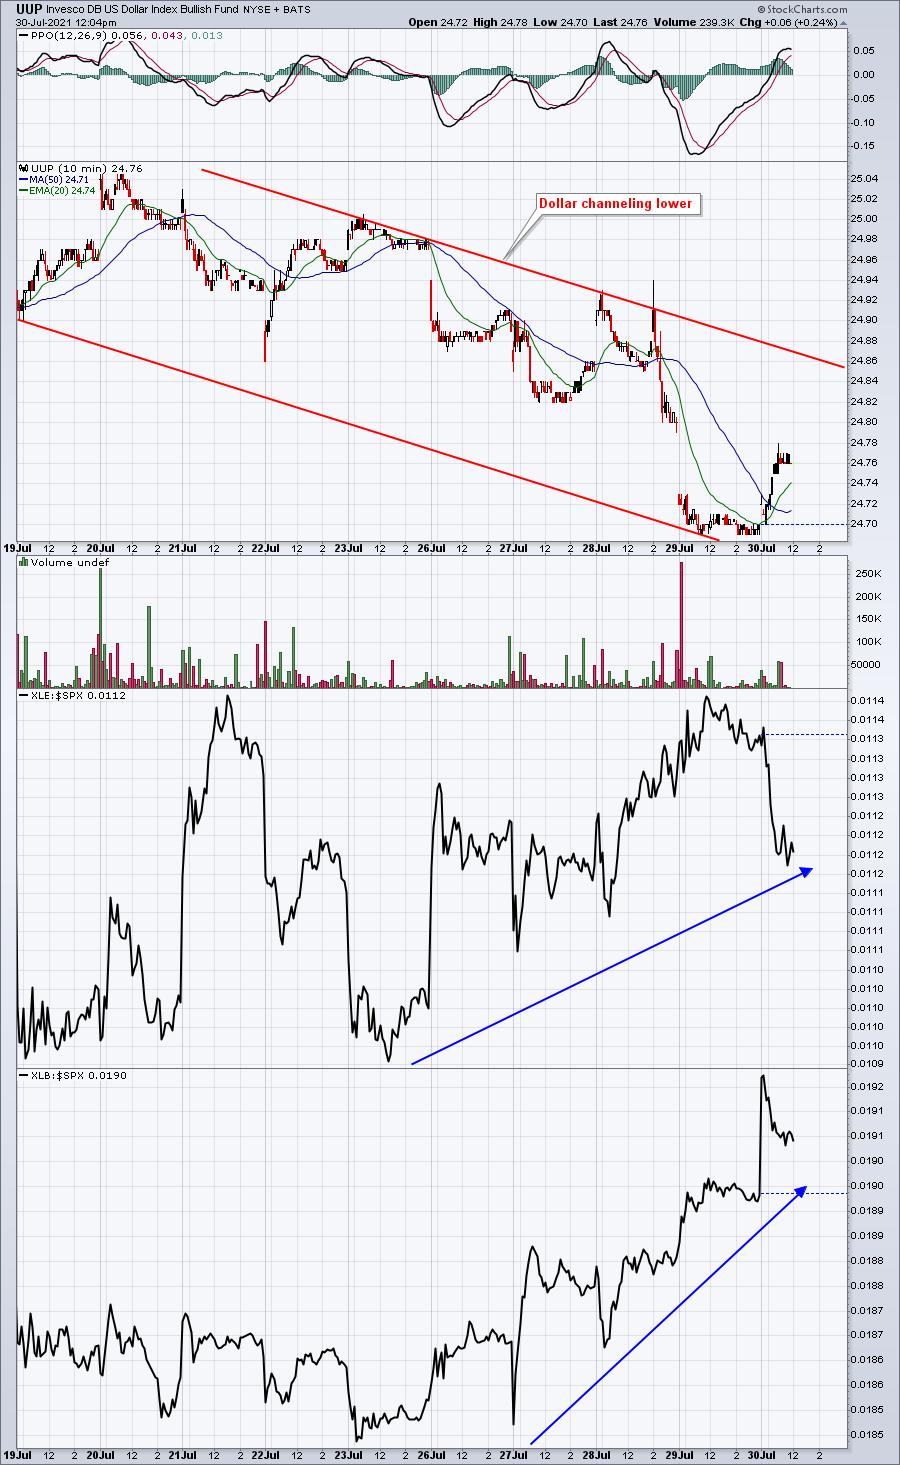
This is just the past 10 days, but there's a very long (decades) inverse relationship between the U.S. dollar and the relative strength of both the XLE and XLB. Always keep one eye on the dollar if you like to trade the energy and materials sectors.
Sector/Industry Focus
Broadline retailers ($DJUSRB, -5.86%) are having a rough day, which is understandable considering the quarterly earnings report that Amazon.com (AMZN) delivered. I said yesterday that I couldn't imagine AMZN disappointing with its quarterly report, but it did exactly that. They missed their revenue estimate and then lowered their revenue guidance. One potential reason is simply the fact that as our economy reopens, some online AMZN business will be recaptured by brick and mortar stores. Listen, AMZN remains one of the greatest companies on earth, but failure to hold onto its breakout technically opens the door to recent price lows:
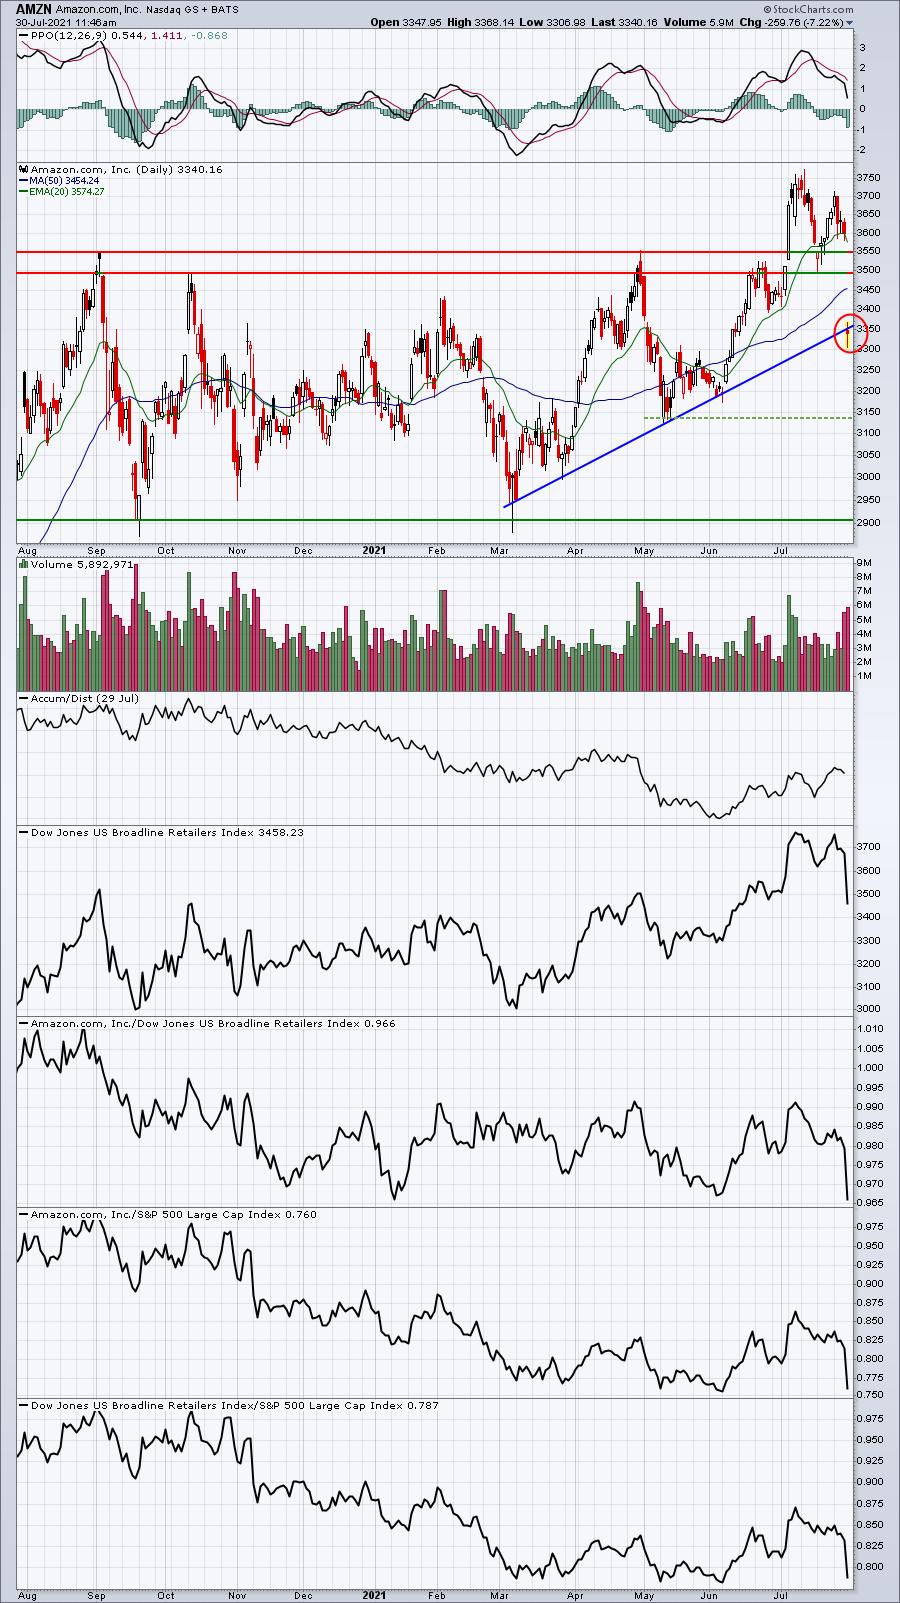
I'd keep a close eye on the short-term uptrend in place on AMZN. If that fails to hold with this kind of volume, I'd be looking down to the two key horizontal support lines provided.
Another problem with AMZN's poor earnings report and reaction is the direct impact on many ETFs today's AMZN loss will have. For instance, consumer discretionary (XLY, -1.80%) is home to many stocks, but it's heavily influenced by AMZN, which represents nearly 23% of the ETF. Fortunately for the XLY, the next largest holding is Tesla (TSLA, +2.02%), which is helping with damage control.
ChartLists/Strategies
Earnings help to separate the good from the bad and the ugly. The best earnings are kept in our Strong Earnings ChartList (SECL), which is the ChartList that I use to do at least 90% of my personal trading. I prefer trading stocks that have shown the ability to beat Wall Street consensus estimates. I've found over the years that I'm hit with many fewer warnings during the quarter if I stick with companies where management is executing its plan and technical conditions are sound.
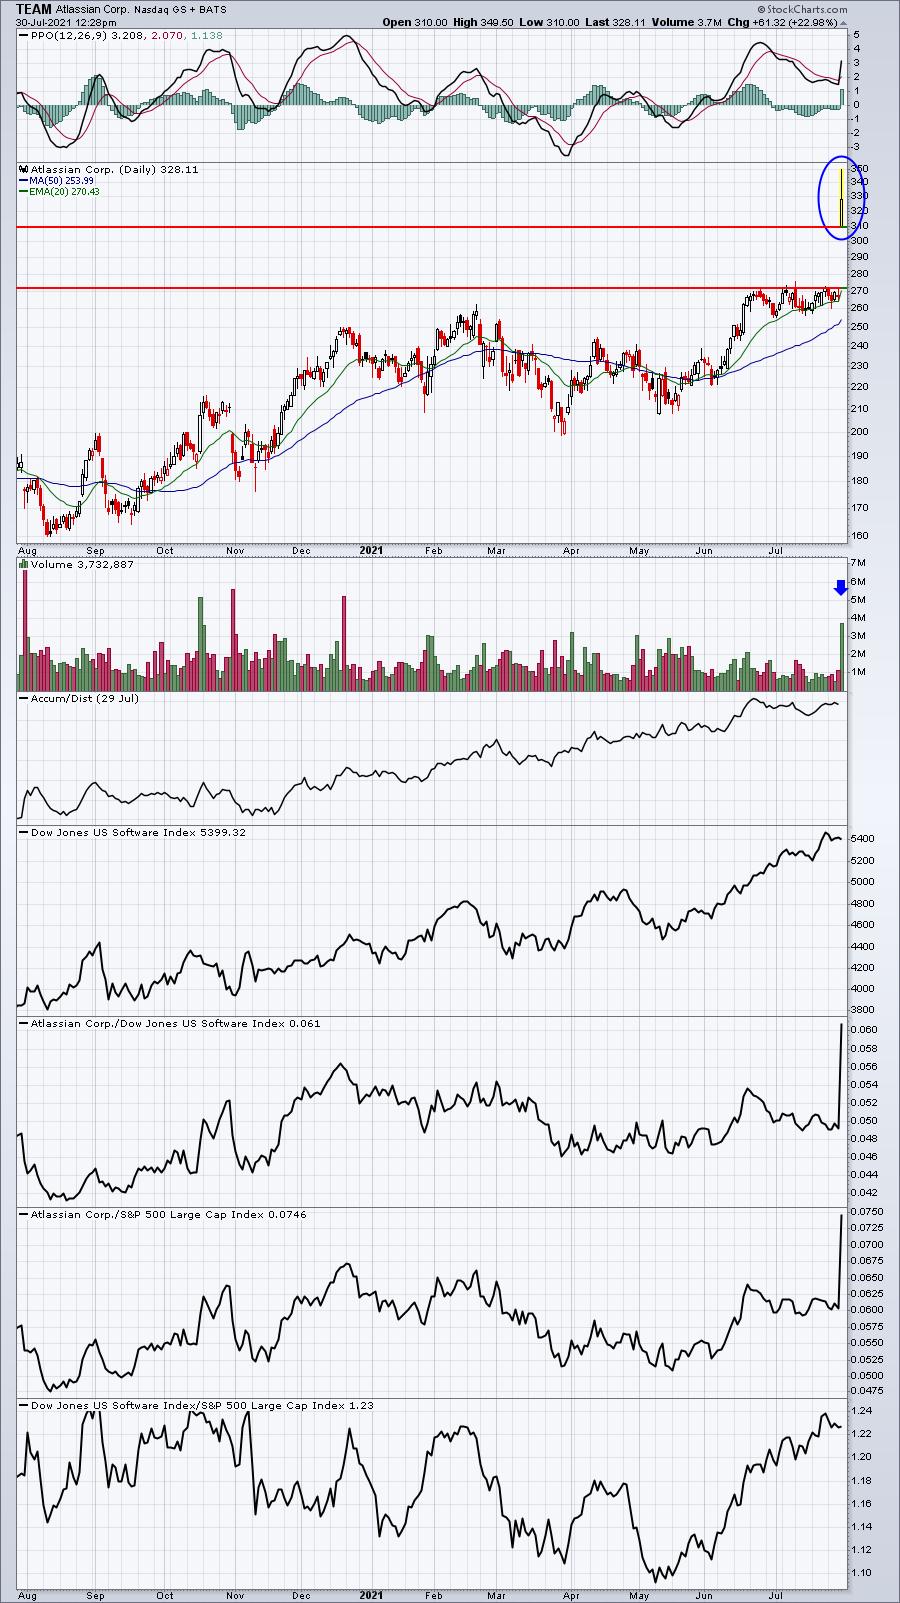
The following stocks reported excellent results last night after the bell. While they could experience short-term pullbacks after big gaps, I've found these types of companies to further extend gains over the coming weeks:
TEAM:
DXCM:
Compare these breakouts to what we saw two weeks ago with Chipotle Mexican Grill (CMG):
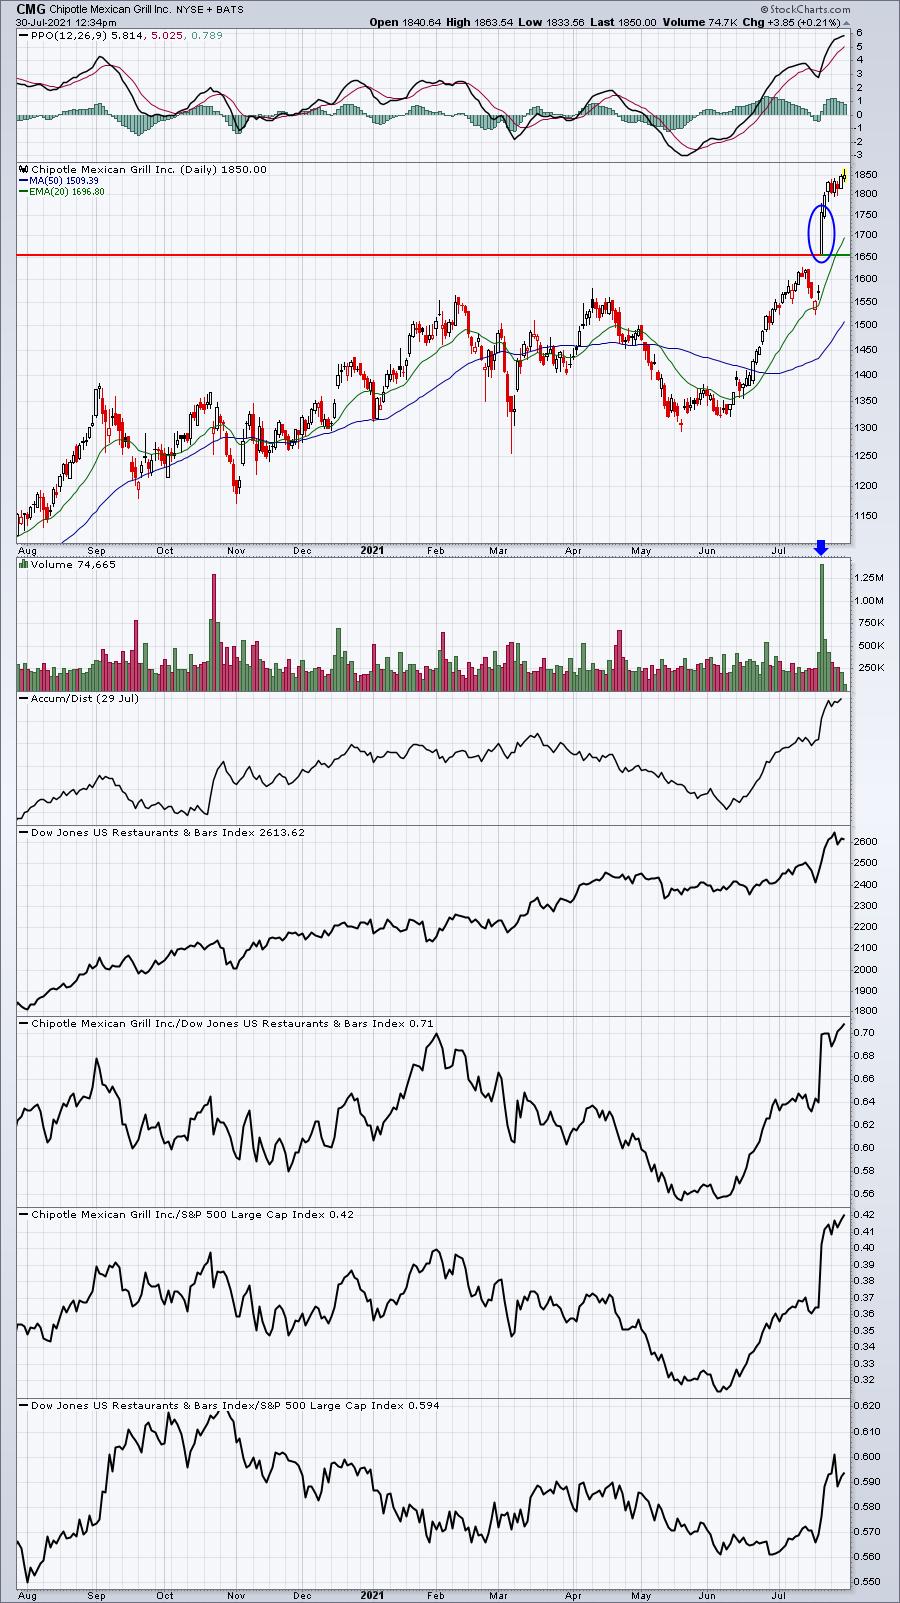
Long hollow candles on heavy volume suggest institutional accumulation, a necessity to drive prices higher. I fully expect prices to pull back from time to time, but I'm much more comfortably buying stocks that show this type of demand and accumulation.
Between TEAM and DXCM, I'm a bit more impressed with TEAM because of its volume, but I don't want it to reverse intraday to the point that the hollow candle evaporates. That would suggest that market makers were able to short and gain control of the stock, likely sending it lower near-term. A strong finish, however, would likely require market makers to cover their shorts, adding more demand.
Earnings Reports
Here are the key earnings reports for the next two days, featuring stocks with market caps of more than $10 billion. I also include a few select companies with market caps below $10 billion. Finally, any portfolio stocks that will be reporting results are highlighted in BOLD. If you decide to hold a stock into earnings, please understand the significant short-term risk that you are taking. Please be sure to check for earnings dates for any companies you own or are considering owning.
Friday, July 30:
PG, XOM, ABBV, CVX, LIN, CHTR, CAT, ENB, ITW, CL, IDXX, AON, JCI, LYB, VFC, CHT, WY, CERN, GWW, CNHI, CHD, QSR, IMO, WPC, CBOE, BAH, NWL, HRC, CPRI, COG, HUN, LAZ, DAN, BLMN
Monday, August 2:
GPN, NXPI, SPG, RACE, SBAC, PXD, AWK, WMB, ANET, O, ZI, TTWO, ON, EMN, FANG, SEDG, CLR, BRKR, CNA, MOS, TREX, VNO, COLM, VRNS, LEG, ACHC, TGTX, NSP, KMT, TSEM, RMBS, UCTT, RIG
Economic Reports
July personal income: +0.1% (actual) vs. -0.7% (estimate)
July personal spending: +1.0% (actual) vs. +0.6% (estimate)
July Chicago PMI: 73.4 (actual) vs. 66.1 (estimate)
July consumer sentiment: 81.2 (actual) vs. 80.8 (estimate)
Happy trading!
Tom