
EB Daily Market Report - Tuesday, August 3, 2021
Executive Market Summary
- Futures were higher this morning and we opened with a modest gap higher
- After selling for the first 90 minutes, our major indices have mostly recovered, led by the Dow Jones' 0.50% advance and move back above 35000 - at least on an intraday basis
- Commodities are lower with crude oil ($WTIC) falling back below $71 per barrel; despite this, energy (XLE, +1.65%) is today's leading sector
- The 10-year treasury yield ($TNX) is flat today after June factory orders came in stronger than expected
- 10 of 11 sectors are higher with only communication services (XLC, -0.72%) under water on the session
- Broadcasting & entertainment ($DJUSBC, -1.13%) is the primary laggard in the XLC
- Toys ($DJUSTY, -3.44%) and travel & tourism ($DJUSTT, -2.30%) remain very weak components of consumer discretionary (XLY, +0.36%)
- Gartner Group (IT, +10.56%) is leading the S&P 500 higher after reporting very strong quarterly results
Market Outlook
One thing that's been very unclear of late is which major index is going to lead the next stage of this secular bull market, the NASDAQ 100 (QQQ) or the S&P 500 (SPY). I believe it'll be the QQQ as interest rates remain incredibly low and expected growth remains high. However, we haven't seen a confirmed relative breakout. Here's the latest relative chart between the two:
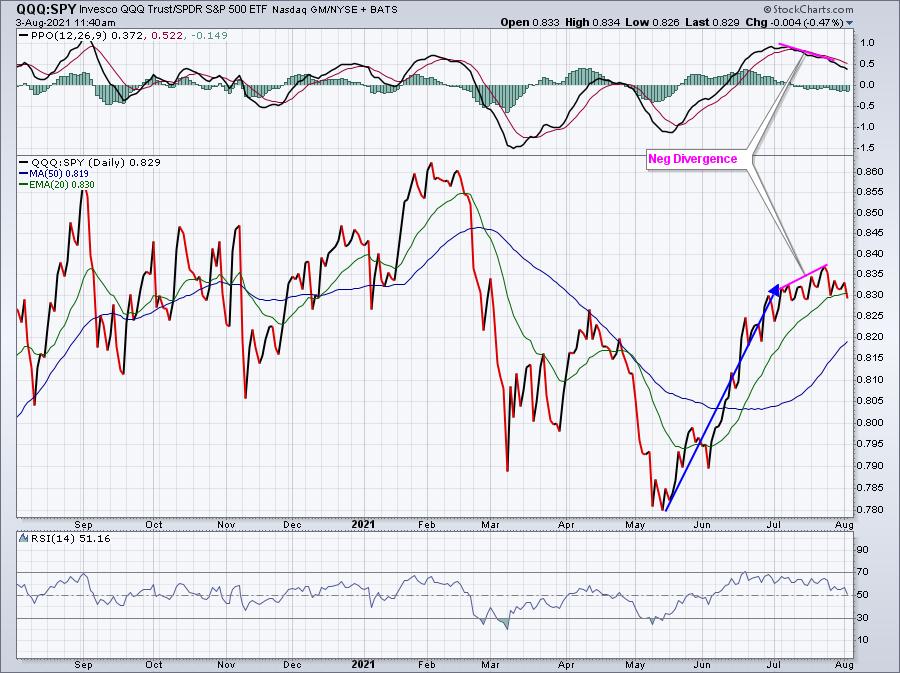
The rally of the May relative low was very bullish, but as we moved into July, a relative negative divergence emerged, simply suggesting that the QQQ's relative bullish momentum was waning. This relative ratio has been moving mostly sideways the past 3-4 weeks. Seasonal patterns favor the tech-laden NASDAQ to regain relative strength, but the above chart would argue against it.
Sector/Industry Focus
A relative ratio that I frequently review is the relationship between consumer discretionary stocks (XLY) and consumer staples stocks (XLP). Currently, there's a lot of congestion on this relative chart, but the long-term uptrend is intact. That's a very positive sign for the market to make new highs as we move throughout the balance of 2021:
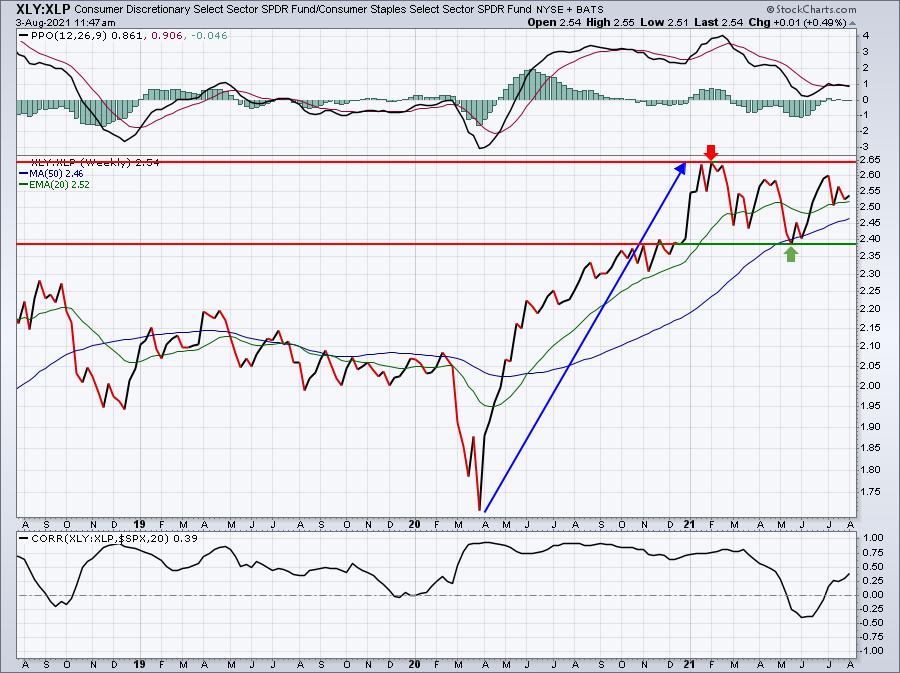
The bottom panel highlights the positive correlation between the XLY:XLP ratio and the S&P 500. This positive correlation stretches back the past two decades. A breakdown in the XLY:XLP ratio would be a significant warning sign to consider when evaluating the health of the U.S. stock market. Currently, I have no issues with how consumer stocks are performing.
ChartLists/Strategies
I ran a 52-week high scan against our key ChartLists (SECL, SFECL, SADCL, RGCL) to see if any of our ChartList stocks were breaking out, especially after extended bases had formed. I thought there were three notable breakouts:
ZI:
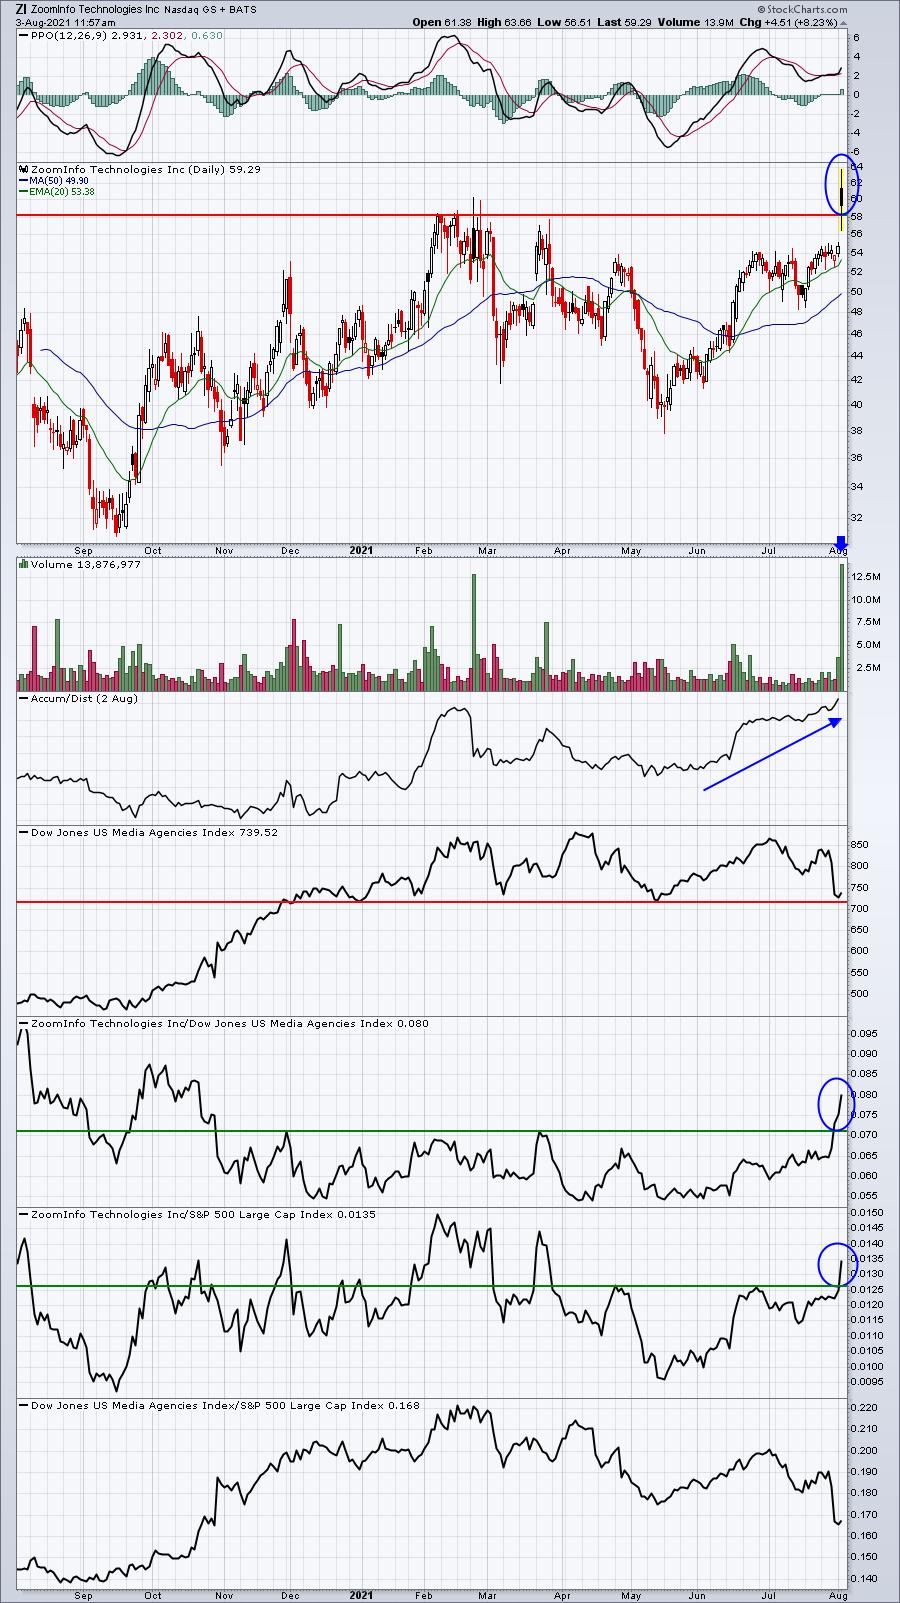
ZI is breaking out after months of consolidation, very good news indeed. Check out that volume. Lastly, the AD line confirms all the bullishness reflected by price action.
ON:
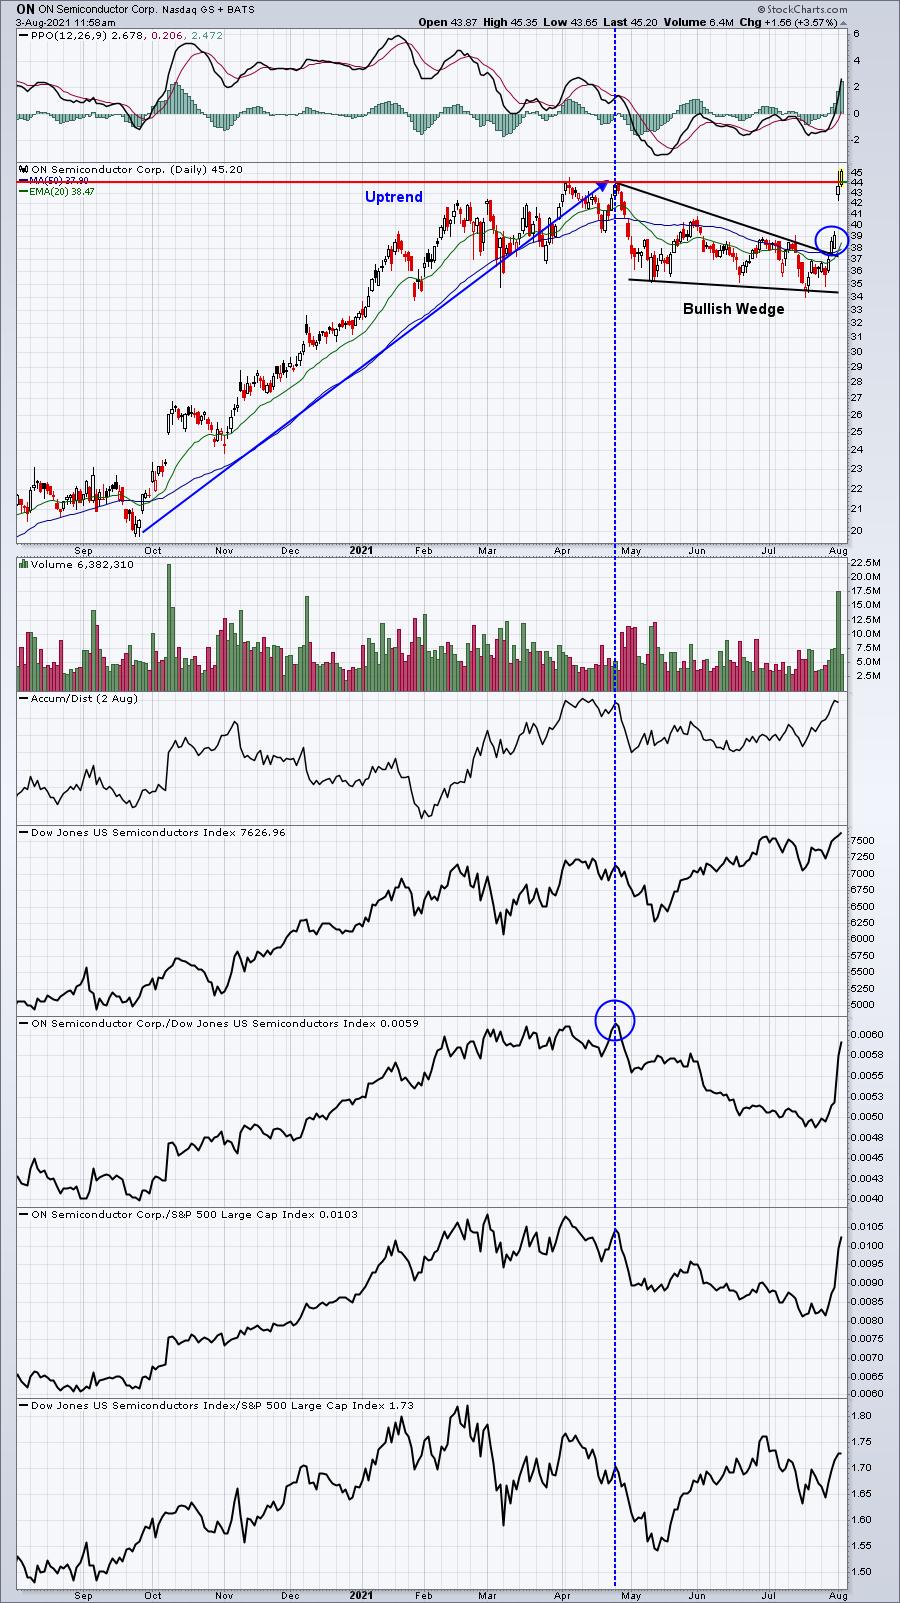
A few days ago here in the DMR, I mentioned that ON was breaking out of a bullish wedge. Now here we are with a solid earnings report under our belt and the stock breaking out. I see further gains ahead, though ON is growing very overbought in the near-term.
MYGN:
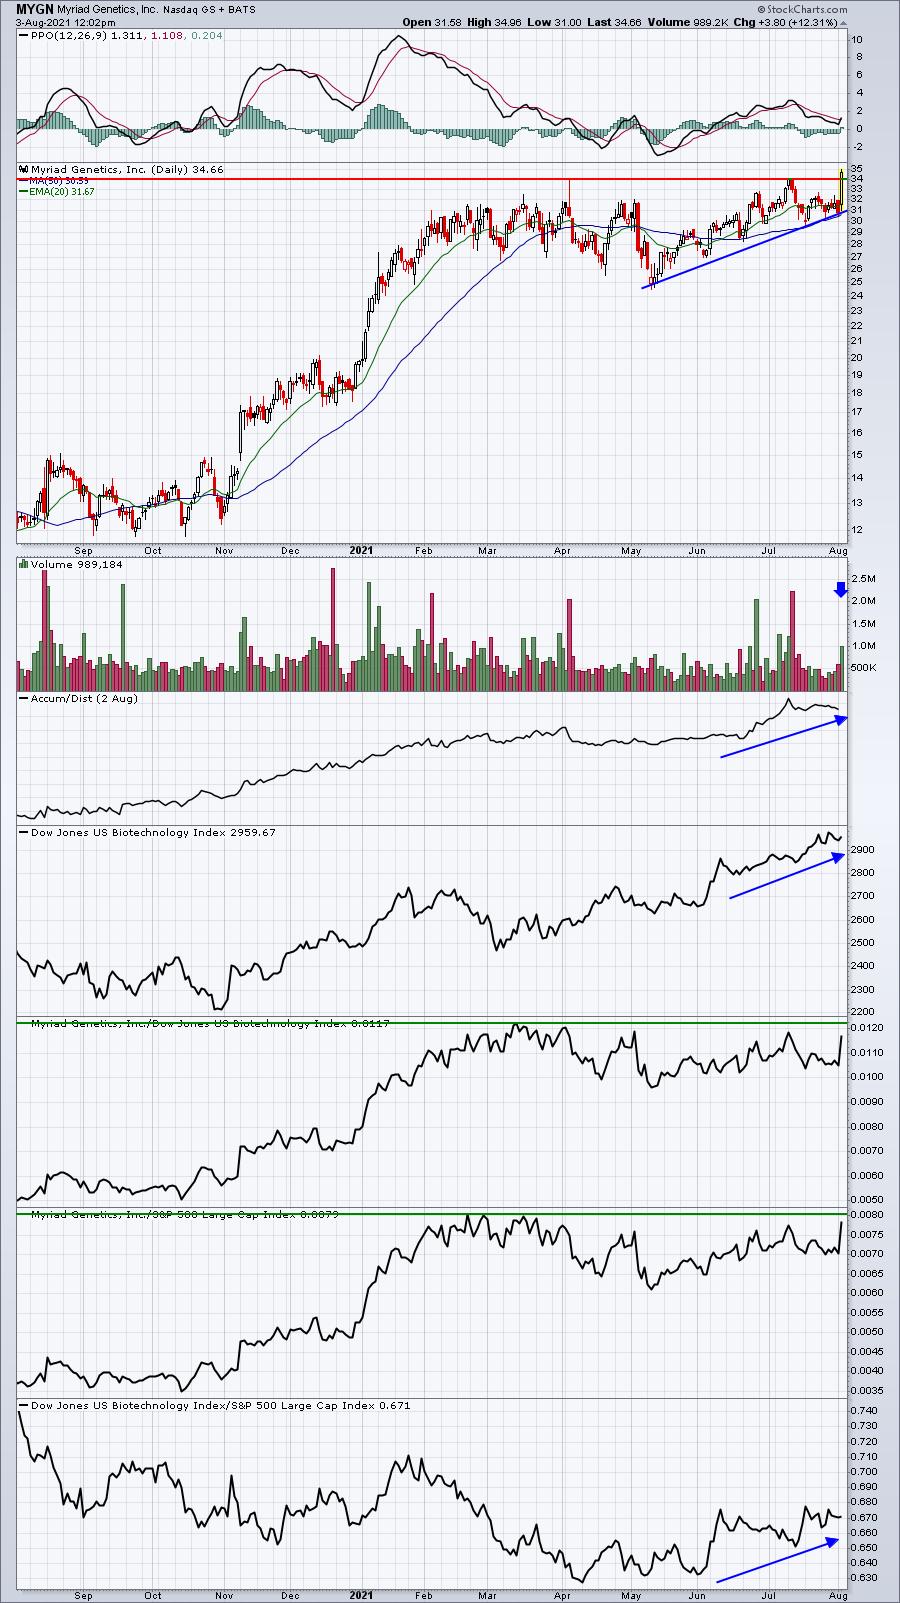
MYGN is enjoying strength in its biotech ($DJUSBT) peer group and its AD line is suggesting the stock is being accumulated by Wall Street. The only missing ingredient here is seeing MYGN break out relative to its peers. That, combined with today's breakout, would make MYGN one of the leading stocks in the group as we move forward.
Earnings Reports
Here are the key earnings reports for the next two days, featuring stocks with market caps of more than $10 billion. I also include a few select companies with market caps below $10 billion. Finally, any portfolio stocks that will be reporting results are highlighted in BOLD. If you decide to hold a stock into earnings, please understand the significant short-term risk that you are taking. Please be sure to check for earnings dates for any companies you own or are considering owning.
Tuesday, August 3:
BABA, LLY, AMGN, FIS, BP, COP, ATVI, ETN, PSA, MAR, LHX, MTCH, PRU, DD, MCHP, KKR, CMI, ZBH, PSX, AME, PEG, VERSK, WEC, ZBRA, EC, ET, WLTW, OXY, WAT, PAYC, RNG, OKE, XP, CLX, IT, XYL, ALNY, PEAK, AKAM, WMG, CZR, LYFT, DVN, J, LYV, INCY, MKL, DISCA, FICO, LDOS, BEN, FMC, FNF, DVA, HST, IPGP, HSIC, AFG, WLK, BHC, TX, UAA, SEE, H, RL, LSCC, WK, HLF, HLI, CAR, LPX, UNM, NVTA, SKLZ, AYX, SPT, SPWR, CDLX, ARNC, IGT, SABR, MIME, SWI, CWH, OMI, KTOS, EVTC, GDOT, SKT, AVID
Wednesday, August 4:
CVS, BKNG, GM, UBER, MELI, EMR, ROKU, HMC, MET, TT, KHC, EXC, EOG, EA, ALL, MFC, MPC, WCN, MCK, ANSS, SLF, MPLX, HUBS, CDW, ABC, ALB, VMC, ETSY, HZNP, FLT, TRMB, QRVO, ETR, FOXA, CRL, TXG, WDC, RCL, MGM, CDAY, AGL, HWM, GDDY, LUMN, APO, EQH, ATO, TS, BWA, LNC, IAC, JLL, WYNN, DXC, GGB, DOX, SMG, NI, UGI, WU, FRT, MRO, ADT, UTHR, APA, TNDM, NXST, RPD, ANGI, VVV, SRPT, LMND, CLH, FSLY, SPR, FTDR, VZIO, SBRA, ATRC, ACAD, KLIC, SGRY, REGI, EGHT, NSTG, NUS, ODP, BOOT, VCEL, JACK, CRTO, MVIS, TWNK, TTGT, EVRI, WLL, ELF, TVTY, ADTN, UPLD, DVAX
Economic Reports
June factory orders: +1.5% (actual) vs. +0.8% (estimate)
Happy trading!
Tom