
EB Daily Market Report - Wednesday, August 4, 2021
Executive Market Summary
- Futures were weak this morning as the July ADP employment report came in much weaker than expected
- The bond market has been very volatile today, though the 10-year treasury yield ($TNX) at last check was relatively flat
- Transports ($TRAN) remain under tremendous pressure, threatening another breakdown, though I'm watching 14,242 as closing support
- Yesterday, communication services (XLC, +0.33%) was the only sector in negative territory; today, it along with technology (XLK, +0.30%), are the only two positive sectors
- Weakness is being felt in energy (XLE, -2.53%) and consumer staples (XLP, -1.19%); industrials (XLI, -1.09%) and utilities (XLU, -1.06%) are also down more than 1%
- Commodities are mostly lower again with crude oil ($WTIC, -3.12%) dropping back to $68 per barrel
- Paycom (PAYC, +10.09%) and Moderna (MRNA, +8.61%) are two stocks benefiting from quarterly earnings results, while Avid Technology (AVID, -23.93%) and General Motors (GM, -8.67%) are being hit hard
Market Outlook
The ADP employment report came in well short of expectations, which will keep downward pressure on treasury yields and aiding growth stocks. Today's only strength is in communication services (XLC) and technology (XLK) as evidence of the market's reaction. The XLK is attempting another breakout today and we know that this sector loves the month of August. Here's the current chart:
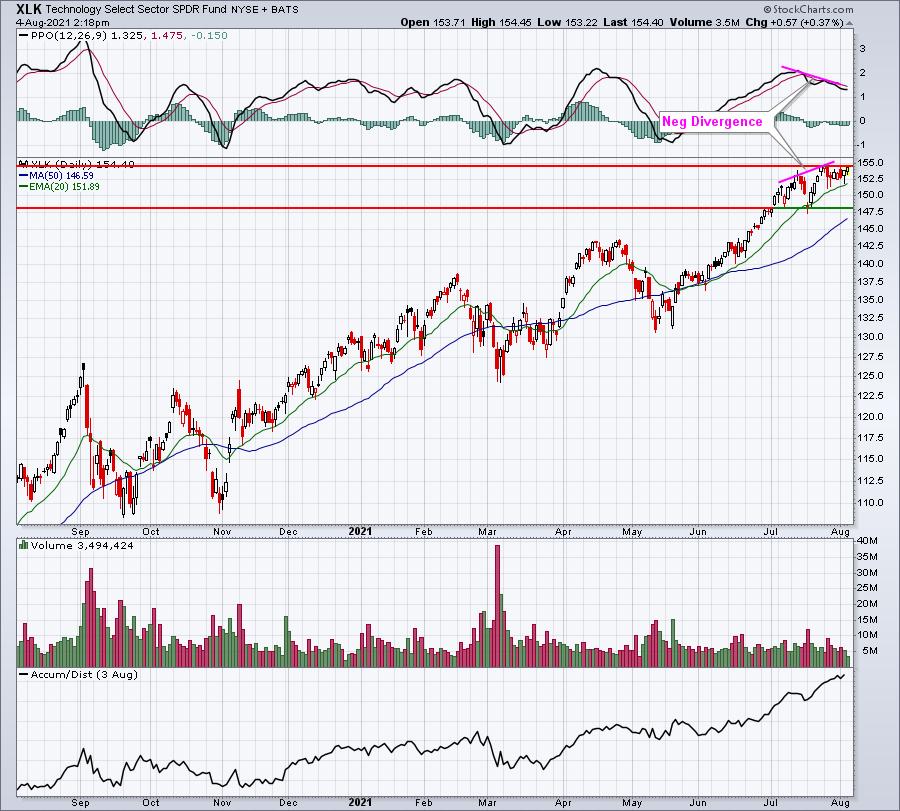
The negative divergence is a concern, but we've seen these signals of slowing momentum ignored before. If we breakout, then fail to hold the resulting support, I'd be more inclined to lighten the technology load. But let's remember that technology's best relative strength month is August. For now, I'd stay the course with technically-sound technology stocks.
Sector/Industry Focus
Crude oil prices ($WTIC) are consolidating, but it will be very telling if the mid-July low doesn't hold as support. Here are the various levels of support I'd be watching here:
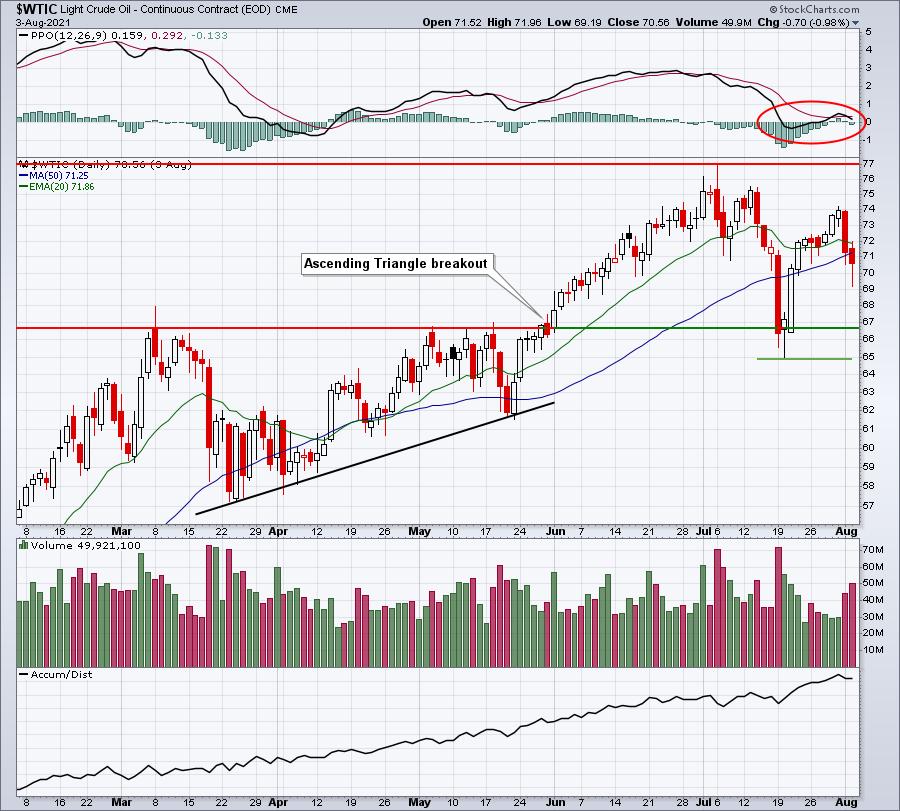
This chart does not reflect today's more than 3% drop as the WTIC only shows the prior day's close. After breaking out of its bullish ascending triangle pattern, the WTIC made its measurement to the $77 per barrel level. Since then, it's been consolidating in the range identified above. The PPO is giving no signs at this point which way this will break, but there is longer-term resistance at $77 per barrel, so I would not assume it's going to break above the recent price high.
ChartLists/Strategies
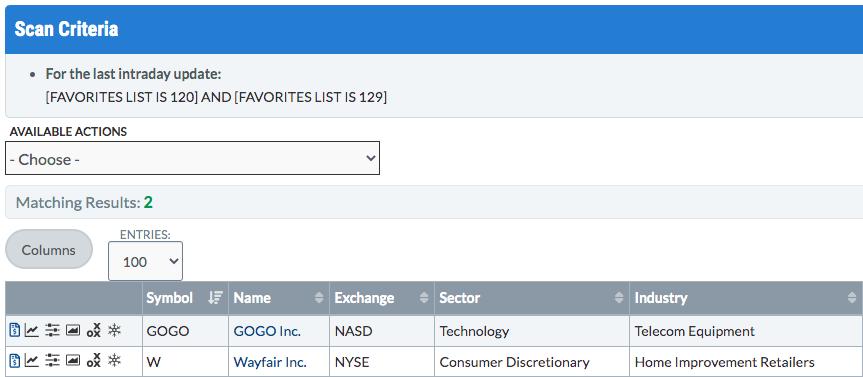
Just a quick tip. If you combine any ChartLists, you can run scans looking for common stock symbols. For instance, if I want to see which Short Squeeze ChartList (SSCL) stocks will be reporting earnings either today after the bell or tomorrow before the bell, here's the scan to run:

You cannot simply type the above into the scan engine, however. StockCharts numbers your ChartLists. So while my Short Squeeze CL is numbered 120, that's not likely the number in your StockCharts account. Therefore, if you want to run this scan, you'll have to tell the scan engine which ChartLists IN YOUR ACCOUNT that you want the scan run against.
When I run this scan, here are the heavily-shorted companies that will report earnings later today or early tomorrow morning:
One last thing to remember. Our Upcoming Earnings ChartLists only include companies with market caps > $1 billion. So if any stocks on our SSCL have market caps below $1 billion, they will not be identified above.
Earnings Reports
Here are the key earnings reports for the next two days, featuring stocks with market caps of more than $10 billion. I also include a few select companies with market caps below $10 billion. Finally, any portfolio stocks that will be reporting results are highlighted in BOLD. If you decide to hold a stock into earnings, please understand the significant short-term risk that you are taking. Please be sure to check for earnings dates for any companies you own or are considering owning.
Wednesday, August 4:
CVS, BKNG, GM, UBER, MELI, EMR, ROKU, HMC, MET, TT, KHC, EXC, EOG, EA, ALL, MFC, MPC, WCN, MCK, ANSS, SLF, MPLX, HUBS, CDW, ABC, ALB, VMC, ETSY, HZNP, FLT, TRMB, QRVO, ETR, FOXA, CRL, TXG, WDC, RCL, MGM, CDAY, AGL, HWM, GDDY, LUMN, APO, EQH, ATO, TS, BWA, LNC, IAC, JLL, WYNN, DXC, GGB, DOX, SMG, NI, UGI, WU, FRT, MRO, ADT, UTHR, APA, TNDM, NXST, RPD, ANGI, VVV, SRPT, LMND, CLH, FSLY, SPR, FTDR, VZIO, SBRA, ATRC, ACAD, KLIC, SGRY, REGI, EGHT, NSTG, NUS, ODP, BOOT, VCEL, JACK, CRTO, MVIS, TWNK, TTGT, EVRI, WLL, ELF, TVTY, ADTN, UPLD, DVAX
Thursday, August 5:
MRNA, ZTS, DUK, CI, BDX, ILMN, REGN, CVNA, TRI, MNST, APTV, BCE, AIG, SRE, PH, RMD, CNQ, MSI, IFF, NET, DDOG, EPAM, CTVA, ZG, BLL, VIAC, ED, W, EXPE, PPL, AEE, K, LNG, TECH, PODD, PBA, NICE, CAH, BIP, CGNX, AES, EVRG, ABMD, CNP, LNT, NWSA, XRAY, AVLR, OTEX, PCOR, NVAX, AMH, WRK, BKI, FND, IRM, DBX, ATH, PWR, AXON, TPL, GH, VER, LSPD, PCTY, GPOR, REG, ZNGA, LAMR, OLED, BEP, PENN, CFLT, RUN, NRG, NTRA, NTLA, BERY, YETI, FVRR, ITT, APPN, BYND, SPCE, MTZ, GIL, CHH, RBA, BRKS, JCOM, RDFN, STMP, QDEL, TDC, SYNA, TRIP, FEYE, AMN, BLDP, FSR, NOMD, ALRM, SHAK, FROG, MGNI, CARG, BAND, KTB, MUR, NKTR, YELP, RAMP, MDRX, TDS, ATSG, EB, ACMR, GPRO, IRTC, LASR, GOGO, SSYS, VRAY, GRPN, FNKO
Economic Reports
July ADP Employment Report: 330,000 (actual) vs. 700,000 (estimate)
July PMI composite: 59.9 (actual) vs. 59.7 (estimate)
July ISM services: 64.1 (actual) vs. 60.4 (estimate)
Happy trading!
Tom