
EB Daily Market Report - Thursday, August 5, 2021
Executive Market Summary
- Futures were higher overnight and our major indices opened up
- Small caps ($SML, +1.23%) are showing relative leadership today, while the larger cap S&P 500 index ($SPX, +0.40%) takes a relative breather
- Recreational services ($DJUSRQ, +6.60%) and gambling stocks ($DJUSCA, +5.61%) are both having very strong days within the consumer discretionary (XLY, +0.88%)
- Energy (XLE, +1.71%) is today's best performing sector as its recent yo-yo performance continues another day
- Health care (XLV, -0.83%) is the only sector with any significant weakness as health care providers ($DJUSHP, -3.49%) are selling off
- Cigna (CI, -11.25%) is pushing many health care provider stocks lower despite beating both revenue and EPS estimates; CI trails only Cardinal Health (CAH, -14.06%), another health care stock, among S&P 500 stocks
- Gambling stocks Penn National (PENN, +9.37%) and Wynn Resorts (WYNN, +8.17%) are the best S&P 500 performers
Market Outlook
There are a lot of investors and traders very interested in what will happen to commodities like oil ($WTIC), gold ($GOLD), and copper ($COPPER). I tend to only trade on the long side during secular bull markets like the one we're in now, so I'd only be interested in the long side of the commodity trade. But I only like commodities relative to the benchmark S&P 500 if the U.S. Dollar (UUP) is likely to weaken. Here's the current 5-year weekly chart on the UUP:
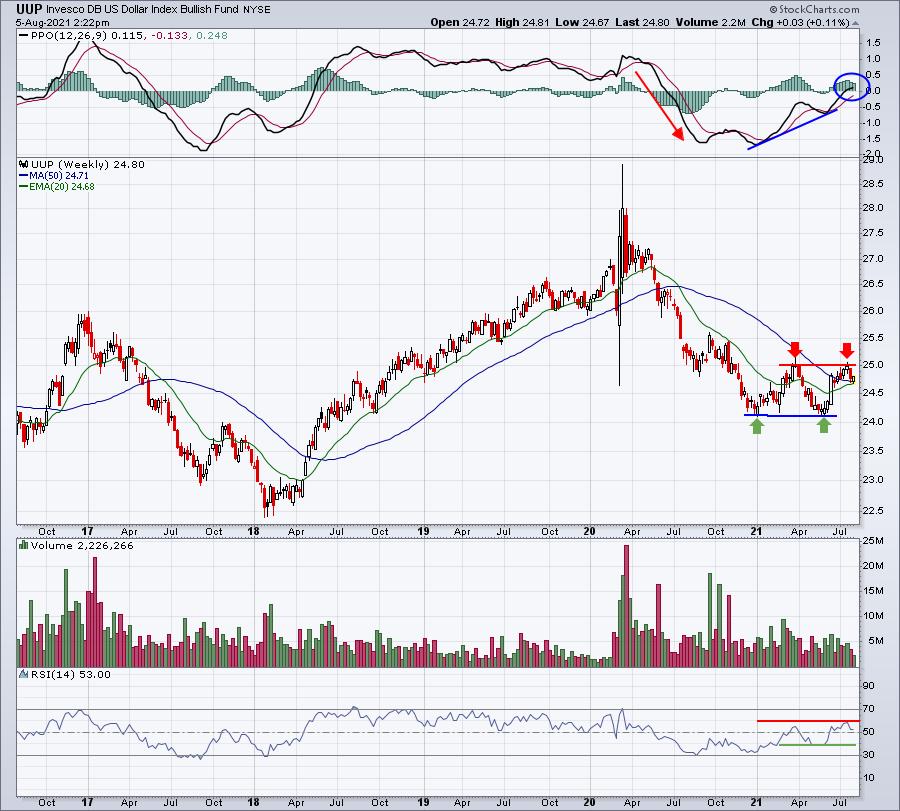
We've seen a number of fluctuations and choppy action on the daily chart, but here on the weekly chart, I believe key price support and resistance are evident. The double bottom is near 24.10 with a positive divergence accompanying it. The double top is at 25 with that second high rising above the 52-week SMA. The weekly PPO has moved back above the zero line for the first time in more than a year. This is signaling more bullish momentum from a longer-term perspective. A price breakout above 25 would confirm this signal.
Finally, check out the weekly RSI. Key support is typically at 40 during a bullish phase, while key resistance is usually at 60 during a bearish phase. Right now, the weekly RSI cannot make up its mind. We're truly in a stalemate right now. For me, deciding whether to trade commodities absolutely is based on which way the dollar decides to go.
Sector/Industry Focus
Yesterday, I wrote about crude oil prices ($WTIC), which have weakened considerably in recent weeks. Today, let's talk about the impact, which is the energy sector (XLE). The XLE is currently downtrending below its declining 20-day EMA, a short-term bearish trend for sure. So I want to see either a breakout above that 20-day EMA OR see a positive divergence emerge on a move back to test the April low near 46:
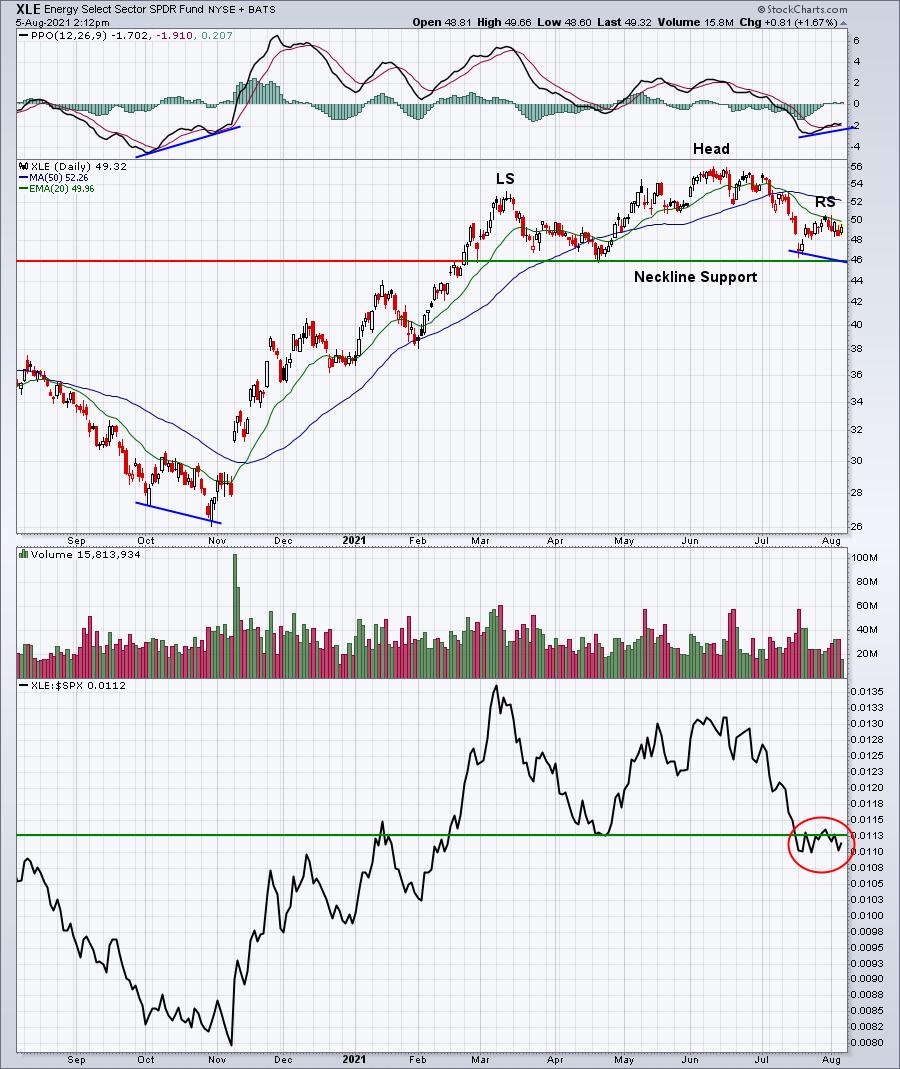
We've already seen the XLE lose relative support vs. the S&P 500, a bearish development. There's a topping head & shoulders pattern in place. While I don't typically look for bearish patterns to execute in a secular bull market, we need to at least remain open to the possibility. One very positive factor here is that IF the XLE does violate the July price low and tests 46 price support from April, it's likely to occur with a positive divergence printing. So while the short-term is most definitely dicey for energy, there is still hope for it to right the ship.
One other factor that MUST be considered is the direction of the U.S. Dollar (UUP). Currently, the UUP is consolidating after the recent negative divergence (illustrated in the Market Outlook section above), but I'm still bullish the dollar. If I'm right and the dollar pushes to new highs later in 2021, the recent relative breakdown in the XLE will likely worsen.
ChartLists/Strategies
As I was flipping through charts on our various ChartLists, here were 3 that looked interesting technically:
HUM (from August Seasonality ChartList):
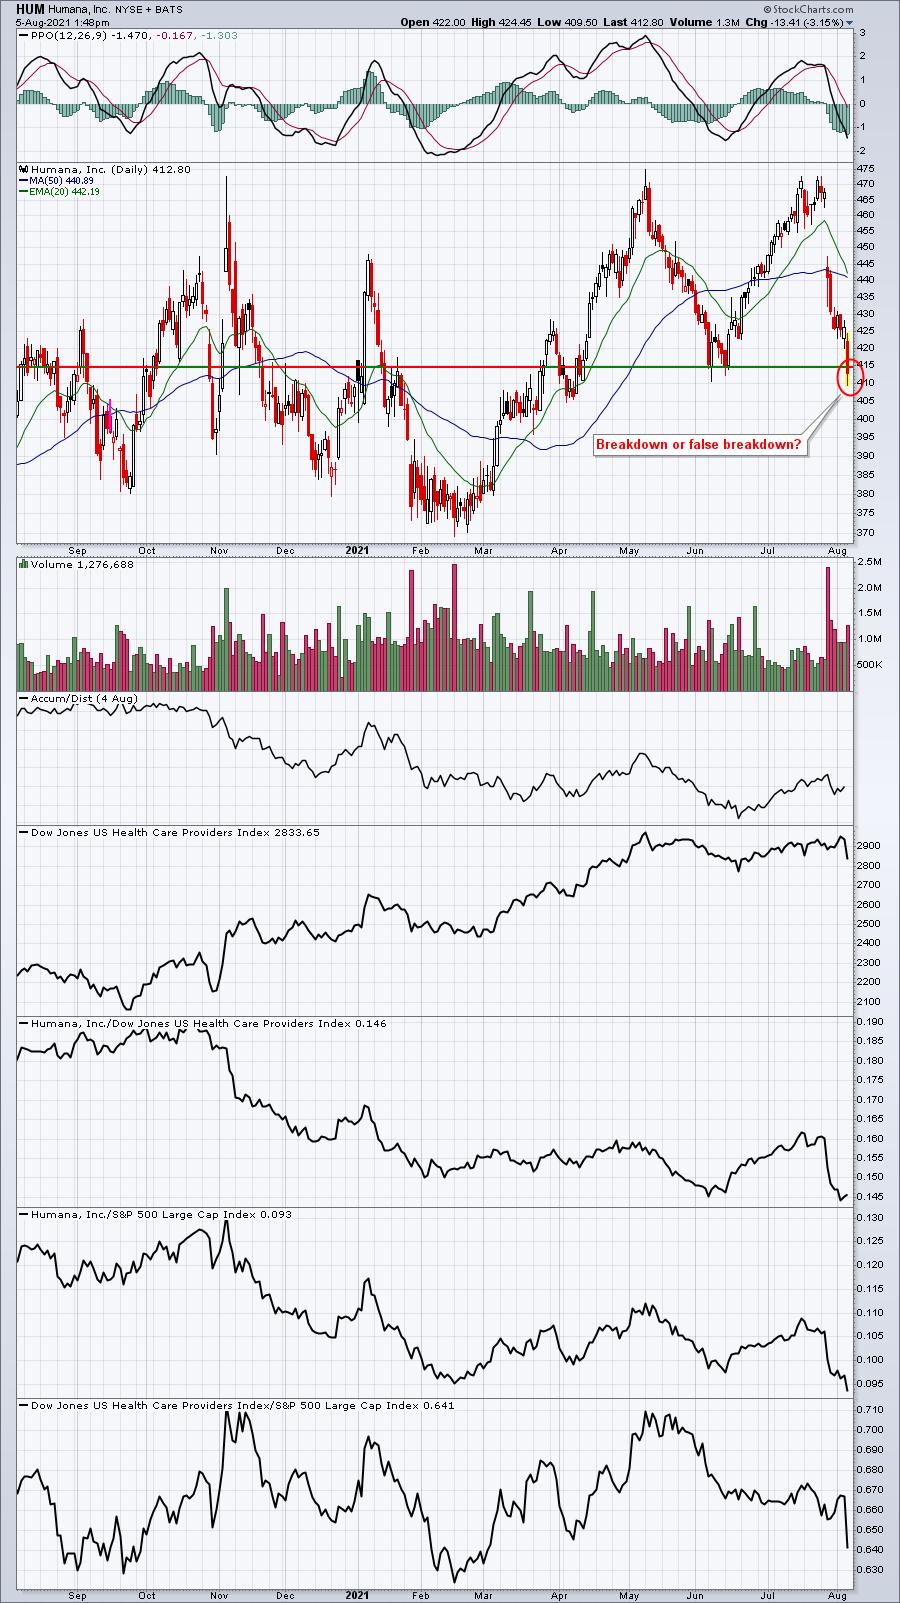
Today will be interesting from a closing perspective. I've pointed out on many, many occasions how false breakdowns can mark important short-term bottoms and false breakouts can mark important short-term tops. The AD line and relative weakness tell me to be extremely careful if support doesn't hold on today's close. But, if it does, we could see a short-term rebound, an excellent opportunity for a short-term trade. If you take a position intraday, I'd be sure to exit if today's low is violated. It's also important to note that HUM is in the health care providers industry, which is getting hammered today.
MSTR (from Short Squeeze ChartList):
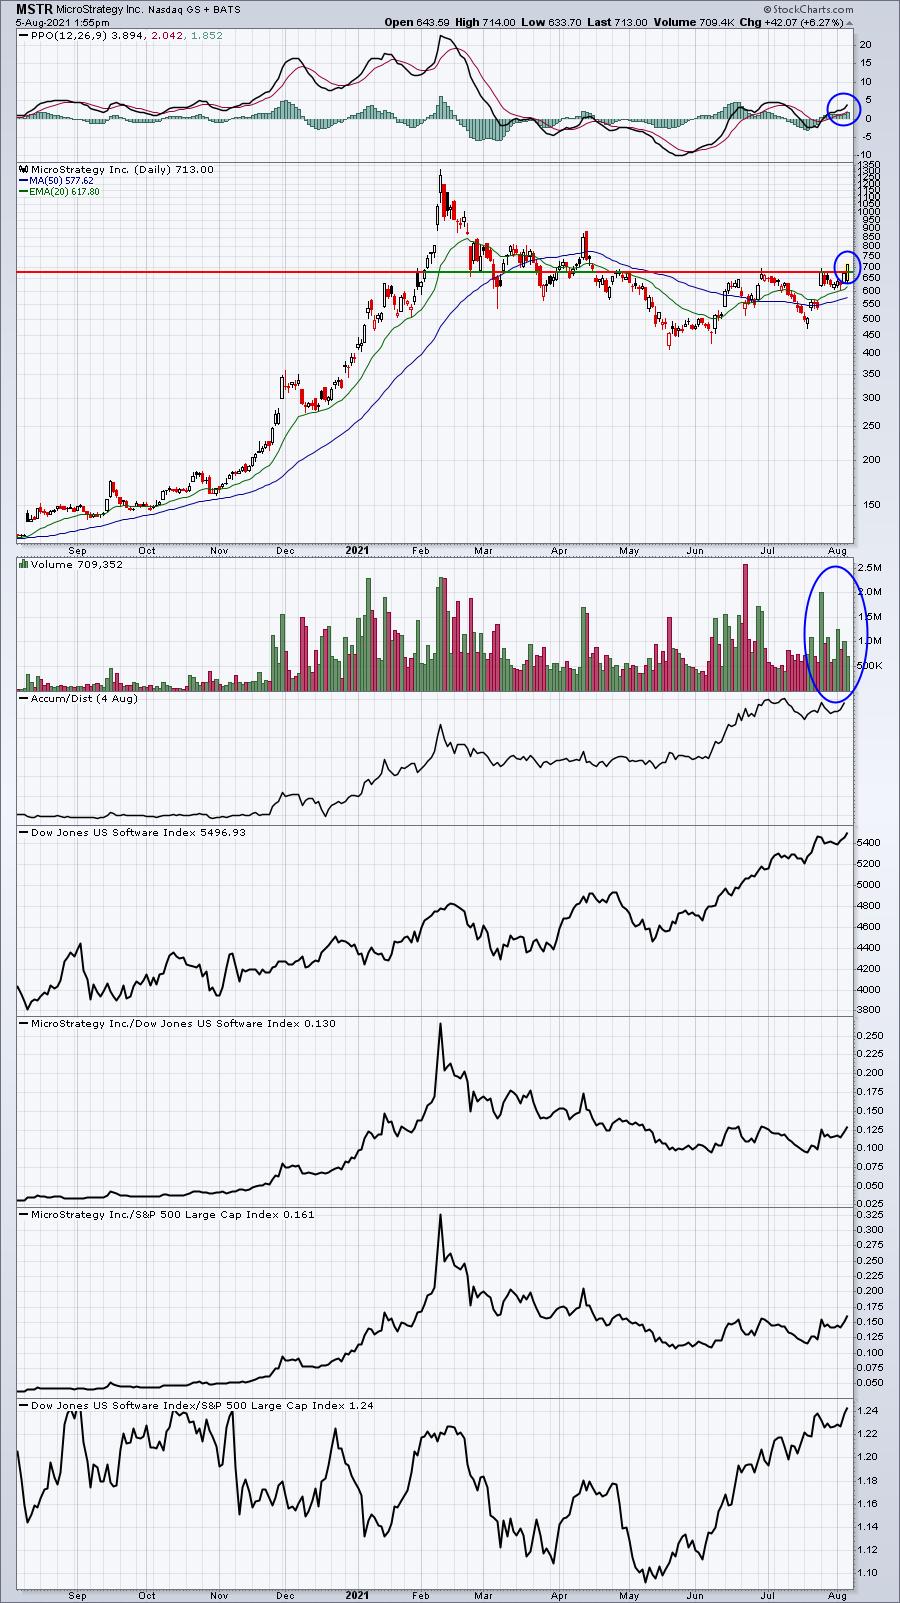
MSTR was featured more in July than in our August Seasonality report, but it remains heavily shorted and the breakout has been accompanied by strong volume. It's also a bit of a rarity in that its AD line is exceptionally strong. Most Short Squeeze ChartList (SSCL) stocks have weak AD lines.
MOH (from Raised Guidance ChartList):
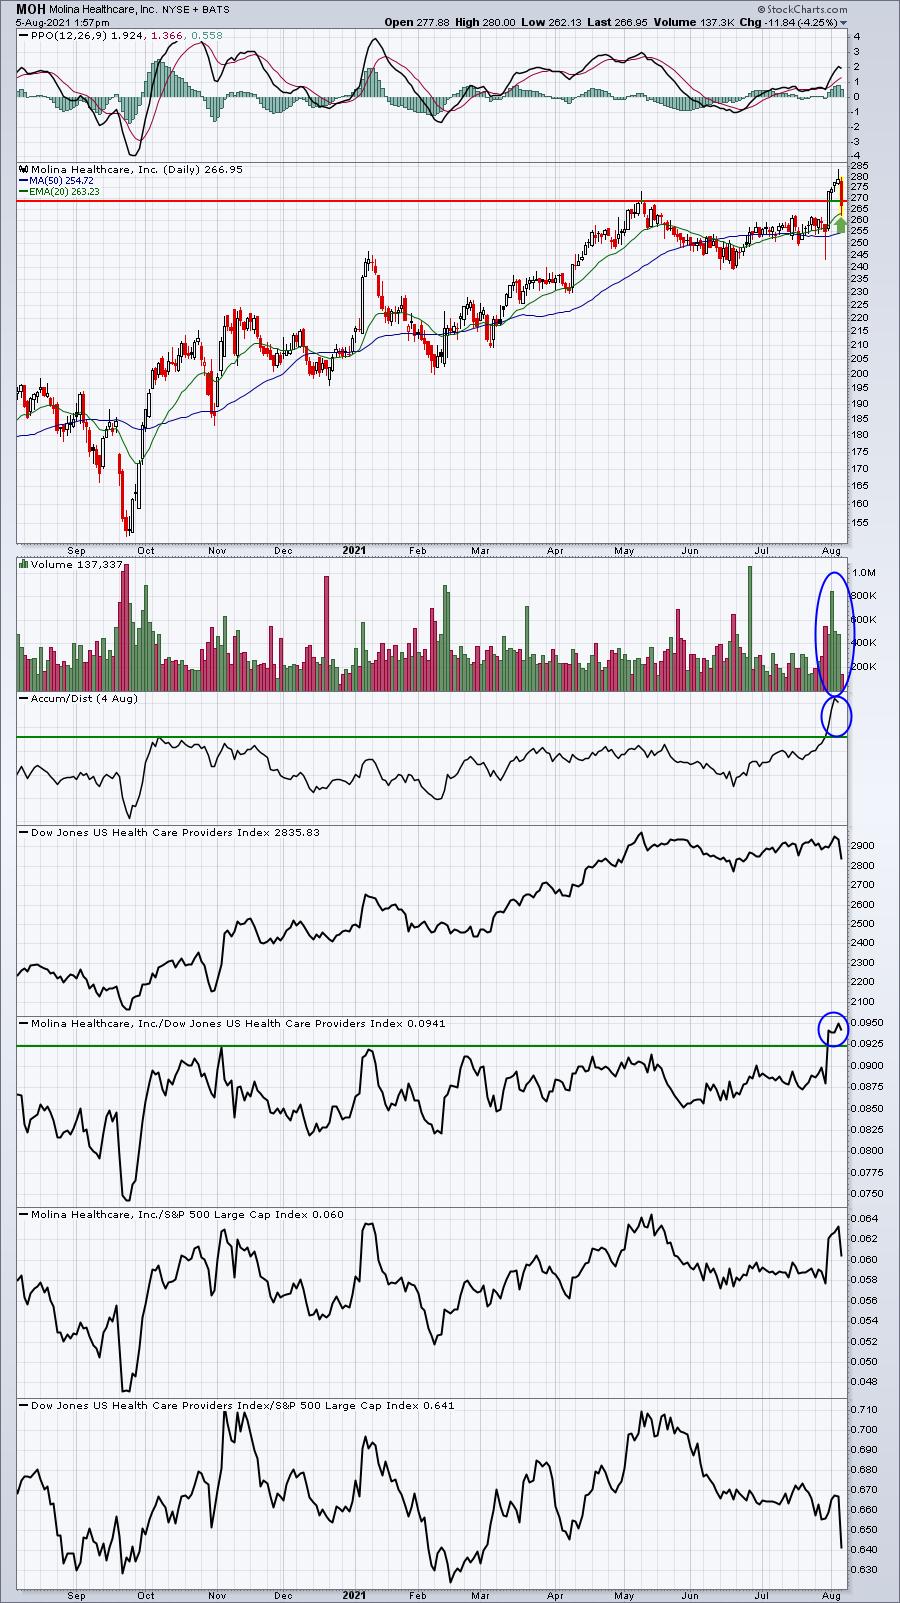
The only real negative that I see on this pullback is that health care providers ($DJUSHP) have moved to a 5-month relative low vs. the S&P 500. Otherwise, MOH looks quite solid as a short-term trade on this pullback. Recent price resistance should help to serve as support, as well as the rising 20-day EMA, which is where MOH bounced earlier. A close beneath the 20-day EMA and I'd be cautious because of the industry group's relative weakness. MOH, however, recently hit a 52-week relative high vs. its peers and its AD line also soared to a fresh, new high.
Earnings Reports
Here are the key earnings reports for the next two days, featuring stocks with market caps of more than $10 billion. I also include a few select companies with market caps below $10 billion. Finally, any portfolio stocks that will be reporting results are highlighted in BOLD. If you decide to hold a stock into earnings, please understand the significant short-term risk that you are taking. Please be sure to check for earnings dates for any companies you own or are considering owning.
Thursday, August 5:
MRNA, ZTS, DUK, CI, BDX, ILMN, REGN, CVNA, TRI, MNST, APTV, BCE, AIG, SRE, PH, RMD, CNQ, MSI, IFF, NET, DDOG, EPAM, CTVA, ZG, BLL, VIAC, ED, W, EXPE, PPL, AEE, K, LNG, TECH, PODD, PBA, NICE, CAH, BIP, CGNX, AES, EVRG, ABMD, CNP, LNT, NWSA, XRAY, AVLR, OTEX, PCOR, NVAX, AMH, WRK, BKI, FND, IRM, DBX, ATH, PWR, AXON, TPL, GH, VER, LSPD, PCTY, GPOR, REG, ZNGA, LAMR, OLED, BEP, PENN, CFLT, RUN, NRG, NTRA, NTLA, BERY, YETI, FVRR, ITT, APPN, BYND, SPCE, MTZ, GIL, CHH, RBA, BRKS, JCOM, RDFN, STMP, QDEL, TDC, SYNA, TRIP, FEYE, AMN, BLDP, FSR, NOMD, ALRM, SHAK, FROG, MGNI, CARG, BAND, KTB, MUR, NKTR, YELP, RAMP, MDRX, TDS, ATSG, EB, ACMR, GPRO, IRTC, LASR, GOGO, SSYS, VRAY, GRPN, FNKO
Friday, August 6:
D, MGA, VTR, DKNG, NUAN, LEA, NCLH, CGC, SRCL, TWST, MGP, VNT, NEO, ESNT, GT, SPB, CRON, FLR
Economic Reports
Initial jobless claims: 385,000 (actual) vs. 399,000 (estimate)
Happy trading!
Tom