
EB Daily Market Report - Friday, August 6, 2021
Executive Market Summary
- Futures were mostly higher, though the NASDAQ lagged at the opening bell
- A stronger-than-expected July nonfarm payrolls report sent money rotating back out of treasuries, which drove the 10-year treasury yield ($TNX) up 7 basis points to 1.29%
- The TNX has moved back above its declining 20-day EMA for the first time in more than 6 weeks, buoying financials (XLF, +1.94%), today's top performing sector
- Consumer discretionary (XLY, -0.55%) and technology (XLK, -0.17%) suffered on a relative basis given the rising TNX
- The U.S. dollar strengthened considerably (UUP, +0.61%), though energy (XLE, +1.33%) and materials (XLB, +1.24%) have avoided the rising dollar headwinds - at least for today
- Expedia (EXPE, -7.04%) is the worst performing S&P 500 stock after reporting mixed results; its loss was greater than expected, while revenues beat expectations
- The strong jobs report and rising dollar have had a very negative effect on gold ($GOLD, -2.40%) and silver ($SILVER, -3.61%)
Market Outlook
In a normal bear market, we see job growth slowly rolling over and then turning negative. This generally happens over many months. or even a couple years. The stock market will anticipate the return of economic strength and begin heading higher BEFORE the worst job news hits. The following chart will help to illustrate both of these concepts:
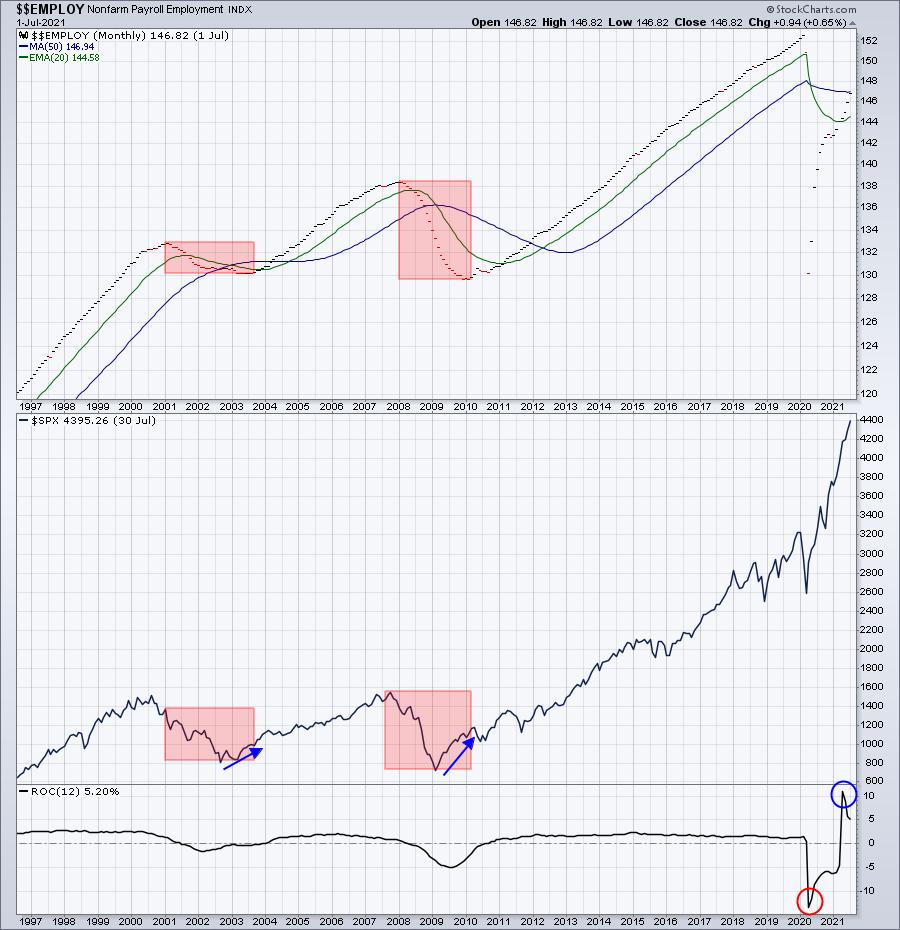
The red-shaded boxes highlight both of these points. As jobs begin to decline, the stock market goes down right with it. But notice in both 2002 and 2009, the S&P 500 begins to rally months before the actual bottom in jobs cycle. Hopefully, this helps you to visualize the "stock market looks ahead 6-9 months" mantra. It's the reason why most individuals do not understand the stock market and always feel as though the cards are stacked against them. Stock market behavior and economic fundamentals do not go hand in hand. It's so important to follow the charts because that's where the truth lives. Why in the world would the stock market begin turning higher while jobs data keeps getting worse and worse? But technicians do not ask "why" questions. It doesn't make common sense, but it's how the stock market works. The sooner you embrace technical analysis, the better you'll understand what's truly happening in the stock market.
Sector/Industry Focus
The rise in treasury yields today is EXACTLY what the bank doctor ordered. This group was not only falling with treasury yields, but it also was underperforming the benchmark S&P 500 big time. Fortunately, today's action appears to be breaking its downtrend as the TNX is rallying from its potential double-bottom pattern:
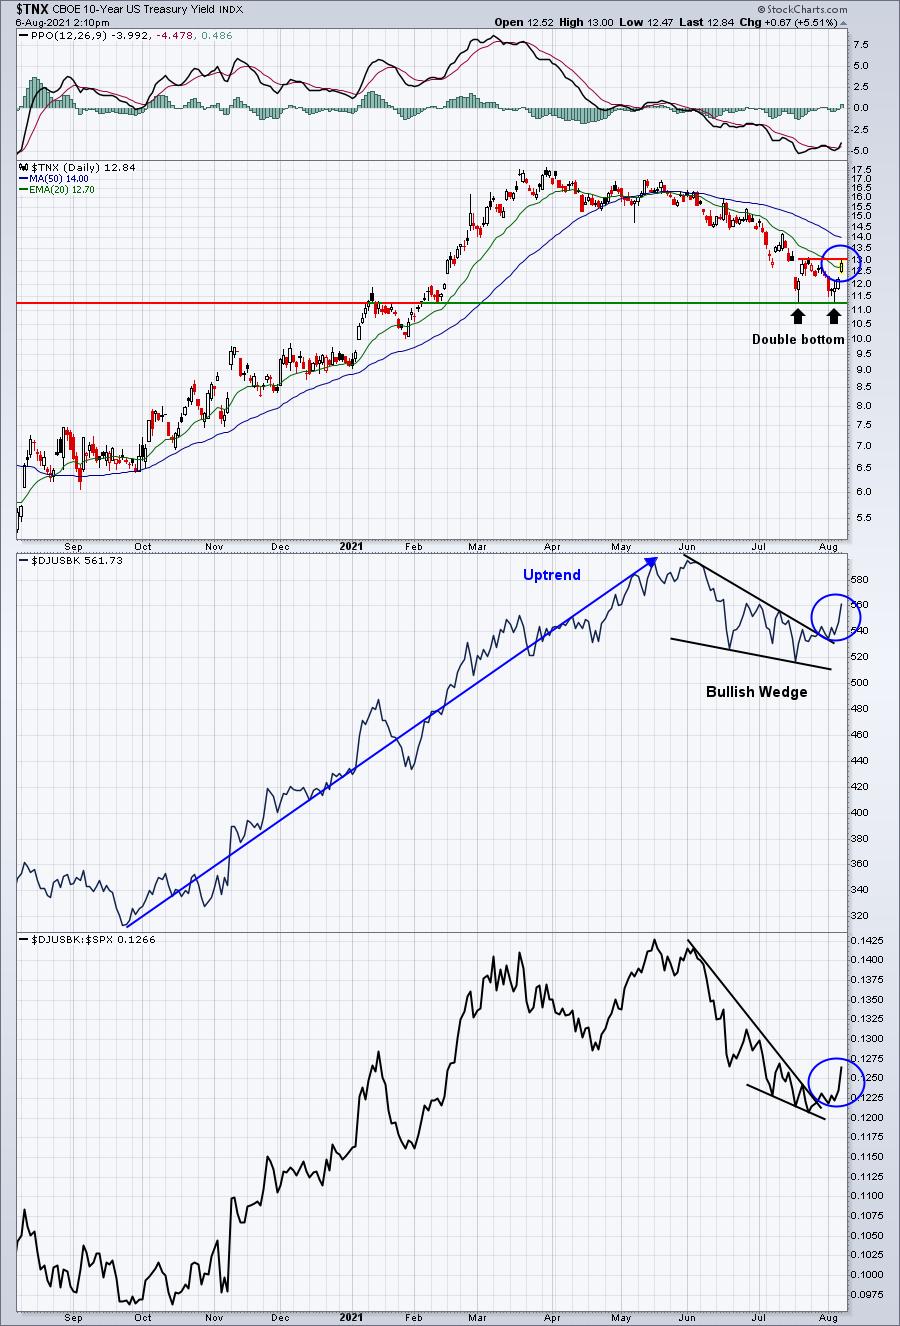
The bullish case for financials right now is that the TNX is not going back below the double bottom that's been established. Therefore, if that level gives way, then all bets are off for financial stocks near-term.
ChartLists/Strategies
Given the strong jobs report and return of financial leadership - at least in the very near-term - should we be considering financial stocks for short-term trades? I'd say absolutely yes. There's certainly no guarantee that financials continue to perform well, but the stock market has been fearful that economic strength ahead might not be what everyone was looking for. Today's jobs report would seem to underscore the fact that our economy is strengthening. That, in turn, SHOULD result in higher treasury yields and improving financials.
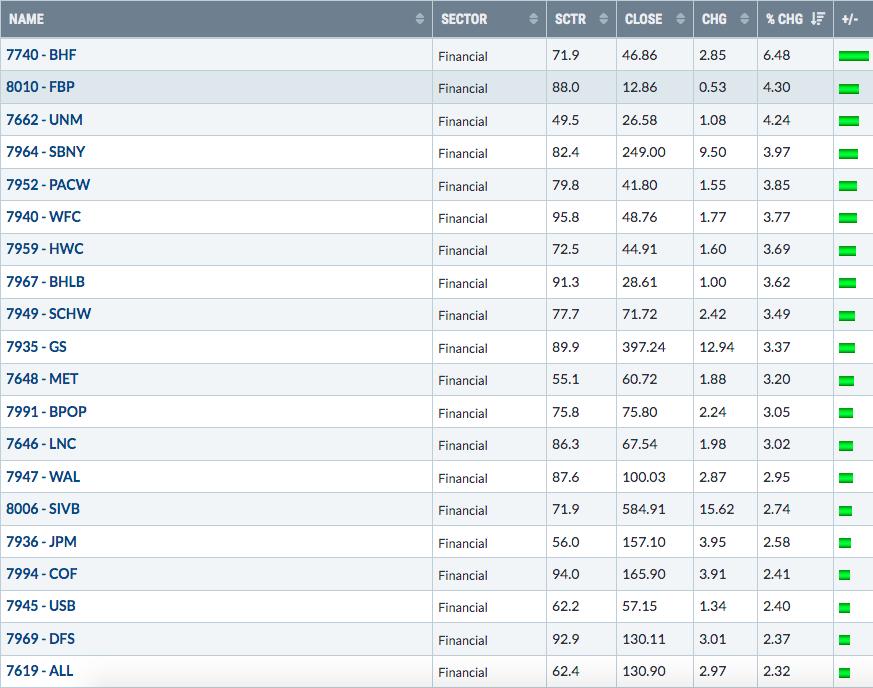
I reviewed our Strong Earnings ChartList (SECL) by first sorting it by "financial" using the "Summary" drop-down option. I don't know how many financial stocks we have on our SECL, but only 4 are lower today. BX is the worst performer, falling 1.39%. Meanwhile, there are 13 stocks in this sector that have gained at least 3%. I looked through all of these charts to see which we might consider for short-term trades. First, I'll show you the ChartList in "Summary" form, followed by 2 interesting charts in the sector:
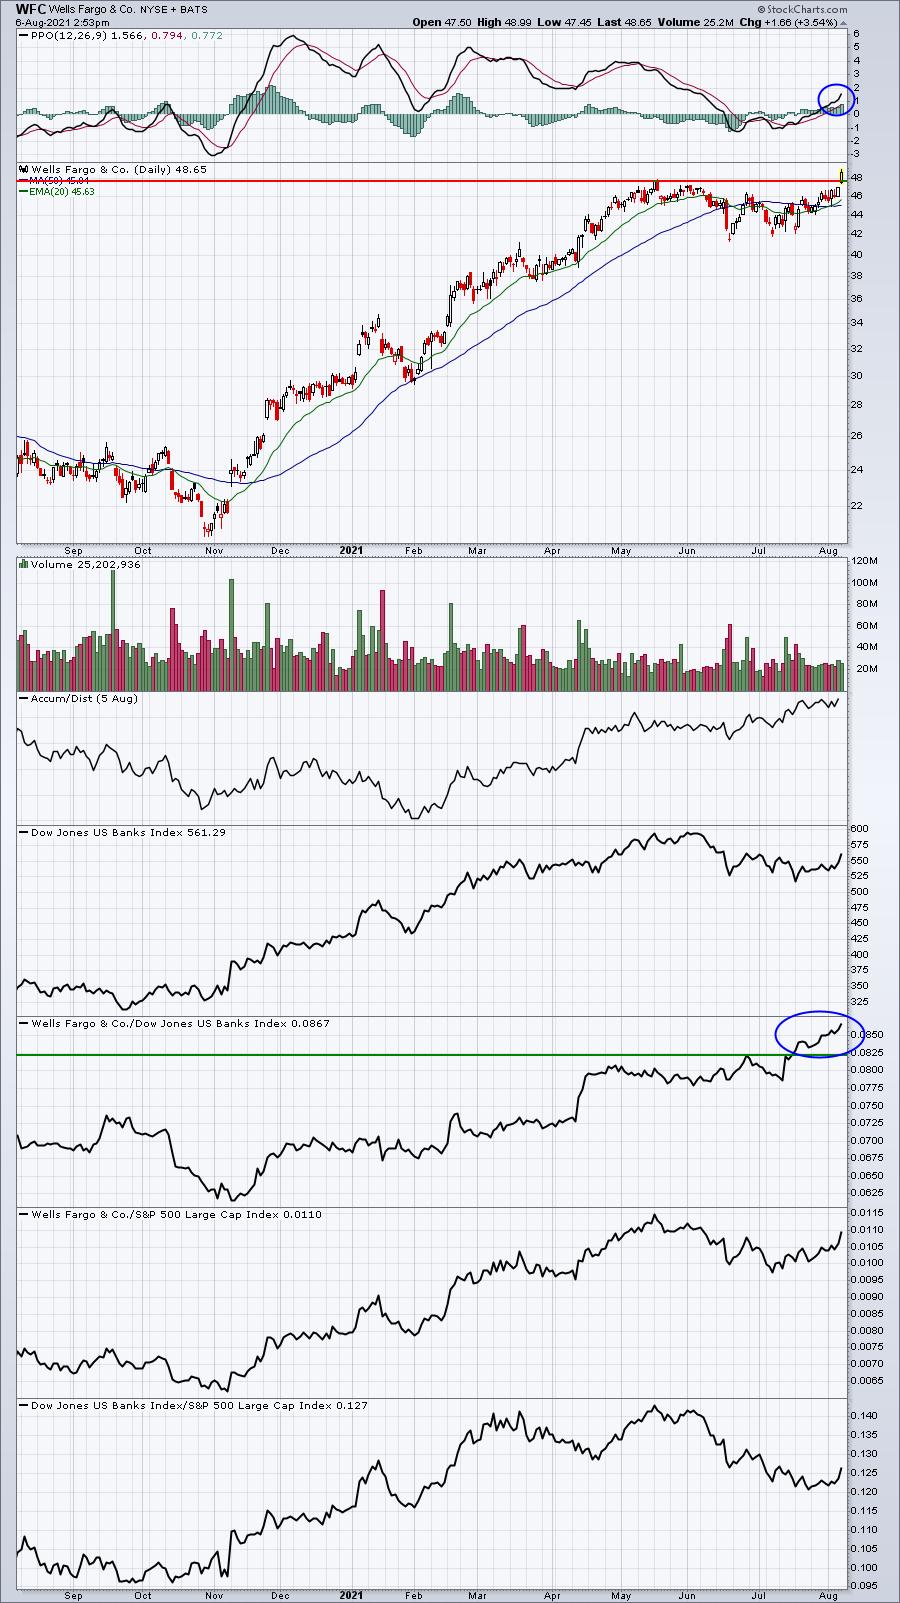
WFC:
I've said for awhile that WFC is one of the best banks now. Its relative strength has been gaining for several months now and the first day we see tailwinds from treasury yields, WFC breaks out to a new high. I believe this one is a staple for most portfolios:
GS:
Ditto WFC. GS is a leader amongst investment services ($DJUSSB) and is breaking out on the first sign of good news for financials. That's tough to argue against:
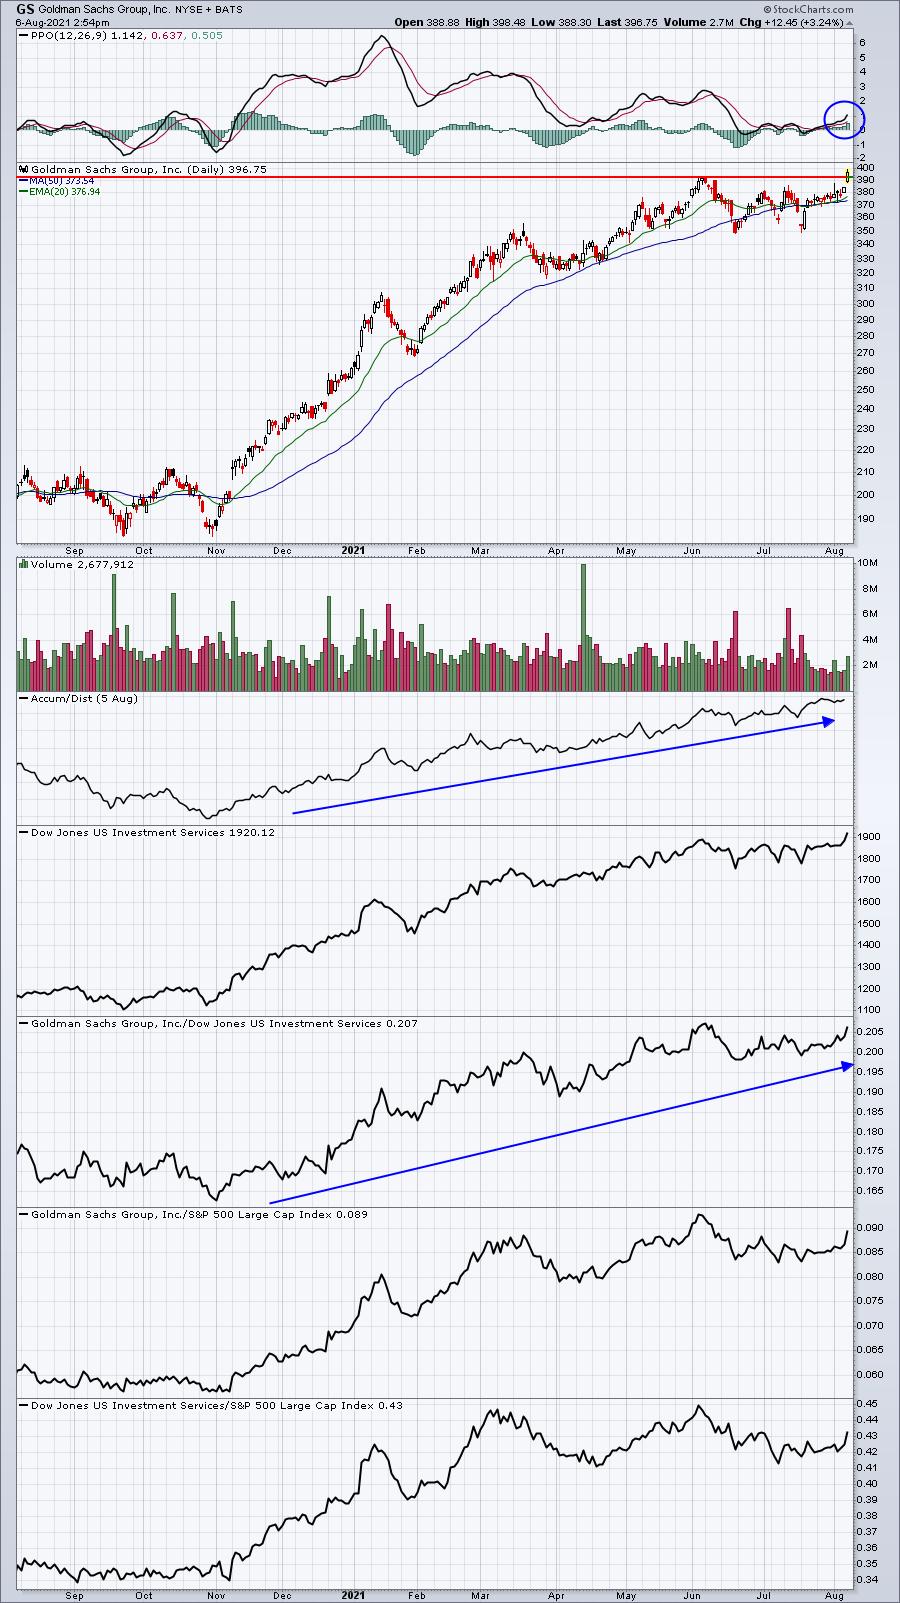
If either or both fail to hold breakouts into the close, it could suggest a bit more consolidation. However, I'd still remain VERY bullish both stocks because of their excellent relative strength.
In addition to these two stocks in banks and investment services, respectively, I'd also consider DFS and COF in the consumer finance area ($DJUSSF). While their charts are not featured, both have excellent relative strength AND very strong AD lines, just as WFC and GS do, and are either breaking out or threatening to.
Earnings Reports
Here are the key earnings reports for the next two days, featuring stocks with market caps of more than $10 billion. I also include a few select companies with market caps below $10 billion. Finally, any portfolio stocks that will be reporting results are highlighted in BOLD. If you decide to hold a stock into earnings, please understand the significant short-term risk that you are taking. Please be sure to check for earnings dates for any companies you own or are considering owning.
Friday, August 6:
D, MGA, VTR, DKNG, NUAN, LEA, NCLH, CGC, SRCL, TWST, MGP, VNT, NEO, ESNT, GT, SPB, CRON, FLR
Monday, August 9:
BNTX, APD, TTD, GOLD, NTR, TSN, DISH, STE, ELAN, VTRS, OSH, ZLAB, AMC, CHGG, CABO, CF, PEN, PLNT, ELY, APPS, SGMS, EVBG, SAIL, JOBS, QLYS, CRNC, TGNA, DDD, FLGT, CBT, RIOT, INO, PRPL, SENS, WKHS, MODN, PGEN
Economic Reports
July nonfarm payrolls: 943,000 (actual) vs. 900,000 (estimate)
July private payrolls: 703,000 (actual) vs. 750,000 (estimate)
July unemployment rate: 5.4% (actual) vs. 5.7% (estimate)
July average hourly earnings: +0.4% (actual) vs. +0.3% (estimate)
Happy trading!
Tom