
EB Daily Market Report - Monday, August 9, 2021
ChartList Update
We've updated the Raised Guidance ChartList (RGCL) through the middle of last week. The link on the website hasn't been updated yet, but it will be updated by this evening at the latest. Thousands of companies have reported over the past couple weeks, so we're working hard to get key ChartLists updated. I'm hoping to have the Strong Earnings ChartList (SECL) and Strong Future Earnings ChartList (SFECL) updated through the middle of last week by tomorrow.
Executive Market Summary
- Futures were mixed to open the week as last week's jobs report and thousands of earnings reports are being digested
- The 10-year treasury yield ($TNX) is up another 3 basis points to 1.32% today, despite no new economic news
- The rise in treasury yields benefits financials (XLF, +0.58%), so the leadership there today shouldn't be a surprise
- Meanwhile, crude oil prices ($WTIC, -2.46%) have dropped below $67 per barrel, its lowest level since mid-July; a fall below $65 per barrel would likely trigger more significant selling in energy
- Energy (XLE, -1.23%) continues to perform poorly as it's the only sector that's been lower over 1-week, 1-month, and 3-month periods
- The Dow Jones and S&P 500 opened fractionally lower today, while the NASDAQ shows relative strength
- Autos ($DJUSAU, +1.80%) are getting a lift from an upgrade of Tesla (TSLA, +2.50%)
- Full line insurance ($DJUSIF, +1.63%) is leading the financial group higher, printing what appears to be the right side of a bullish cup - see more below
- Air Products and Chemicals (APD, -5.13%) is the worst S&P 500 performer after posting EPS below consensus estimates
Market Outlook
If we ignore seasonality (weak summer months) and concentrate solely on technical conditions, it certainly appears as though the S&P 500 is regaining strength after its recent period of consolidation. Check out this hourly chart:
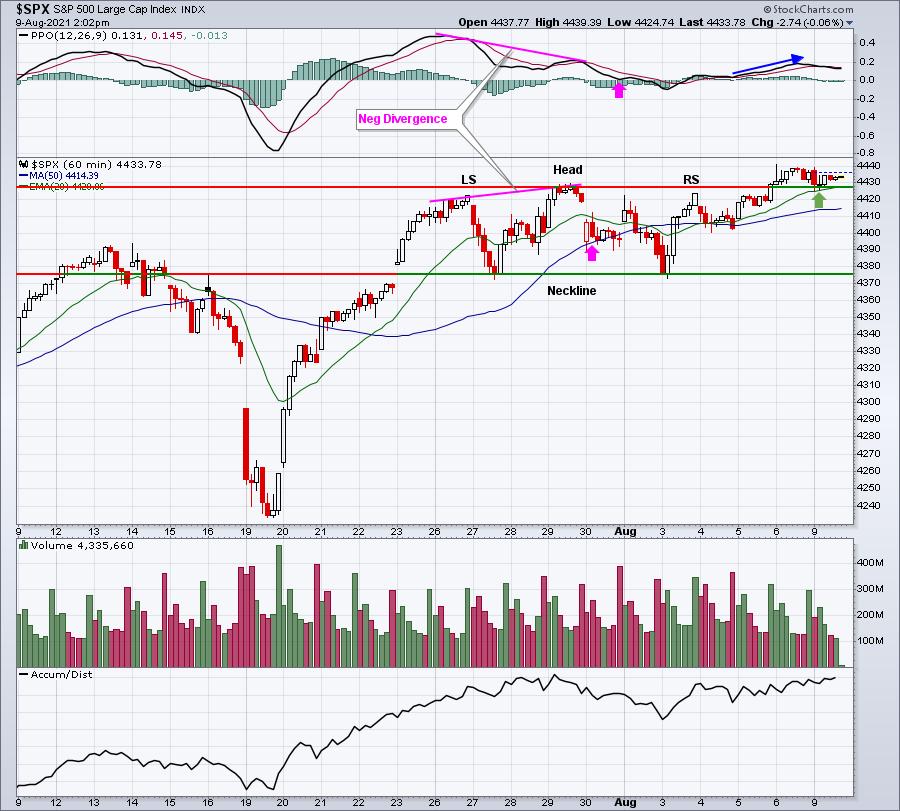
There's a lot we can discuss on just this one chart. First, I've said many times before that bearish topping patterns should generally be ignored in a bull market.....until we actually see a breakdown. Never assume a bearish pattern will result in bearish action. The above chart illustrates this point. There's a clear topping head & shoulders pattern in play, yet it never executed and instead, we broke higher. There's also a negative divergence in play here that suggesting momentum, on an hourly basis, had slowed and consolidation or weakness was to be expected. We saw that consolidation unfold as a 50-hour SMA test and a PPO centerline test (pink arrows) occurred. Now, we have prices breaking back to fresh new highs and the hourly PPO on the rise again. That typically results in 20-hour EMA support (green arrow) on any short-term pullbacks, which is exactly what we saw earlier this morning.
Sector/Industry Focus
Full line insurance ($DJUSIL) is in the midst of a bullish consolidation pattern. The group was leading the S&P 500 earlier in 2020, but its relative strength deteriorated as it consolidated. It's beginning to regain that relative strength, which will likely strengthen further when the group breaks out:
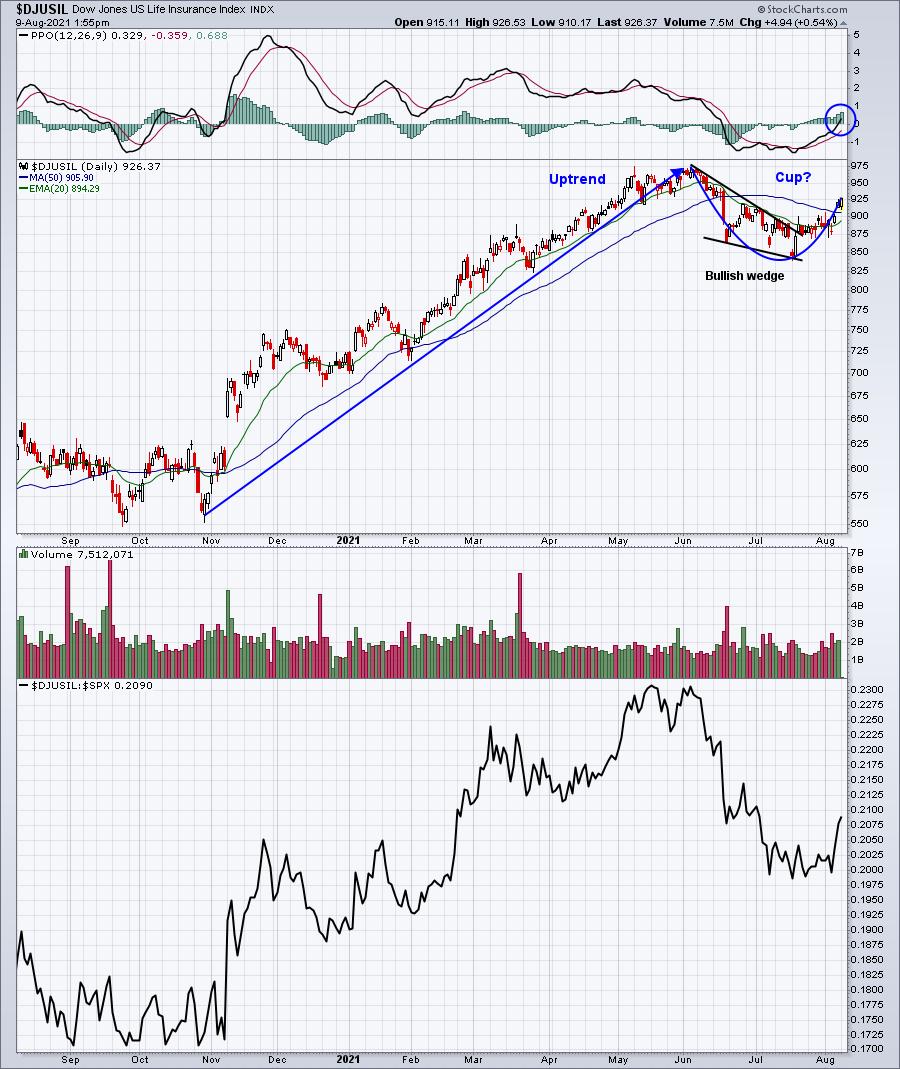
Different technicians might see different things. In addition to the right side of a possible cup forming right now, an argument could be made that we've already seen a bullish wedge breakout that followed the prior uptrend. The fact that the daily PPO has turned higher and has crossed its centerline supports the idea that the current bullish momentum likely is just beginning.
ChartLists/Strategies
We've just updated our Raised Guidance ChartList, so I thought I'd share a few charts from this ChartList that could be setting up for profitable trades:
AAN:
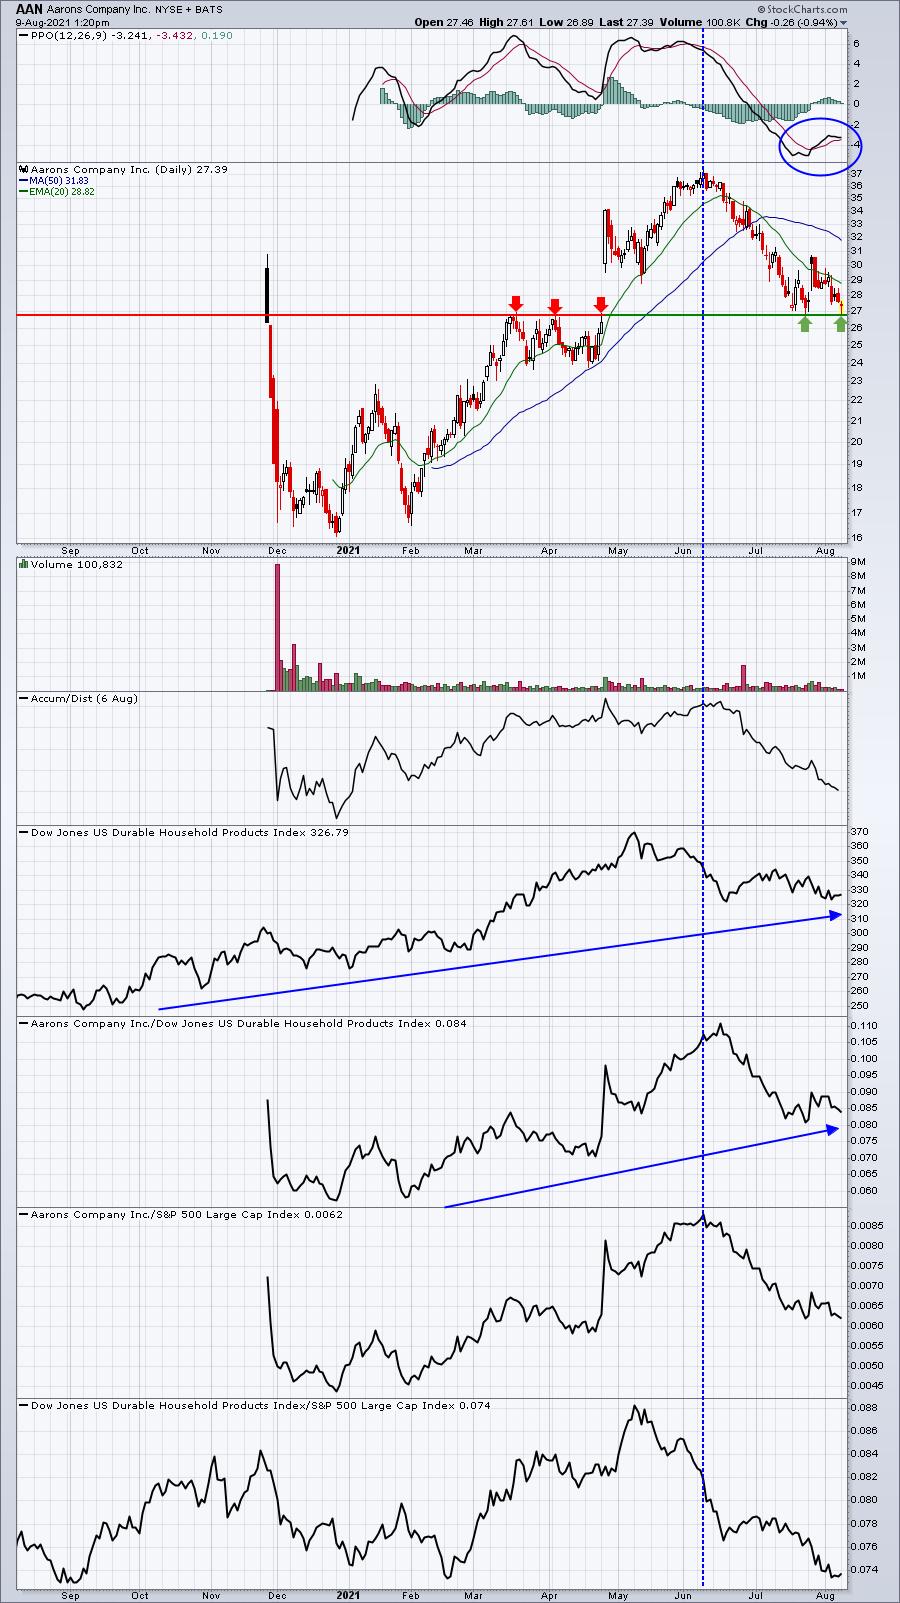
AAN was a relative leader among its peers when it was at its recent price high. The selloff has been harsh, but the current price level seems like a logical spot to see the bulls take a stand. I'd be looking for a reversal here, especially knowing that the company raised guidance within the past quarter.
FRPT:
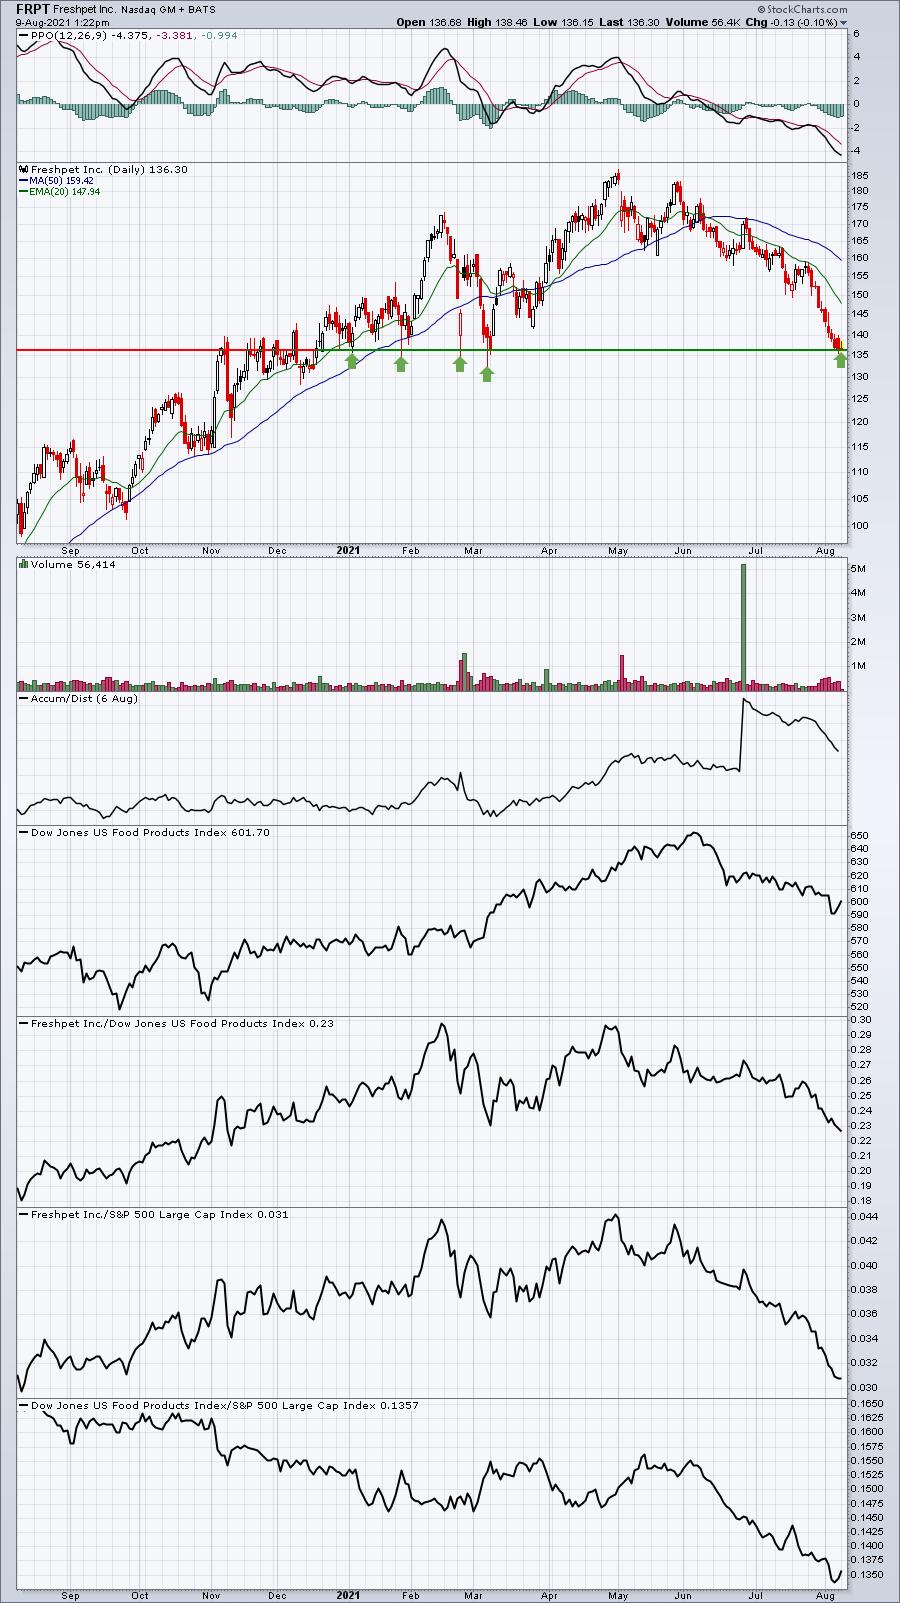
One thing that doesn't show up on this chart is the positive divergence that FRPT has printed on its hourly chart. Food products isn't the most exciting area of the market and it's been a horrible relative performer, but FRPT is at a price level where we've already seen a number of reversals. I'd look for it to happen again.....until it doesn't.
SWK:
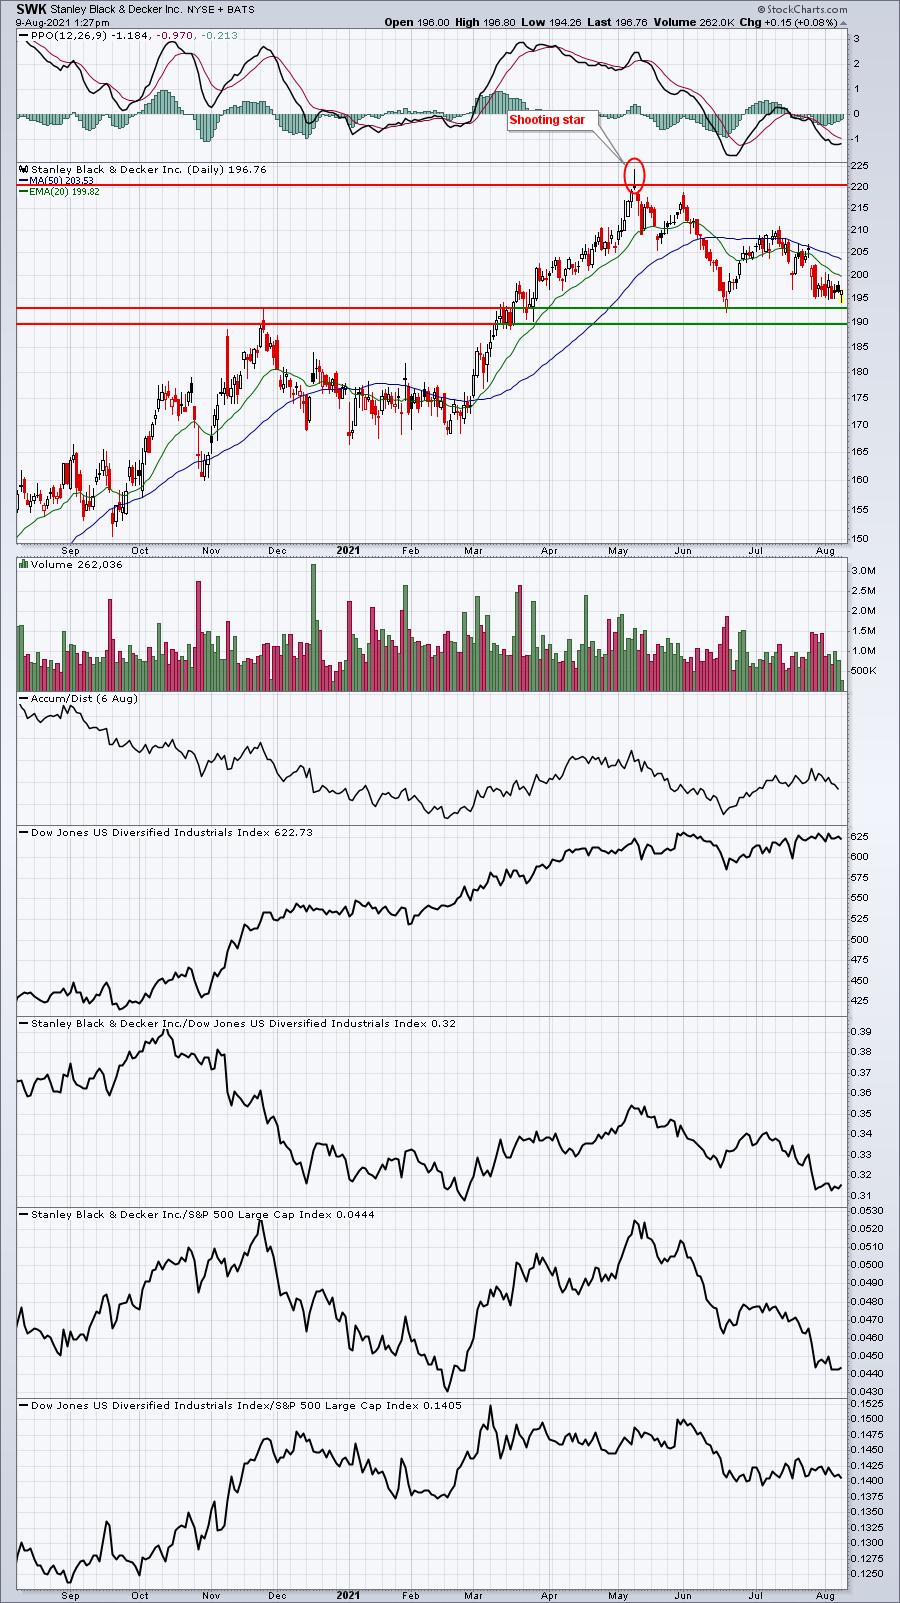
SWK printed a reversing shooting star candle at its high back in May. That also coincided with a relative high as well. SWK has since seen a lot of selling, but, like the other two stocks above, it's reached a key area of support. So when I look at a chart like SWK, I see a significant potential return back to that May high and a much smaller risk down to recent price support.
Earnings Reports
Here are the key earnings reports for the next two days, featuring stocks with market caps of more than $10 billion. I also include a few select companies with market caps below $10 billion. Finally, any portfolio stocks that will be reporting results are highlighted in BOLD. If you decide to hold a stock into earnings, please understand the significant short-term risk that you are taking. Please be sure to check for earnings dates for any companies you own or are considering owning.
Monday, August 9:
BNTX, APD, TTD, GOLD, NTR, TSN, DISH, STE, ELAN, VTRS, OSH, ZLAB, AMC, CHGG, CABO, CF, PEN, PLNT, ELY, APPS, SGMS, EVBG, SAIL, JOBS, QLYS, CRNC, TGNA, DDD, FLGT, CBT, RIOT, INO, PRPL, SENS, WKHS, MODN, PGEN
Tuesday, August 10:
COIN, SYY, TDG, U, BSY, MRVI, MCFE, DAR, UPST, DOCS, ARMK, IIVI, CHK, FUBO, VSH, TDUP, EPAY, LRN, PLBY
Economic Reports
None
Happy trading!
Tom