
EB Daily Market Report - Wednesday, August 11, 2021
Executive Market Summary
- Futures were higher, then improved after the July CPI report was released
- Investors cheered the fact that actual inflation numbers were in line with expectations
- Utilities (XLU, +0.87%), financials (XLF, +0.80%), and industrials (XLI, +0.76%) are leading today's action
- Health care (XLV, -0.69%) and energy (XLE, -0.60%) are the primary laggards
- Crude oil ($WTIC, -0.57%) is fractionally lower, but other commodities are on the rise; gold (GLD, +1.19%) is having its best day in nearly 3 months
- The GLD strength is likely due, at least in part, to the drop today in the U.S. Dollar ($USD), which yesterday closed at its highest level since March 31st
- Transportation services ($DJUSTS, +2.33%) is having a strong day, as is the Dow Jones Transportation Average ($TRAN, +1.13%)
- Moderna (MRNA, -14.12%), which has been on fire this month, is down for a second consecutive day and is today's worst S&P 500 performer
Market Outlook
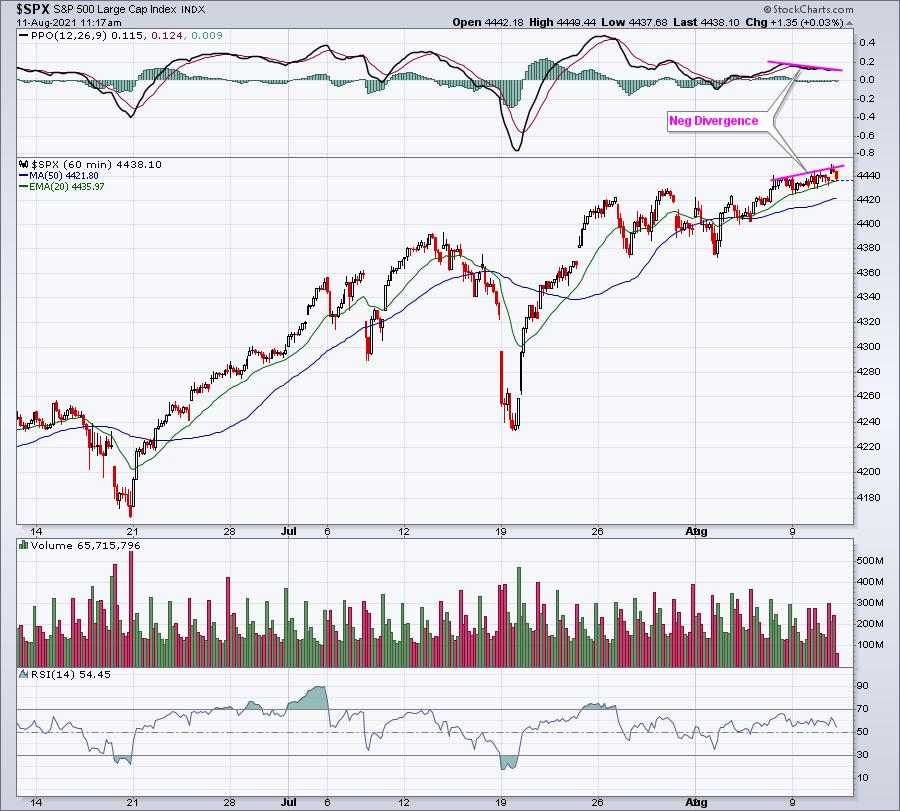
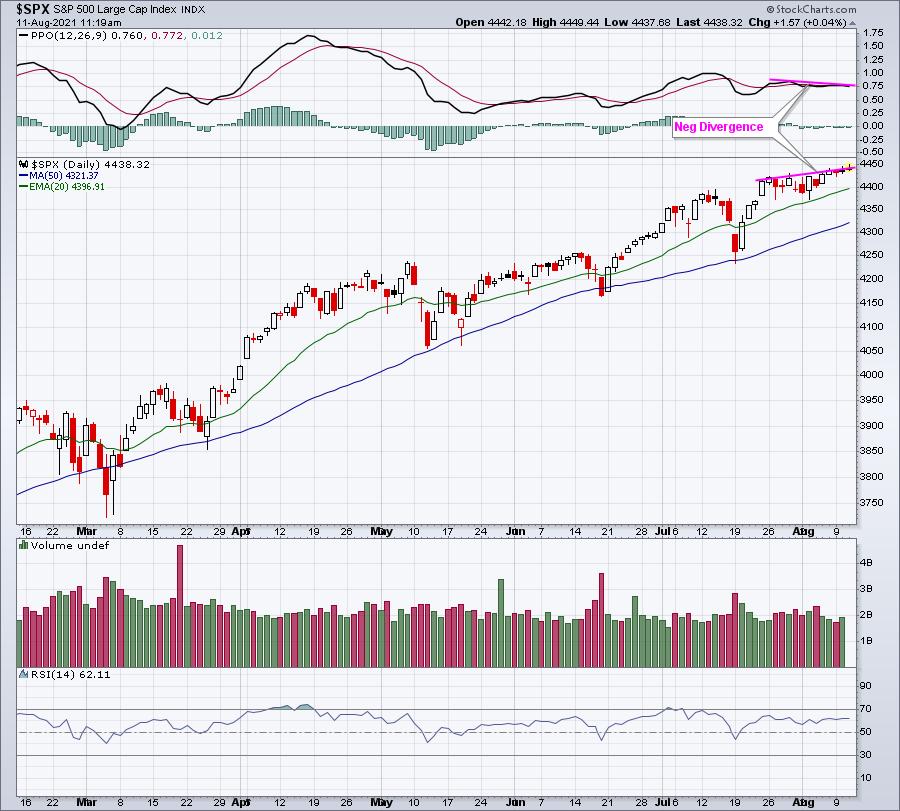
I always use divergences as secondary indicators, but it is worth noting that the S&P 500 now has a negative divergence on its hourly, daily and weekly chart:
SPX (hourly):
SPX (daily):
SPX (weekly):
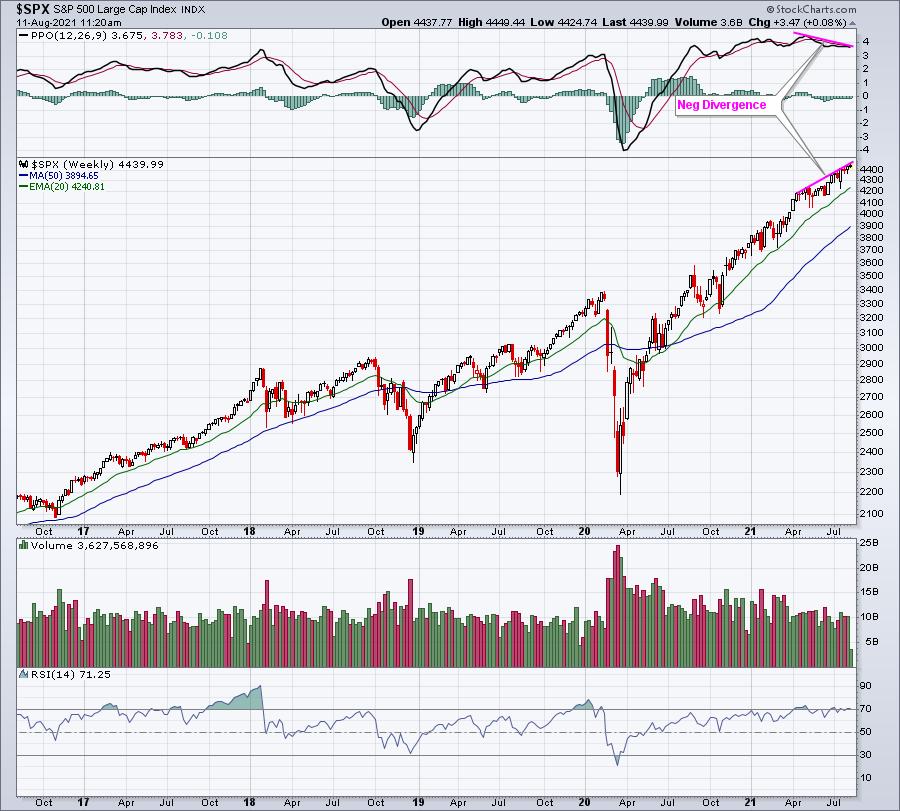
Of these 3 charts, there's no doubt that the weekly chart gives me the most heartache. Both the hourly and daily negative divergences are very slight and are printing at low levels on the PPO. In other words, there's not a lot of bullish momentum to reverse. On the weekly chart, however, that PPO reading at 4 is very significant. The highest reading on the PPO, back in April, was the highest weekly PPO recorded since 1999. So clearly, there's plenty of bullish momentum on the weekly chart to reverse - even if just temporarily.
The trajectory and slope of the current advance is not sustainable as well. It's resulted from the pandemic-induced selloff in 2020, but we'll likely see the S&P 500 correct significantly. My guess is it'll occur either from now through late September or early October OR sometime in early 2022.
You can protect your portfolio to some degree by either raising more cash (ie, smaller positions), buying puts against the S&P 500, or selling calls against individual positions owned. That can protect you to some degree to the downside, but just be aware of the fact that it also will eat into your returns if a correction never develops.
Sector/Industry Focus
Banks ($DJUSBK), after making a breakout on its long-term weekly chart, recently retested that breakout level before bouncing again in recent weeks:
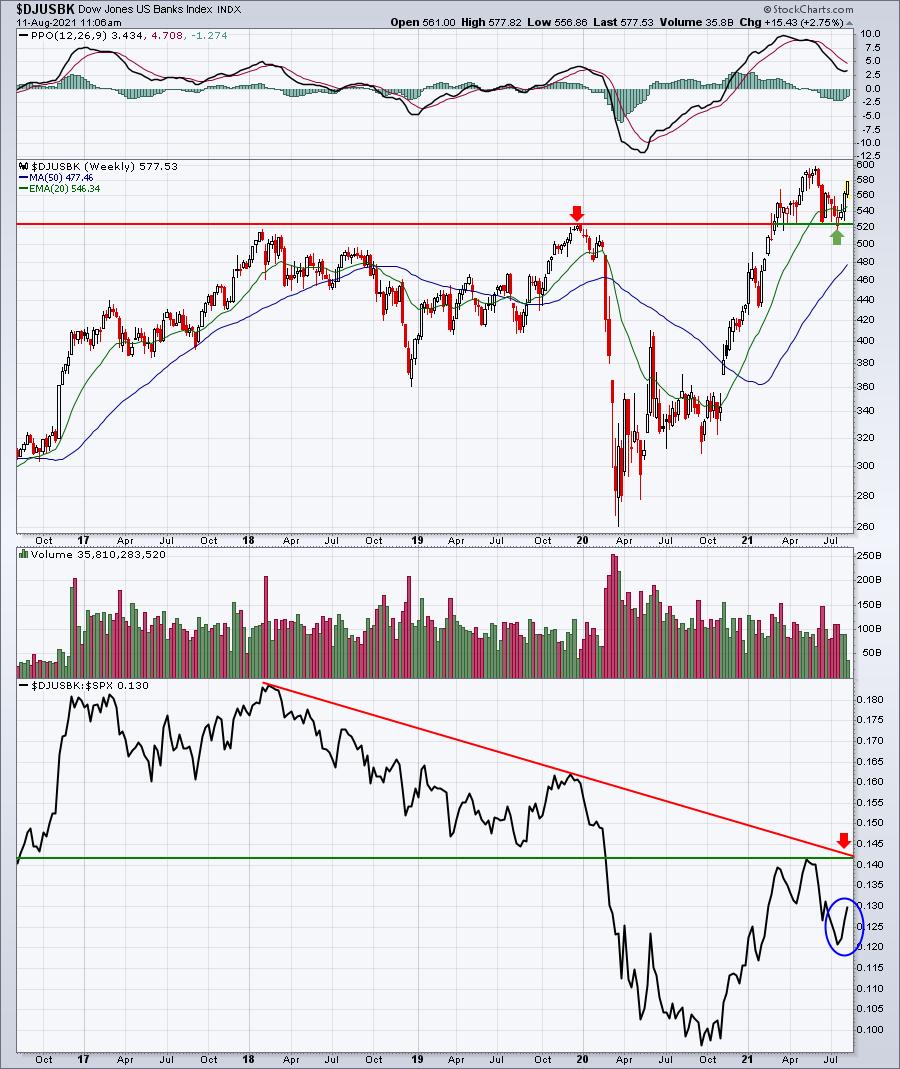
The absolute price chart is really TA 101. Broken price resistance becomes price support. The bottom panel, however, shows the relative price action of banks vs. the benchmark S&P 500. The blue circle shows that banks are strengthening again on a relative basis, but the declining red line connects key relative tops. The group has been downtrending vs. the S&P 500 in the big picture. So while it's easy to get behind bank stocks right now, I'd keep this longer-term relative picture in mind. Trade the group, don't buy and hold it. Just my opinion.
ChartLists/Strategies
I ran our High Volume scan against our Raised Guidance ChartList (RGCL) to see which stocks on this ChartList are experiencing heavier-than-normal volume. This is the scan I ran:

25 stocks were returned and the 13 below have SCTR scores above 50:
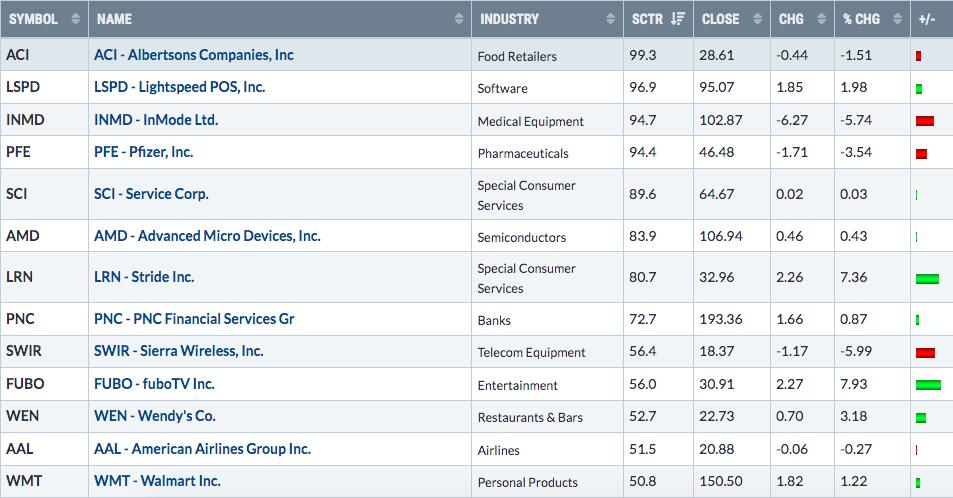
I included the industry group in the results table to identify potential candidates based on industry groups that are appealing. Health care stocks (XLV) have been very weak, actually the worst performing sector over the last week. Medical equipment ($DJUSAM) has been falling as a result and is testing its 20-day EMA today. There's no guarantee it will hold, but it's certainly a strong possibility. Therefore, INMD becomes a stock that I'm interested in - at least looking at the chart. This is what INMD currently looks like:
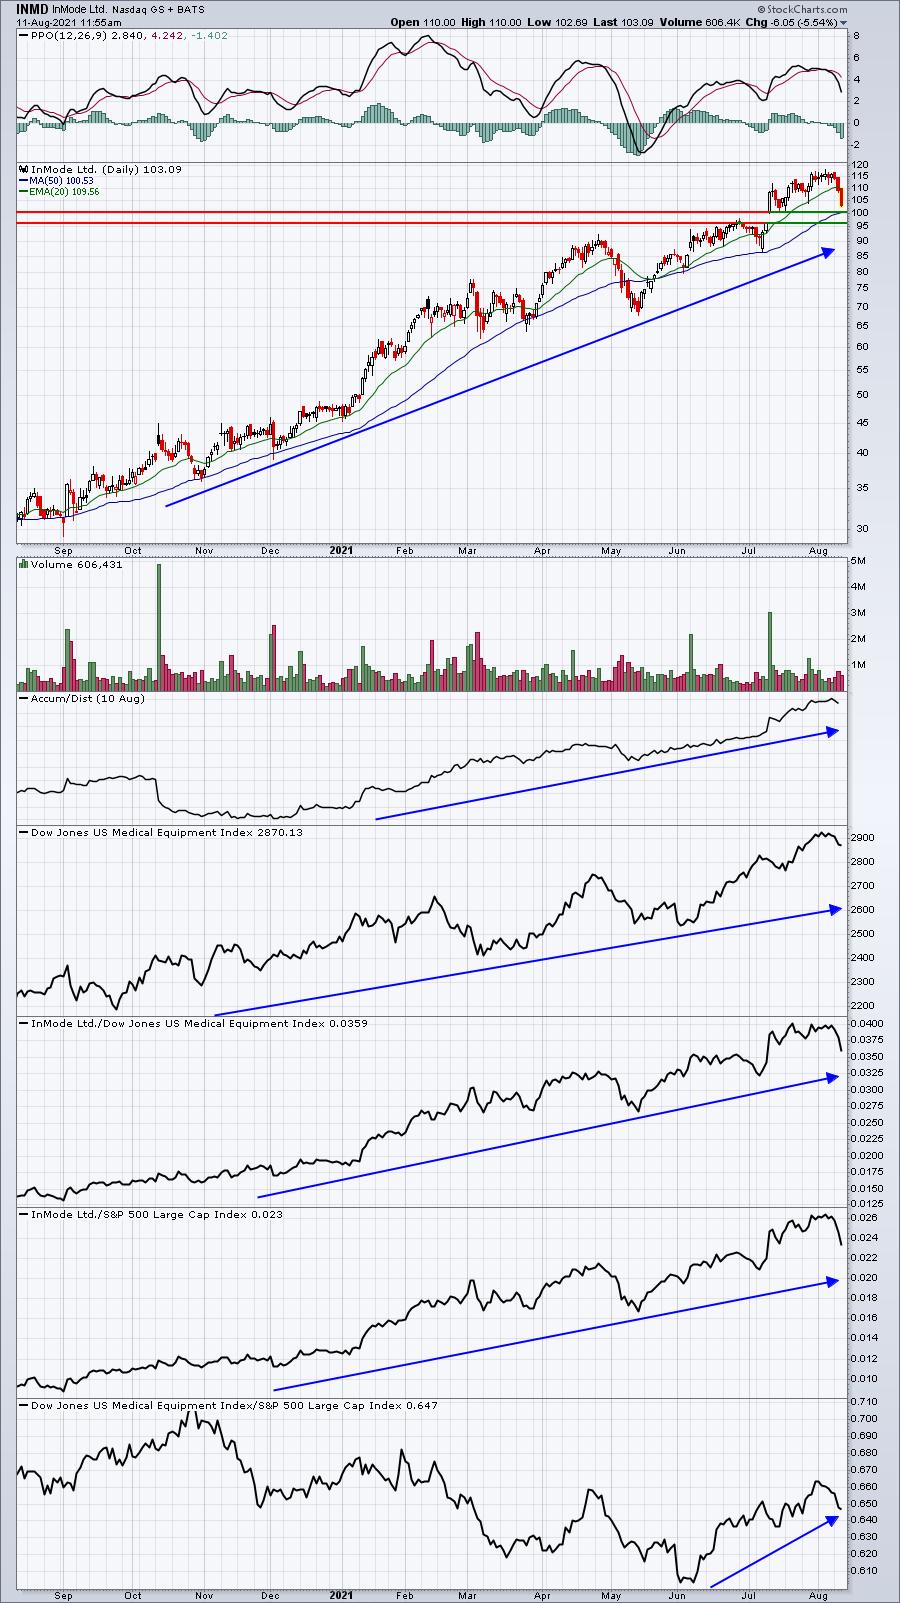
We never know what the future holds, but we can control the types of stocks we buy and sell. INMD looks solid on almost every front. It's a leading stock in a strengthening industry group. Its AD line reeks of accumulation by institutions. I didn't annotate the negative divergence that printed recently at the price high, but clearly the PPO was lower at that high. That suggests a 50-day SMA test is a very real possibility, maybe even probability. Note that the 50-day SMA is currently at 100.53, while the top of gap support is at 100.79. We've seen that gap support level hold when INMD's price fell back to 100.54 on July 19th. INMD's price high was 118 on August 4th. Buying from here down to 100.79 makes perfect technical sense to me. That doesn't mean the trade will work, but we want to find entries that maximize our reward to risk.
I currently do not own INMD as I'm already trading other health care stocks, but it is one that I'm monitoring closely because of its leadership position.
Earnings Reports
Here are the key earnings reports for the next two days, featuring stocks with market caps of more than $10 billion. I also include a few select companies with market caps below $10 billion. Finally, any portfolio stocks that will be reporting results are highlighted in BOLD. If you decide to hold a stock into earnings, please understand the significant short-term risk that you are taking. Please be sure to check for earnings dates for any companies you own or are considering owning.
Wednesday, August 11:
NIO, CPNG, EBAY, FNV, RPRX, APP, BEKE, WIX, MQ, AZPN, CAE, LFST, OPEN, RGLD, PRGO, BMBL, WEN, GOOS, SONO, RXT, ROOT, ARRY, BLNK
Thursday, August 12:
DIS, BAM, ABNB, DASH, BIDU, PLTR, RKT, BR, WPM, PAGS, SOFI, GDRX, MIDD, GLOB, IQ, CELH, CYBR, EYE, VIAV, UTZ, GRWG, CSIQ
Economic Reports
July CPI: +0.5% (actual) vs. +0.5% (estimate)
July Core CPI: +0.3% (actual) vs. +0.4% (estimate)
Happy trading!
Tom