
EB Daily Market Report - Monday, August 16, 2021
ChartList Update
I updated several ChartLists over the weekend and they're now available for viewing/downloading. In order to download the ChartLists, you need to be at least an Extra member at StockCharts. Here are the ChartLists that have been updated:
- Strong Earnings ChartList (SECL) - added over 400 new companies with charts annotated
- Strong Future Earnings ChartList (SFECL)
- Short Squeeze ChartList (SSCL)
- Strong AD ChartList (SADCL)
- Upcoming Earnings ChartLists
Event Today - Sneak Preview Top 10 Stock Picks
This event will begin at 4:30pm ET and will include my analysis of the current state of the stock market, including themes we should be aware of as we move into September, historically the worst calendar month of the year. You can access the event from our website, or you can use the following link:
https://earningsbeats.zoom.us/j/85360861962
Hope to see you there!
Executive Market Summary
- Futures were lower overnight and our major indices opened lower to start the week
- Buyers have returned since early morning lows, however, and both the Dow Jones and S&P 500 were trading at their intraday highs at last check
- The August empire manufacturing report came in well below expectations and treasuries were bought
- The 10-year treasury yield ($TNX) initially fell 7 basis points to 1.22% before recovering back to 1.25%
- Financials (XLF, -0.65%) resolved their 60-minute negative divergence - see Market Outlook below, but still remain down
- Energy (XLE, -1.88%) is the worst performing sector again, no doubt as a result of lower crude oil prices and tension building in the Middle East
- Automobiles ($DJUSAU, -4.02%) are struggling after it was reported that U.S regulators have launched an investigation into Tesla's (TSLA, -4.68%) Autopilot system
- Retailers are in focus as July retail sales are due out Tuesday morning; estimates range from -0.6% to +0.2%, with Wall Street consensus at -0.2%
Market Outlook
Financials (XLF) recently had a nice run and it's likely not over. However, the XLF clearly ran into short-term momentum issues last week as it printed new highs on an hourly chart, with a faltering PPO:
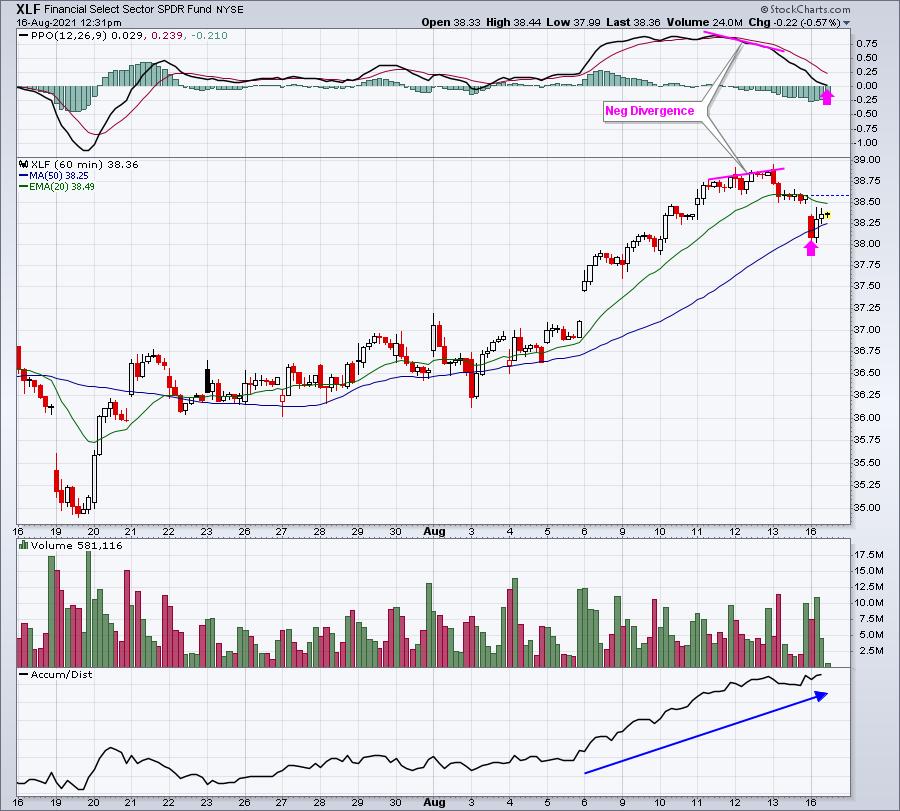
When I see negative divergences, the first thing I look for is either a PPO centerline test or a 50-period EMA test, or both (pink arrows). In this case, we've seen both. I also think it's interesting that the hourly AD line has continued moving higher despite the selloff in price. It could certainly be that professionals are using this selling as an opportunity to accumulate.
Sector/Industry Focus
Retail stocks are about to come into focus as the July retail sales report will be released Tuesday morning at 8:30am ET. This group (XRT) has been consolidating for months, so will tomorrow's data be a catalyst for a major breakout? Breakdown?
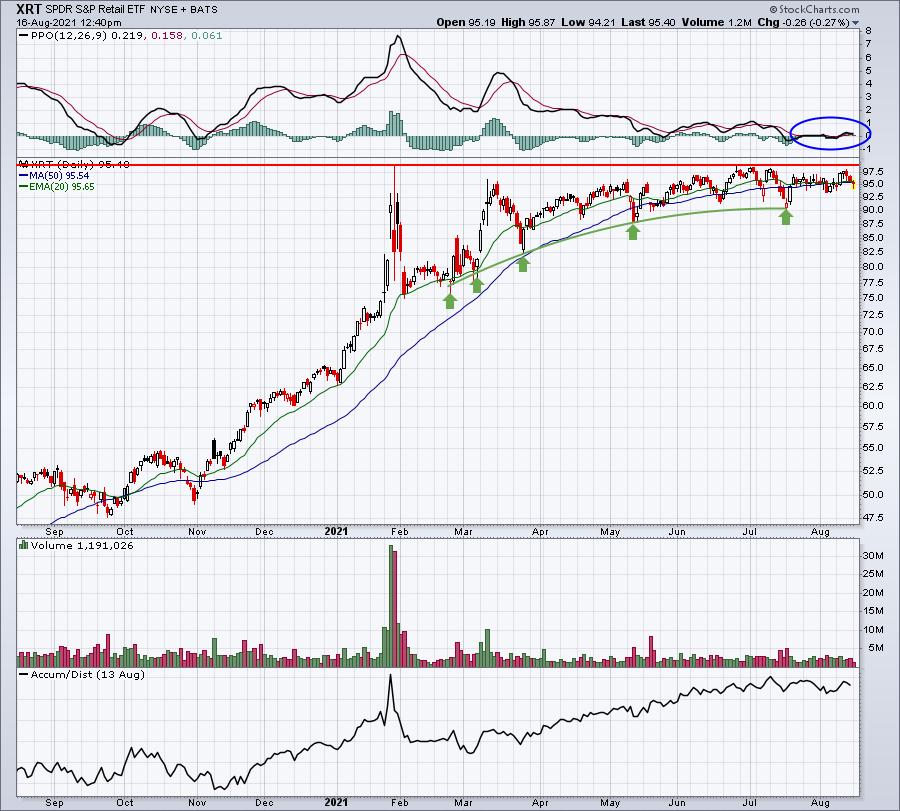
The AD line remains strong, which I view as a bullish signal. It's worth noting that there are plenty of different retail charts we could look at. I prefer the XRT because it's a widely-diversifed ETF that broadly evaluates the entire industry. For instance, the XRT's largest holding is ETSY, which only comprises 1.25% of the entire ETF.
ChartLists/Strategies
As mentioned above, several ChartLists were updated over the weekend. While I'd like to see how the market finishes today before suggesting further trades, I did want to pass along what I refer to as my "Bullish Trifecta" ChartList. After updating both the Strong Earnings and Strong AD ChartLists, I ran a scan to find stocks that are included on both of these ChartLists, plus also is on our Raised Guidance ChartList. 69 stocks were returned, but I removed 20 that had negative divergences or were suspect with regard to momentum. Here is a link that you can use to view or download this ChartList of the remaining 49 stocks:
Bullish Trifecta ChartList (password: BULL1234)
I believe this is a powerful ChartList to use as a Watch List for potential trades, especially when these stocks have strong PPOs and fall back temporarily to test their rising 20-day EMAs.
Earnings Reports
Here are the key earnings reports for the next two days, featuring stocks with market caps of more than $10 billion. I also include a few select companies with market caps below $10 billion. Finally, any portfolio stocks that will be reporting results are highlighted in BOLD. If you decide to hold a stock into earnings, please understand the significant short-term risk that you are taking. Please be sure to check for earnings dates for any companies you own or are considering owning.
Monday, August 16:
RBLX, TME, EDR, OTLY, FN, TLS, NIU, POWW
Tuesday, August 17:
WMT, HD, SE, A, AMCR, JKHY, GDS, CREE, CDK, DNUT, LZB, CRMT
Economic Reports
August empire manufacturing: 18.3 (actual) vs. 30.0 (estimate)
Happy trading!
Tom