
EB Daily Market Report - Tuesday, August 17, 2021
Event Today - August Max Pain
This is our regular monthly Max Pain event. I'll be looking at the QQQ and SPY for possible directional clues over the next week or so and I'll also provide individual trading candidates on both the long and short side that could benefit from an imbalance of calls and puts. It's a very educational event, so I hope you can join me. Here's the link to today's webinar room:
https://earningsbeats.zoom.us/j/87874200703
The room will open at approximately 4:00pm ET. Hope to see you there!
Executive Market Summary
- Futures were lower overnight and, after opening down, there's been a lot of additional selling
- All of our major indices are down 1% or more; small caps ($SML) are being hit the hardest, down 1.91%
- 10 of 11 sectors are lower, led by consumer discretionary's (XLY) tumble of 2.90%
- Retail (XRT, -3.22%), home construction ($DJUSHB, -4.25%), and home improvement retailers ($DJUSHI, -4.80%) are lagging badly
- Home Depot (HD, -4.63%) beat quarterly revenue and EPS estimates, but is the hardest hit Dow Jones component
- Health care (XLV, +0.56%) is the lone positive sector today
- Commodities are mostly lower, especially copper ($COPPER, -2.80%)
- Walmart (WMT, -0.18%) is a relative outperformer today, though lower, after reporting better-than-expected results
- Weak July retail sales and an August housing market index way below expectations have handcuffed the market today
Market Outlook
Consumer discretionary stocks (XLY) have been extremely weak and they're really battling a series of issues today. First, that retail sales number for July was very disappointing - more on that in the Sector/Industry Focus section below. Next, the August housing market came up well short of consensus estimates, 85 vs. 90. Home construction ($DJUSHB, -3.84%) is struggling big time as a result. Finally, automobiles ($DJUSAU, -4.22%) are threatening to close below their 50-day SMA for the first time in 2 months, just three days after closing at its highest level since April 26th. Here's a current look at the XLY on both an absolute and relative basis:
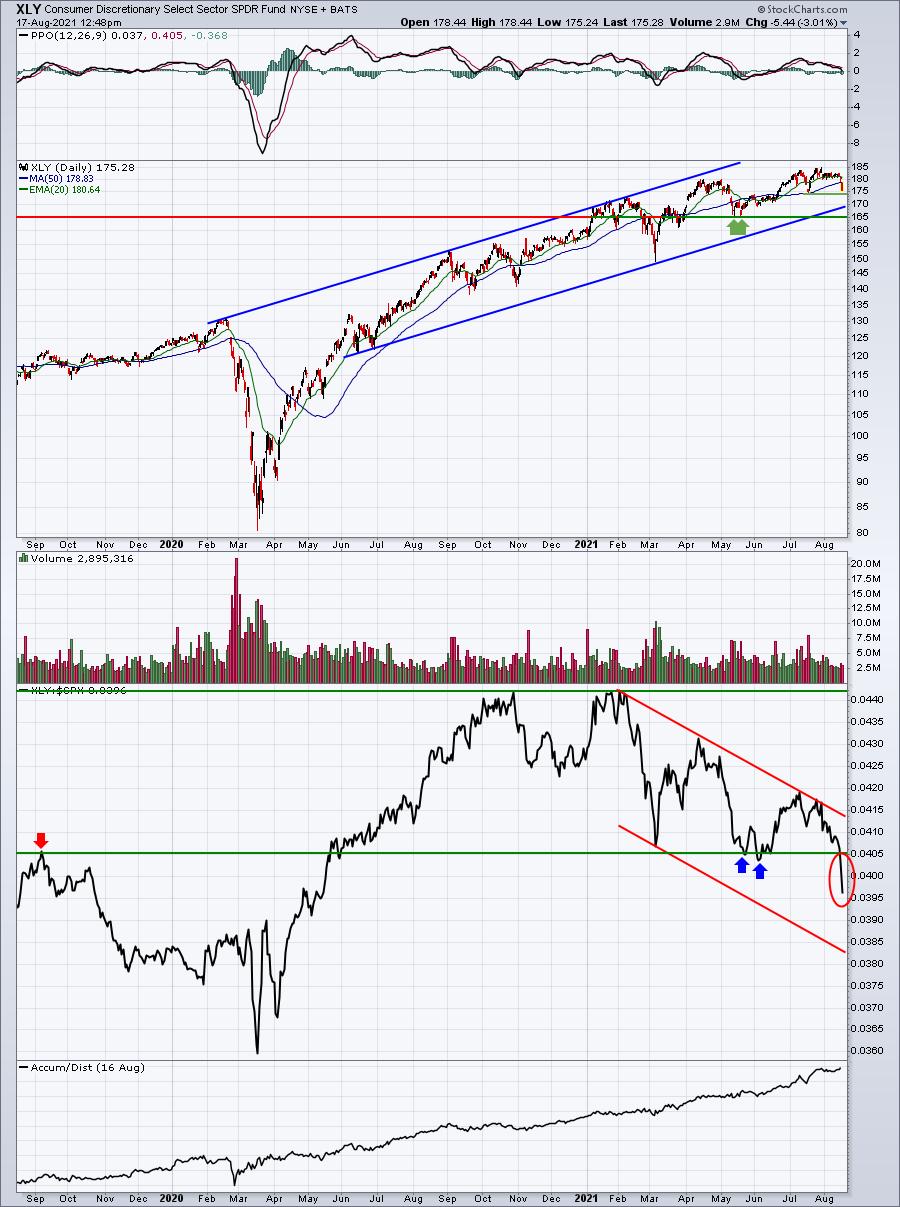
I see mixed signals galore here, making the predictability of the next move very difficult. The AD line is SUPERB, suggesting any selling is being heavily accumulated by institutions. But the breakdown in relative strength is clearly leading to further short-term selling. My best guess is that the XLY will likely turn at recent price support near 174. However, should fear accelerate near-term, I can't rule out a quick selloff to 169-170 channel support. From a longer-term price support perspective, I believe the May double bottom at 165 is very important.
Sector/Industry Focus
Well, I was speculating what might happen to the XRT (widely-diversified retail ETF) today after July retail sales were reported. We now know. Retail sales came in well below expectations and the XRT is down more than 3%:
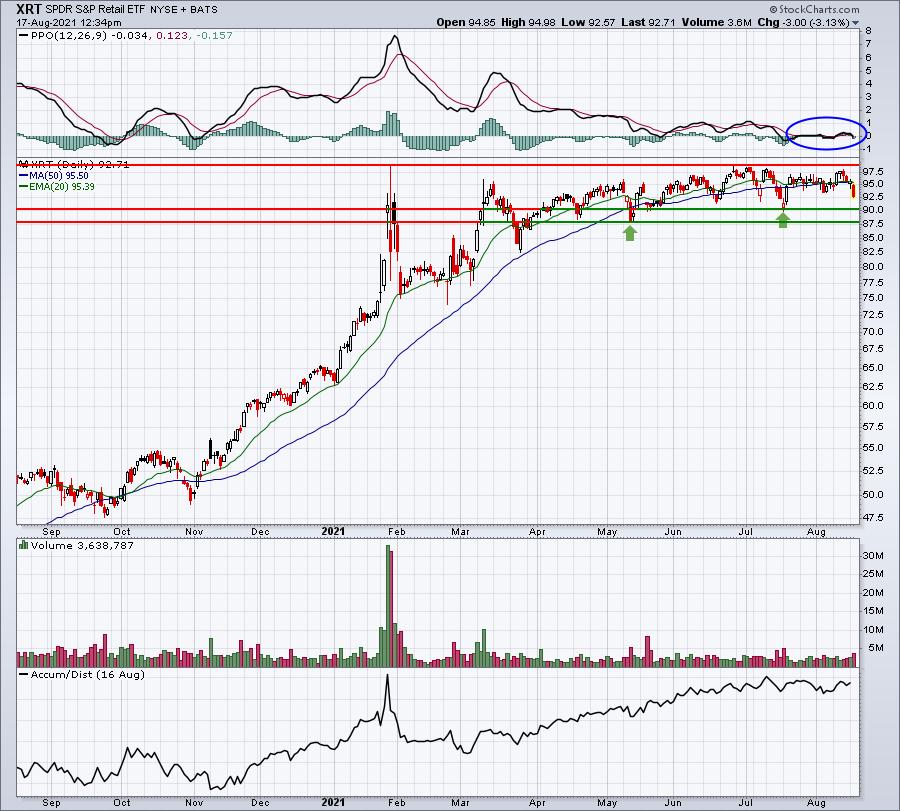
The AD line has been strong, so I wouldn't completely rule the group out. An afternoon reversal would be the most bullish development as volume is very heavy and it would add considerably to the AD line's strength. Failure to reverse this afternoon, however, would more than likely lead to tests of key price support in the 88-90 range (green arrows).
ChartLists/Strategies
One ratio likely going unnoticed today is the $DJUSGS:$DJUSVS (small cap growth vs. small cap value). While the overall market has just began a decline, small cap growth stocks were being shunned the past few weeks. That seems to be reversing now, a potentially good sign for small cap growth stocks. A couple of small cap fast growers included on our "Bullish Trifecta" ChartLists are as follows:
LC:
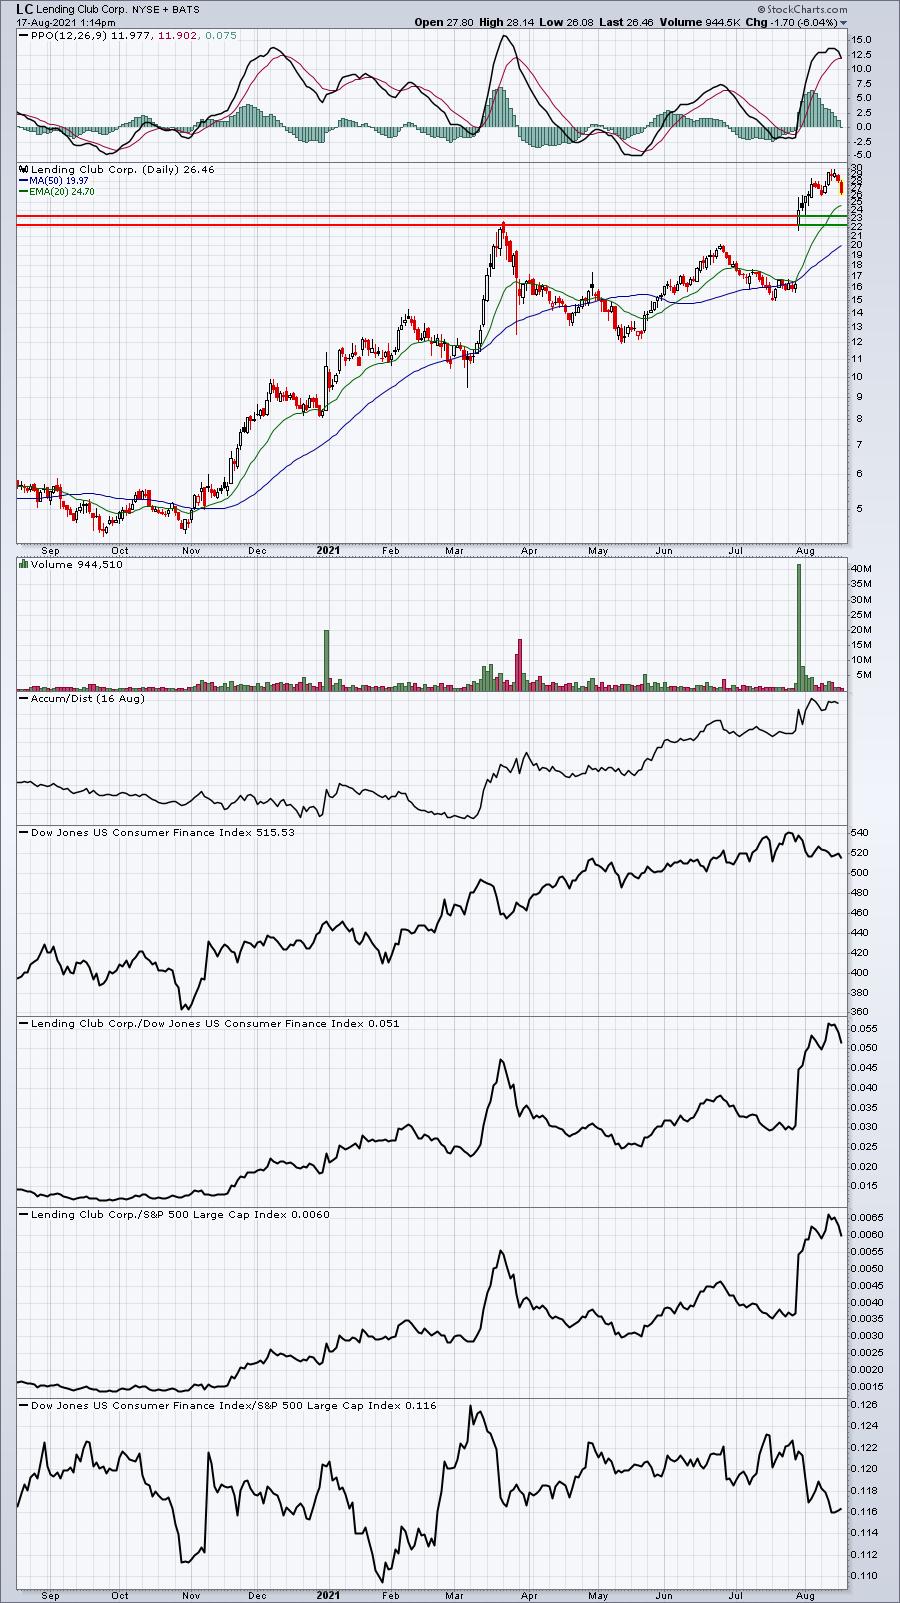
This has been a very fast mover, so the risk is quite high on a stock like this one. However, it has already pulled back more than 10% from its recent high. The closer it gets to its 20-day EMA, the better in my view. I've also included two horizontal lines marking key price support if the recent selling accelerates. Because of the extreme volatility, LC isn't a viable trading candidate for risk-averse traders, but those with a higher tolerance might consider trading it, building a position as any further weakness unfolds.
III:
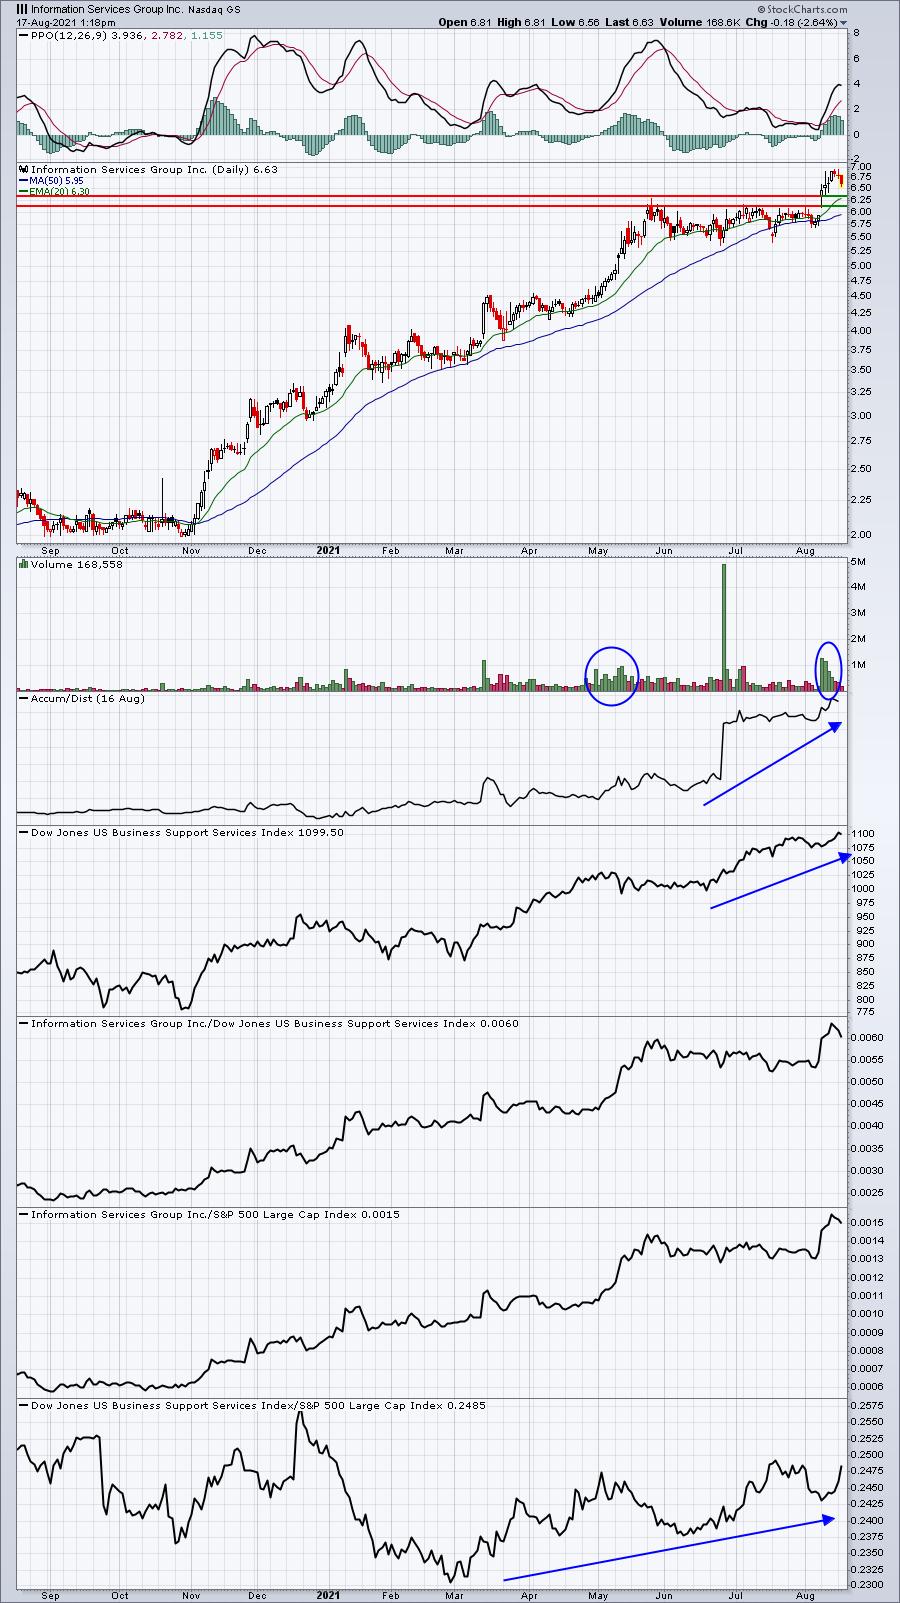
III is in the industrial sector, which I've written about considerably recently. Industrials love the upcoming 3-month period and III is looking quite solid. I'd look to the 6.15-6.35 area as solid price support.
Earnings Reports
Here are the key earnings reports for the next two days, featuring stocks with market caps of more than $10 billion. I also include a few select companies with market caps below $10 billion. Finally, any portfolio stocks that will be reporting results are highlighted in BOLD. If you decide to hold a stock into earnings, please understand the significant short-term risk that you are taking. Please be sure to check for earnings dates for any companies you own or are considering owning.
Tuesday, August 17:
WMT, HD, SE, A, AMCR, JKHY, GDS, CREE, CDK, DNUT, LZB, CRMT
Wednesday, August 18:
NVDA, CSCO, LOW, TGT, TJX, ADI, SNPS, KEYS, ZTO, BBWI, SQM, WB, VIPS, VSCO, LITE, DQ, EAT, PLCE
Economic Reports
July retail sales: -1.1% (actual) vs. -0.2% (estimate)
July retail sales ex-autos: -0.4% (actual) vs. +0.2% (estimate)
July industrial production: +0.9% (actual) vs. +0.4% (estimate)
July capacity utilization: 76.1% (actual) vs. 75.7% (estimate)
June business inventories: +0.8% (actual) vs. +0.8% (estimate)
August housing market index: 75 (actual) vs. 80 (estimate)
Happy trading!
Tom