
EB Daily Market Report (Abbreviated) - Thursday, August 19, 2021
Today's Event - Portfolio "Draft"
I'll be hosting a webinar event today at 5:30pm ET, "Top 10 Stock Picks", or as I like to refer to it - our Portfolio "Draft". I'll be announcing the 10 equal-weighted stocks that will comprise each of our 4 stock portfolios. The room will open at approximately 5:00pm ET and you can join the room by clicking on the link below:
https://earningsbeats.zoom.us/j/82737862482
Hope to see you there!
Abbreviated Daily Market Report (DMR)
There is a TON of prep time involved in preparing for our quarterly portfolio "draft". While I won't have the time to provide a full DMR today, I wanted to send out a very quick summary of this morning's early action.
Our major indices have gapped lower as options expiration nears. The SPY (ETF that tracks S&P 500) was at 444.06 at Tuesday's close when we discussed max pain issues. The max pain level was 431.31. There was $925 million of net in-the-money call premium on the table for market makers. Since Tuesday's close, check out the SPY chart:
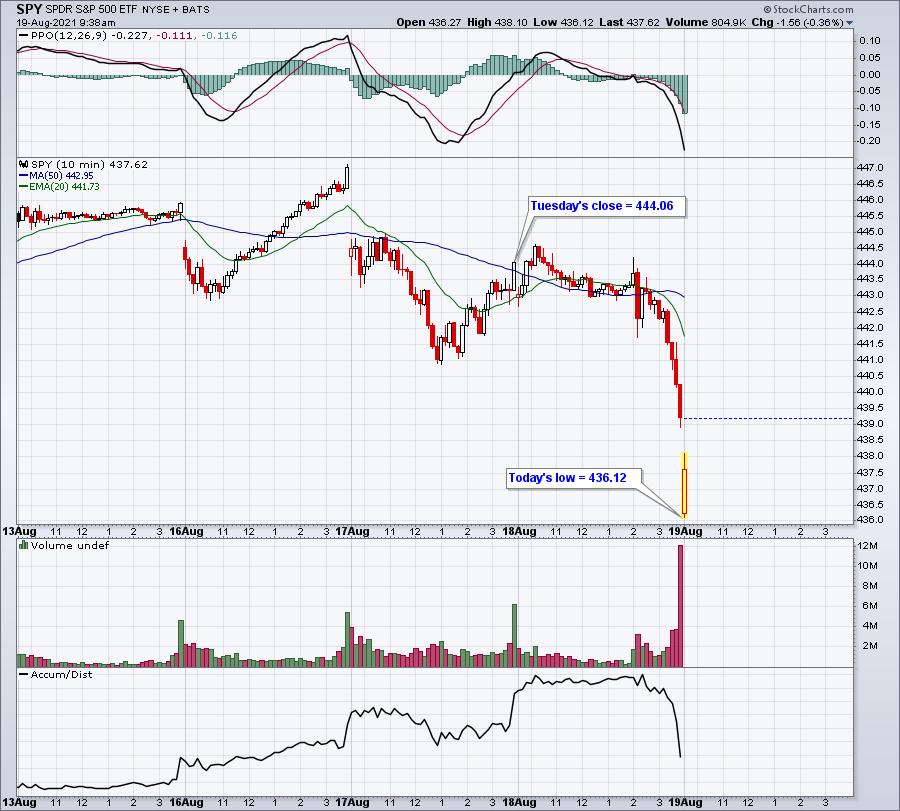
The net in-the-money call premium drops by $70 million for every dollar the SPY falls. So, already since Tuesday's close, we've seen the SPY fall 8 bucks, trimming that net in-the-money call premium by $560 million. Crazy!
I also want to mention that I did an analysis of trading this year (2021). We've had 158 trading days thus far. 89 have been higher, 69 have been lower. I further broke down performance during options expiration week. Here is how the S&P 500 has performed this year during options expiration week (Tuesday through Friday):
- Tuesdays: 2 up, 6 down, annualized return -57.03%
- Wednesdays: 3 up, 5 down, annualized return -54.28%
- Thursdays: 2 up, 5 down, annualized return -18.02%
- Fridays: 1 up, 6 down, annualized return -99.34%
If we strip out the Tuesday through Friday options expiration week activity, the balance of the year has seen 81 up days and just 47 down days.
Let me explain it another way. The S&P 500 began the year at 3756.07. At Wednesday's close, the S&P 500 was at 4400.27. That's a net gain of 644.20 points. Here's the breakdown in points gained (lost) during non-expiration week and expiration week:
S&P 500, beginning of year: 3756.07
Tuesdays-Fridays of options week: -284.11
All other days of the year: +928.31
S&P 500, August 18th close: 4400.27
How much clearer does this picture have to get? All the headlines and fear mongering serves one purpose and one purpose only. It lines the market makers' pockets.
Back tomorrow with my standard DMR.
Happy trading!
Tom