
EB Daily Market Report - Friday, August 20, 2021
ChartLists Updated
The 4 portfolio ChartLists - Model, Aggressive, Income, and Strong AD - have been updated on our website, as has the Strong ETF ChartList (SETFCL). The latter comes with an updated ETF Analyzer as well, which can be found on our website. Two ETFs, LRGF and SUSA, are included on our ETF Analyzer spreadsheet, but you'll see that they're not included on the Strong ETF ChartList. For whatever reason, when trying to download the 89 charts into our StockCharts account, LRGF and SUSA was presenting problems. So we deleted both from the ChartList to enable the download. One possible solution would be to add them to the ChartList once the list has been downloaded into your account.
If you don't see the updated ChartList on our website, check back again later today. Some have been updated and others are being updated currently. If you have any questions, feel free to reach out to us at "[email protected]".
Executive Market Summary
- Futures were mixed overnight, but definitely strengthened into today's open
- The NASDAQ was the clear early relative leader, but that has begun to change over the past hour or so; the S&P 500 is now up 0.54%, nearly catching the NASDAQ's 0.57% gain
- The U.S. Dollar (UUP) is flat after a big breakout on Thursday to a fresh 2021 high
- All 11 sectors are higher today after a rather ugly week
- Utilities (XLU, +0.96%) and technology (XLK, +0.68%) are the leading sectors as we are just hours away from monthly options expiration
- Strength is spread across many industry groups, though software ($DJUSSW, +1.54%) is extending its run into record-high territory
- Consumer finance ($DJUSSF, -0.43%) is one of the few industry groups struggling today
- There are familiar leaders and laggards on the Dow Jones as Microsoft (MSFT, +2.31%) and Intel (INTC, -1.75%) lead those respective categories
Market Outlook
Cryptocurrencies held key price lows in recent weeks and we now see the bullish result. Here's the latest chart on bitcoin ($BTCUSD):
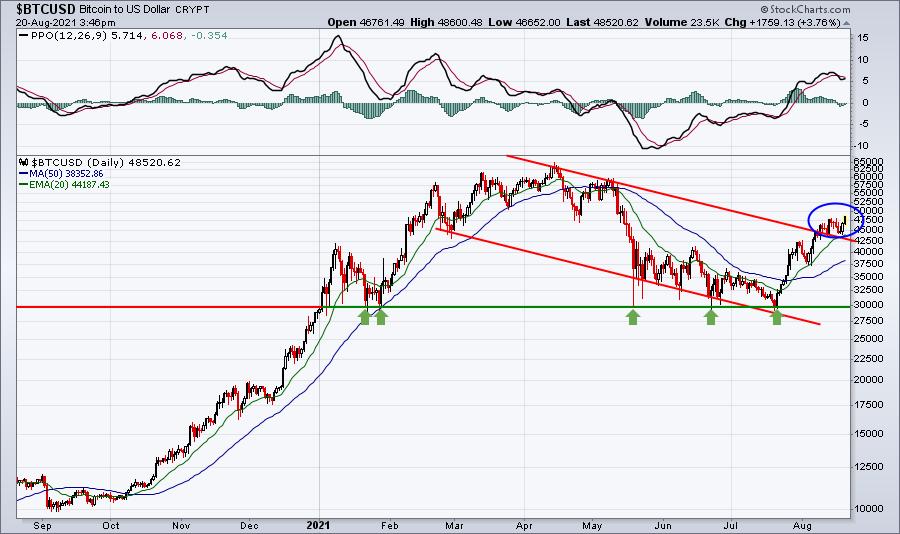
Clearly, 30000 was a major support level and continues to be. We've tested that level successfully a handful of times. If we compare both bitcoin and etherium ($ETHUSD) to the U.S. Dollar ($USD) on an RRG chart, it looks like this:
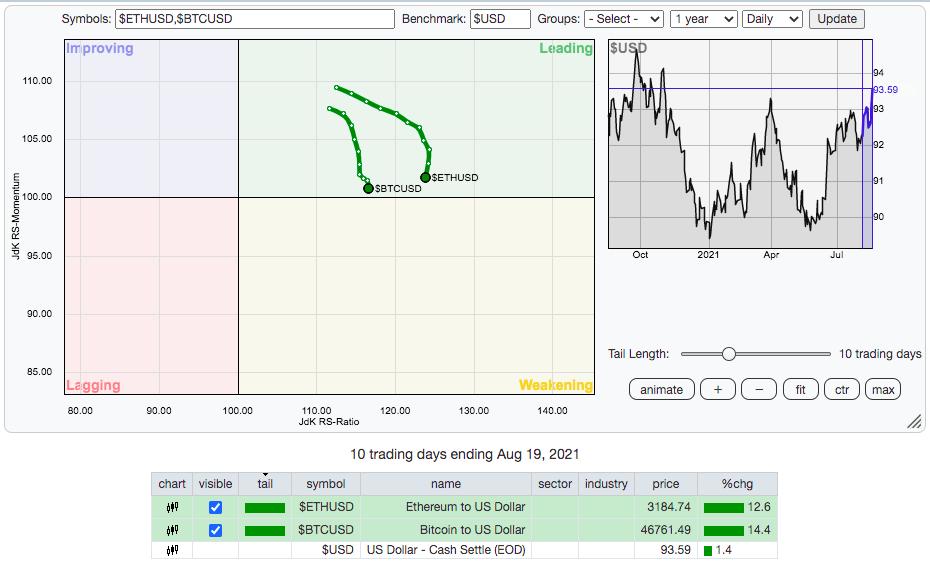
Etherium is a bit further to the right, so I'd say it's currently carrying a bit more relative strength. Another way to look at its relative strength vs. bitcoin is do look at a price relative ($ETHUSD:$BTCUSD) chart:
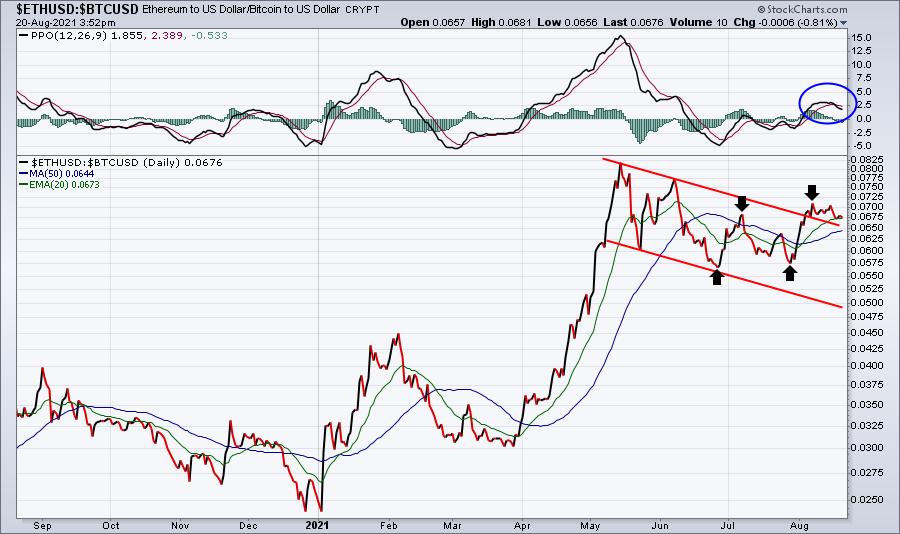
2021 has been very strong for etherium - much more so than for bitcoin. That relative strength appears to be resuming with recent higher relative highs and higher relative lows (black arrows). I continue to favor etherium in this battle, even though bitcoin seems to steal the headlines.
Sector/Industry Focus
Energy (XLE) traders will likely have their intestinal fortitude tested after crude oil broke ($WTIC) below $65 per barrel on Thursday:
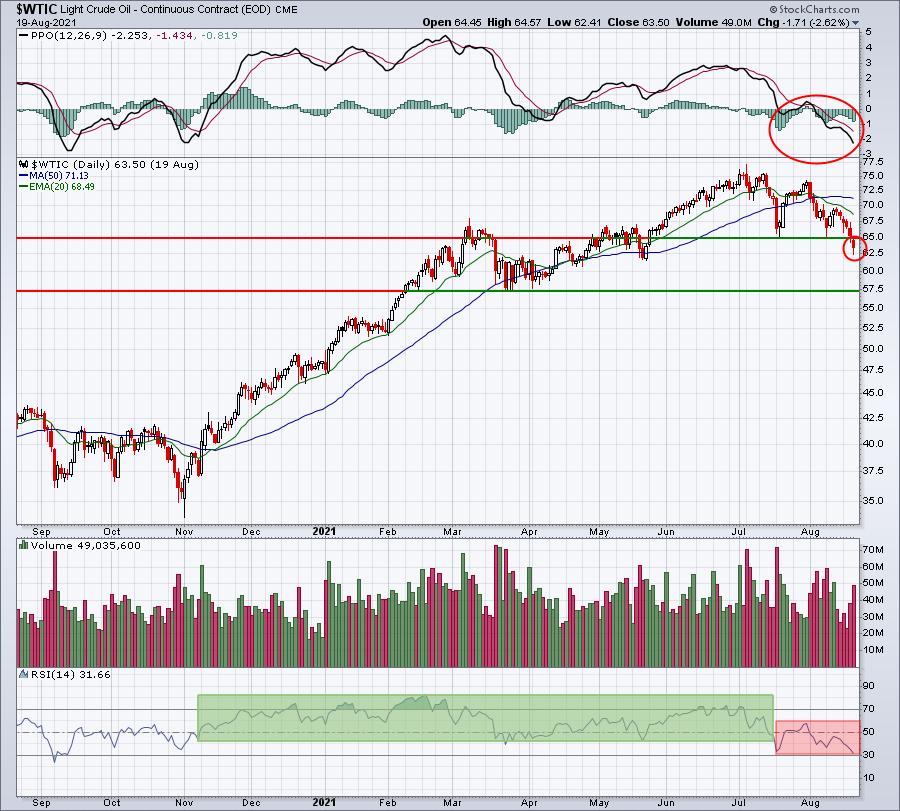
The RSI is telling here. For months, the RSI held 40 support, which is typical during uptrends. The RSI also moved well into the 70s and even 80s, reflecting lengthy periods of overbought conditions. That too reflects a strong uptrend and the entire period is shaded in green. The past month, however, has seen the RSI top near 60 and now it's back near 30. This is suggesting a new downtrend in crude oil prices has begun. That, in turn, is likely to put more pressure on longs to sell their positions.
Meanwhile, the XLE has been outperforming crude oil the past few weeks, but will it continue or will the XLE begin to buckle?
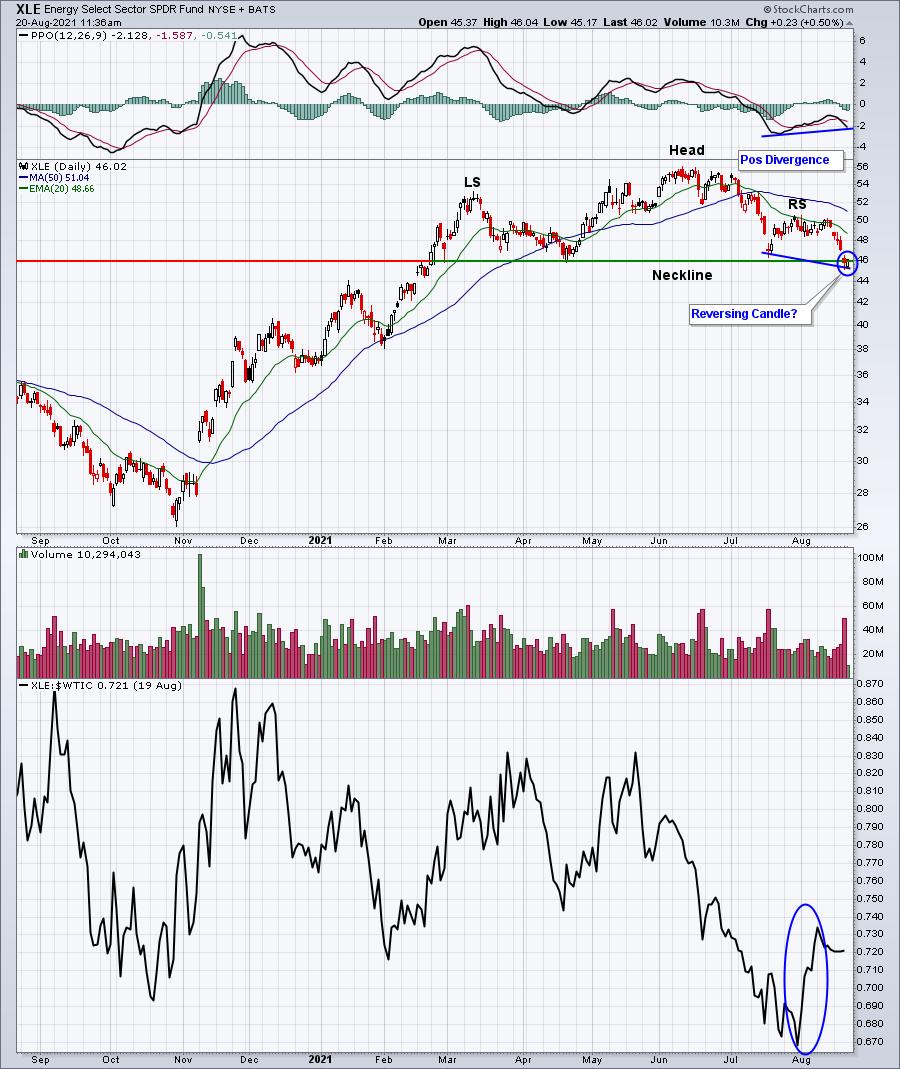
This is a really critical area technically. There's a topping head & shoulders pattern in play and a break below the neckline would suggest much more weakness ahead. However, we can't lose sight of the positive divergence also in play. A reversing candle, combined with a positive divergence, typically results in a trip back up to test the 50-day SMA and/or the PPO centerline.
But there's one more problem with energy, and materials (XLB) for that matter. The U.S. Dollar Index ($USD) broke to a new 2021 high at Thursday's close:
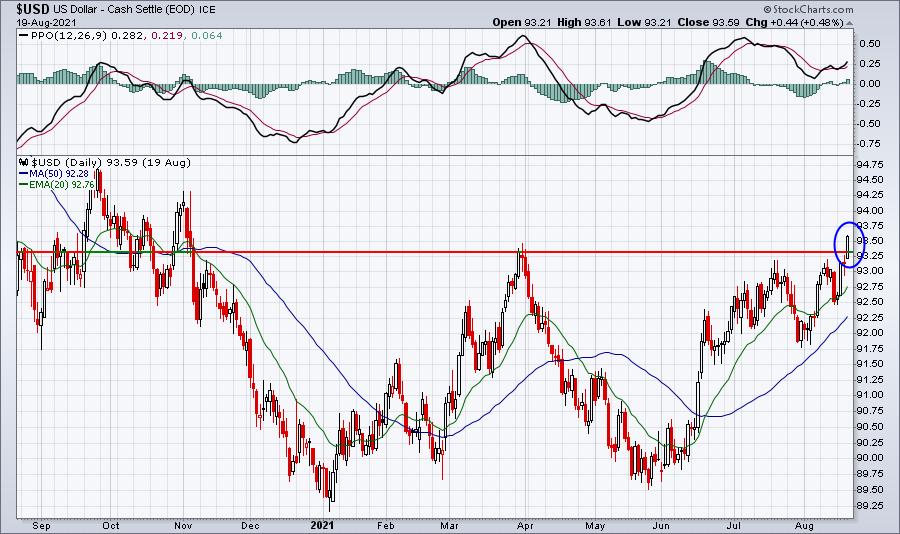
A rising dollar nearly assures us that energy and materials will underperform the benchmark S&P 500. That's why we excluded both of these sectors from our portfolios that we announced yesterday. If the dollar fails on this breakout, then that would open up more bullish possibilities for energy and materials. Otherwise, I'd stay away.
ChartLists/Strategies
I ran a scan of 52-week highs against our Strong Earnings ChartList (SECL), but filtered further for any stock with a SCTR < 80. I wanted to see if I could find a breakout that didn't include stocks that were simply going up day after day (and likely with a SCTR in the 90s). One stock was returned:
PEP:
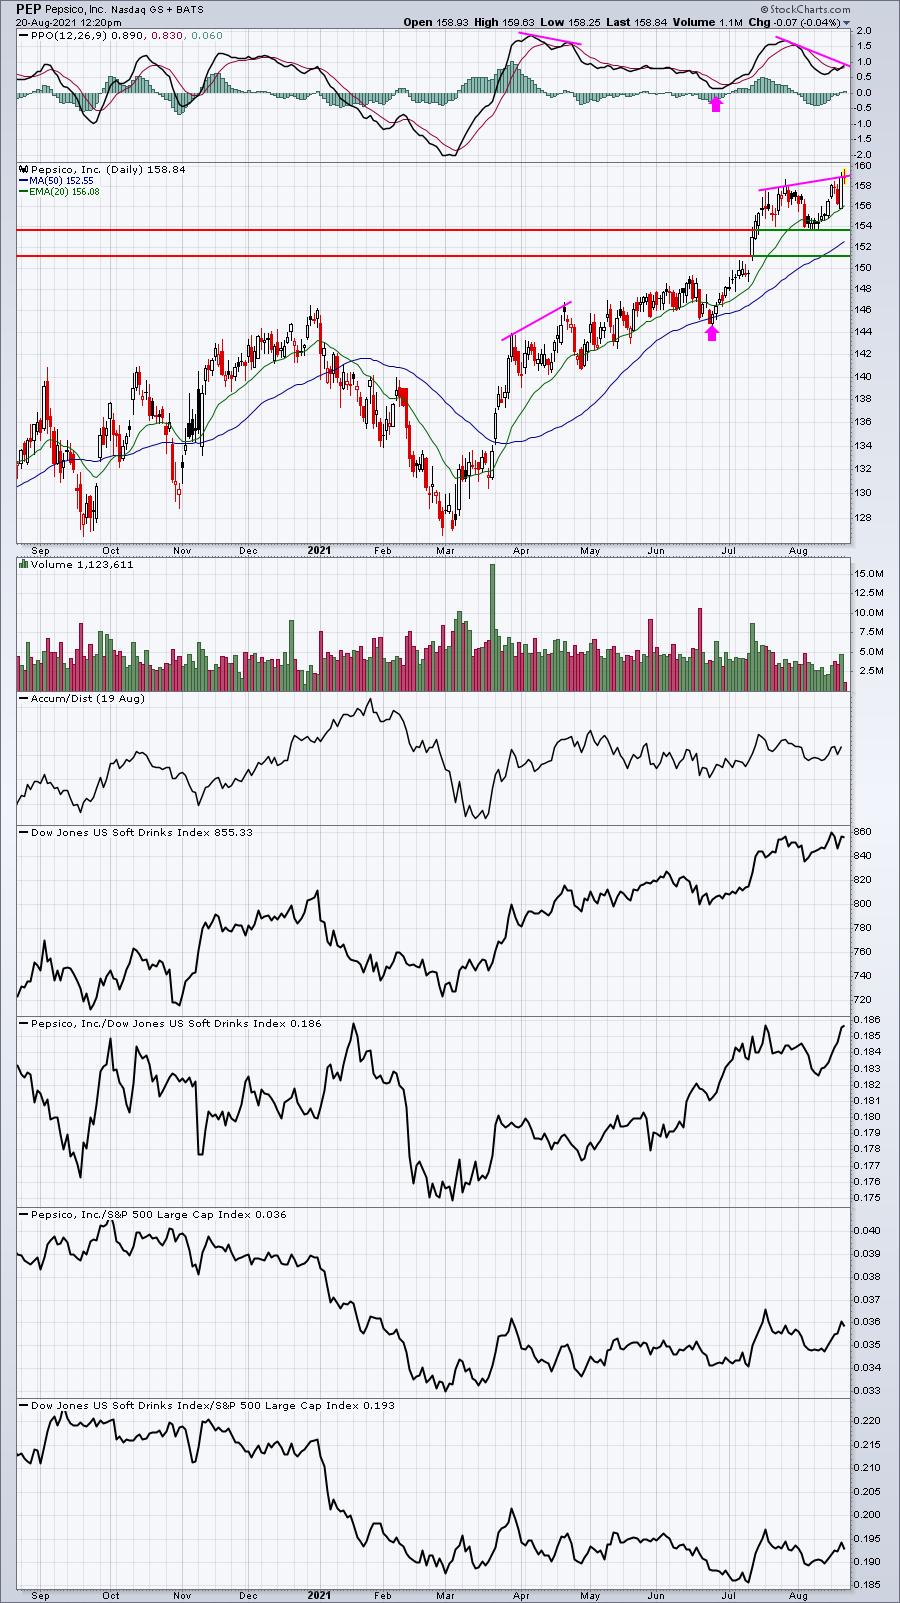
The breakout is accompanied by just moderate volume and there is a negative divergence in play. I highlighted a similar breakout with a negative divergence back in April and you can see the struggle encountered. There is one better piece of news now vs. April, however, as PEP's relative strength is much stronger. Still, I'd look for a better reward-to-risk entry.
Earnings Reports
Here are the key earnings reports for the next two days, featuring stocks with market caps of more than $10 billion. I also include a few select companies with market caps below $10 billion. Finally, any portfolio stocks that will be reporting results are highlighted in BOLD. If you decide to hold a stock into earnings, please understand the significant short-term risk that you are taking. Please be sure to check for earnings dates for any companies you own or are considering owning.
Friday, August 20:
DE, FL, BKE
Monday, August 23:
JD, PANW
Economic Reports
None
Happy trading!
Tom