
EB Daily Market Report - Tuesday, August 24, 2021
Executive Market Summary
- Futures were higher overnight and our major indices gapped higher
- The NASDAQ pierced 15000 for the first time in history, while the S&P 500 approached 4500, a level never topped in its history
- Energy (XLE, +1.05%) and consumer discretionary (XLY, +0.68%) are today's leading sectors for the second straight day (they also both needed the bounce as their SCTR scores are lowest among all sectors)
- Defensive groups are being shunned again today as real estate (XLRE, -0.73%) lead the laggards
- Cryptocurrencies are retreating as bitcoin ($BTCUSD) falls 1.90%; etherium ($ETHUSD) is down 3.08%
- Commodities remain strong today as crude oil ($WTIC) jumps 2.4% to $67.19 per barrel; the 20-day EMA is $67.67 so this current rally is nothing sustainable....yet
- Palo Alto Networks (PANW, +19.11%) crushed quarterly revenue and EPS estimates and is enjoying a nice breakout
Market Outlook
In the very near-term, we're seeing growth stocks outperforming value stocks again. Below is a chart that features two price relative ratios. The first is the Dow Jones U.S. Small-Cap Growth Index ($DJUSGS) vs. the Dow Jones U.S. Small-Cap Value Index ($DJUSVS). The second is the iShares Russell 1000 Growth ETF (IWF), which features many of the mega large cap growth stocks like Apple (AAPL) and Microsoft (MSFT), vs. the iShares Russell 1000 Value ETF (IWD). That latter ETF is widely-diversified and includes mega large cap value stocks like Berkshire Hathaway (BRK/B) and JP Morgan (JPM). Check the recent uptick in both ratios:
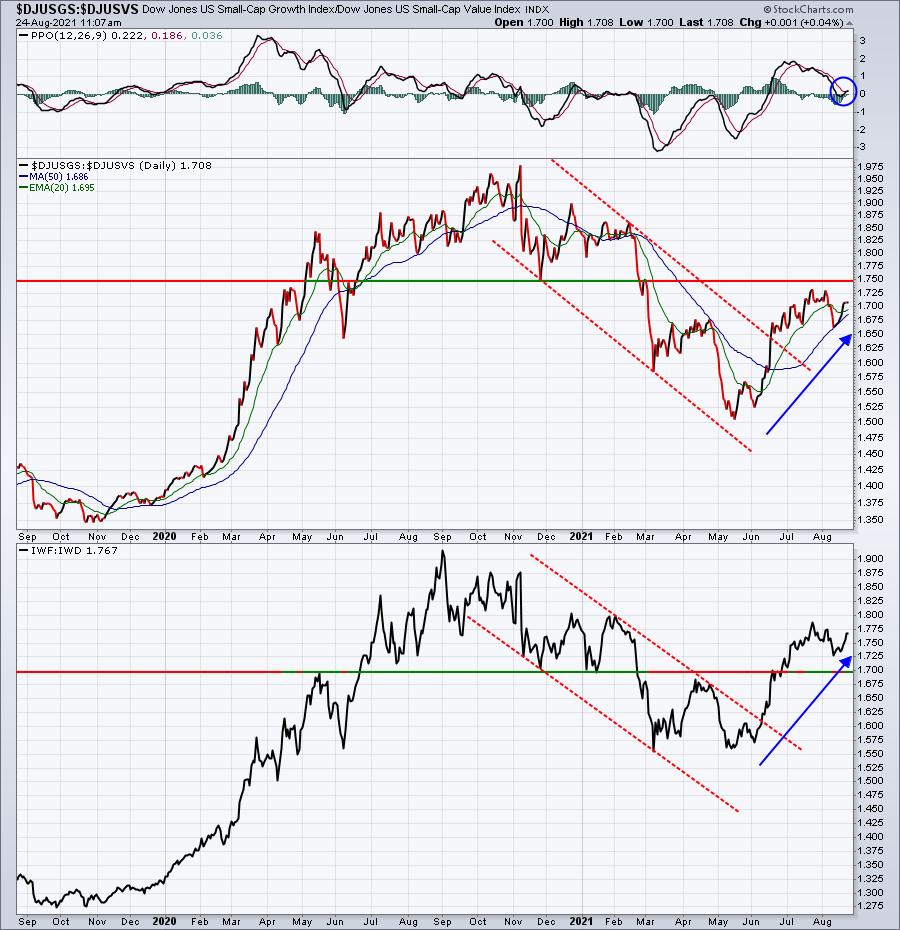
Since the release of those horrendous inflationary reports surfaced earlier in 2021, growth stocks have been carving out a relative bottom vs. value stocks. That process seems complete and now we're seeing growth stocks once again with the upper hand, especially with the 10-year treasury yield ($TNX) falling from 1.75% to 1.28%. It will be very interesting to see whether growth stocks can maintain the upper hand if the TNX begins rising again.
Sector/Industry Focus
Technical conditions continue to improve on the transportation group ($TRAN). After pulling back recently, the TRAN printed a higher low and is now trending higher again. Remember that this group loves the next few months. During the current secular bull market (since the 2013 breakout), the TRAN has averaged outperforming the S&P 500 by 4.0 percentage points from September through November. It's underperformed by 4.5 percentage points from December through August. Seasonal tailwinds should be respected here.
Here's the latest look at the long-term weekly chart:
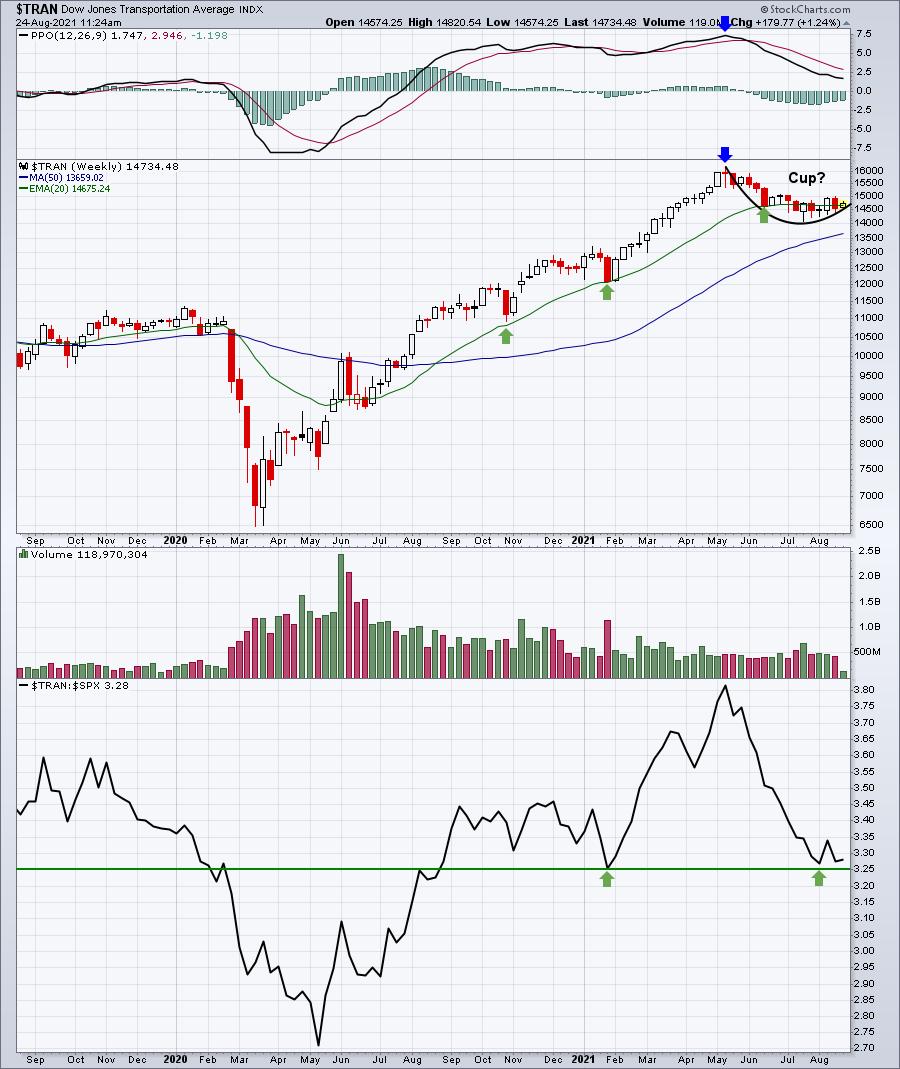
I believe the combination of (1) relative support near 3.25 in the bottom panel, (2) absolute support at the 20-week EMA, and (3) the seasonal strength reflected below is enough to overweight this group for the next few months.
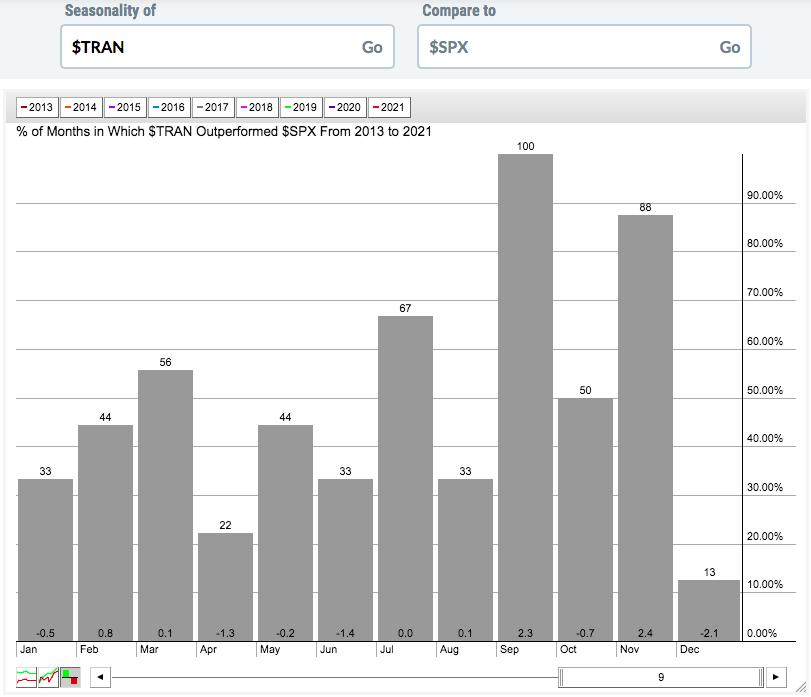
Since the bull market began, transports have outperformed the S&P 500 every year during September. It's been an impressive run and one that I wouldn't bet against given the long-term technical outlook.
ChartLists/Strategies
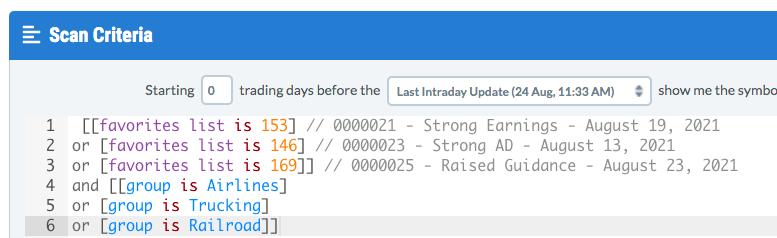
I ran a scan that scoured the Strong Earnings ChartList (SECL), Strong AD ChartList (SADCL), and Raised Guidance ChartList (RGCL) looking for any transportation stocks - based on the information I discussed above. The scan syntax and scan results were as follows:
Scan Syntax:
Scan Results:
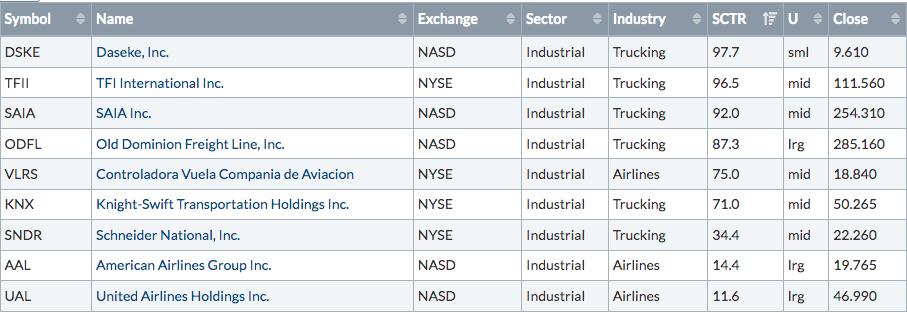
ODFL's recent breakout looks solid, so a 20-day EMA test would provide solid reward-to-risk entry. ODFL is a leader in trucking as it continues to print new relative highs.
One very interesting stock that's just beginning to strengthen, however, is SNDR:
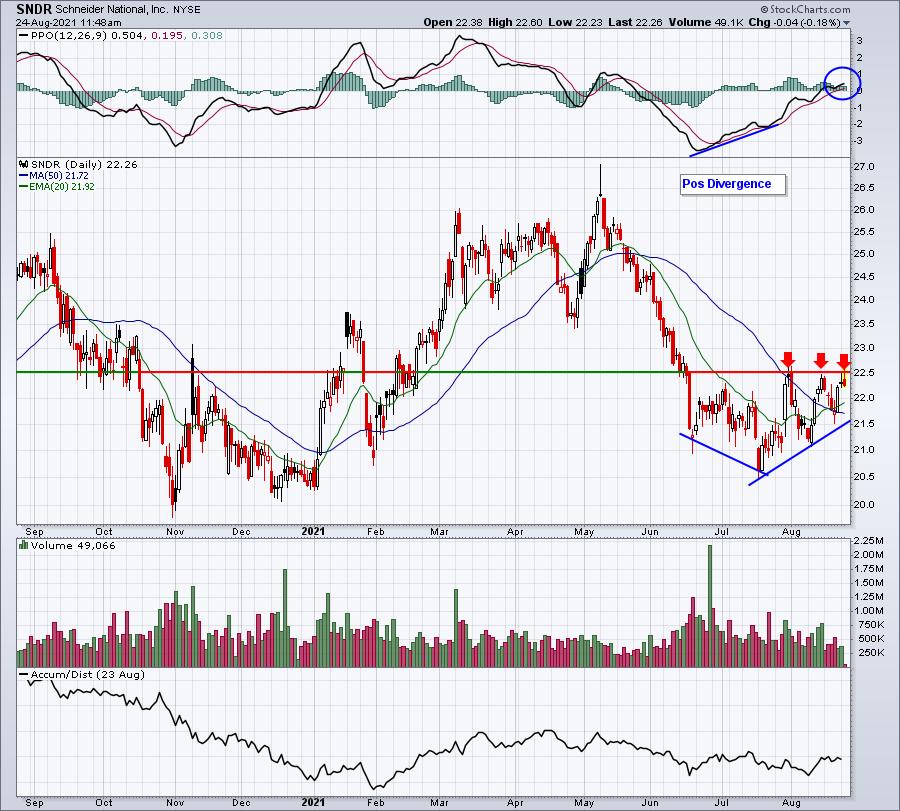
The positives are building:
- The upcoming seasonal strength in transportation stocks
- The positive divergence that printed on the recent price low (PPO higher)
- The bullish PPO centerline crossover
What I'd look for is a breakout on the daily chart above the 22.50-22.75 area. Not pictured above is the weekly chart. It's worth mentioning that SNDR's 20-week EMA and 50-week SMA are at 22.62 and 22.73, respectively. So if a significant breakout occurs on the daily chart, it will simultaneously be breaking out above key moving averages on the weekly chart. SNDR is a definitely a stock to put on a Watch List, though buying currently could prove to be premature.
Earnings Reports
Here are the key earnings reports for the next two days, featuring stocks with market caps of more than $10 billion. I also include a few select companies with market caps below $10 billion. Finally, any portfolio stocks that will be reporting results are highlighted in BOLD. If you decide to hold a stock into earnings, please understand the significant short-term risk that you are taking. Please be sure to check for earnings dates for any companies you own or are considering owning.
Tuesday, August 24:
MDT, INTU, PDD, BNS, BMO, BBY, HEI, HTHT, AAP, TOL, JWN, URBN, VNET
Wednesday, August 25:
CRM, RY, SNOW, ADSK, SPLK, ULTA, NTAP, ESTC, WSM, DKS, KC, PSTG, ATHM, BOX, SLQT, ZUO, GES
Economic Reports
July new home sales: 708,000 (actual) vs. 700,000 (estimate)
Happy trading!
Tom