
EB Daily Market Report - Monday, August 30, 2021
ChartLists Updated
The Strong Earnings ChartList (SECL) and Strong Future Earnings ChartList (SFECL) have both been updated over the weekend and they're available for viewing/download on our site.
The Raised Guidance ChartList (RGCL) is being updated currently and hopefully will be available at some point tomorrow. The EB Monthly Short Report and Seasonality Report - both for September - will be out over the next 1-2 days. I'm hopeful that I'll have updated Short Interest so that the Short Squeeze ChartList (SSCL) can be updated simultaneously. I'll keep you posted.
Executive Market Summary
- Futures were higher to open the week and strength has continued on the S&P 500 and NASDAQ
- After initial gaps higher, the Dow Jones, S&P 400 Mid Cap ($MID), and S&P 600 Small Cap ($SML) indices have all struggled on a relative basis
- Technology (XLK, +1.18%), consumer discretionary (XLY, +0.99%), and communication services (XLC, +0.80%) are leading today's rally, which is very bullish
- Financials (XLF, -1.03%) and energy (XLE, -0.39%) are the only two sectors in negative territory today
- The 10-year treasury yield ($TNX) is down 2 basis points to 1.29%, which helps to explain the XLF's weakness
- July pending home sales came were very disappointing for the second consecutive month
- Apple (AAPL, +3.22%) and Amazon.com (AMZN, +2.67%) are showing leadership
- Financial components in the Dow Jones (AXP, GS, TRV, JPM, V) are all holding back that index today
- PayPal (PYPL, +3.38%) surged midday on news that it's exploring a stock-trading platform for U.S. customers
Market Outlook
Consumer spending is a HUGE part of our GDP, estimated at roughly two-thirds of our total economy. It's the reason why I'm always so consumed by not only the performance of consumer discretionary stocks (XLY), but also, and perhaps more importantly, the relative performance of discretionary stocks vs. their consumer staples counterparts (XLP). I recently discussed the key area of short-term support on the XLY at 175 and we've seen this group bounce beautifully from this key level:
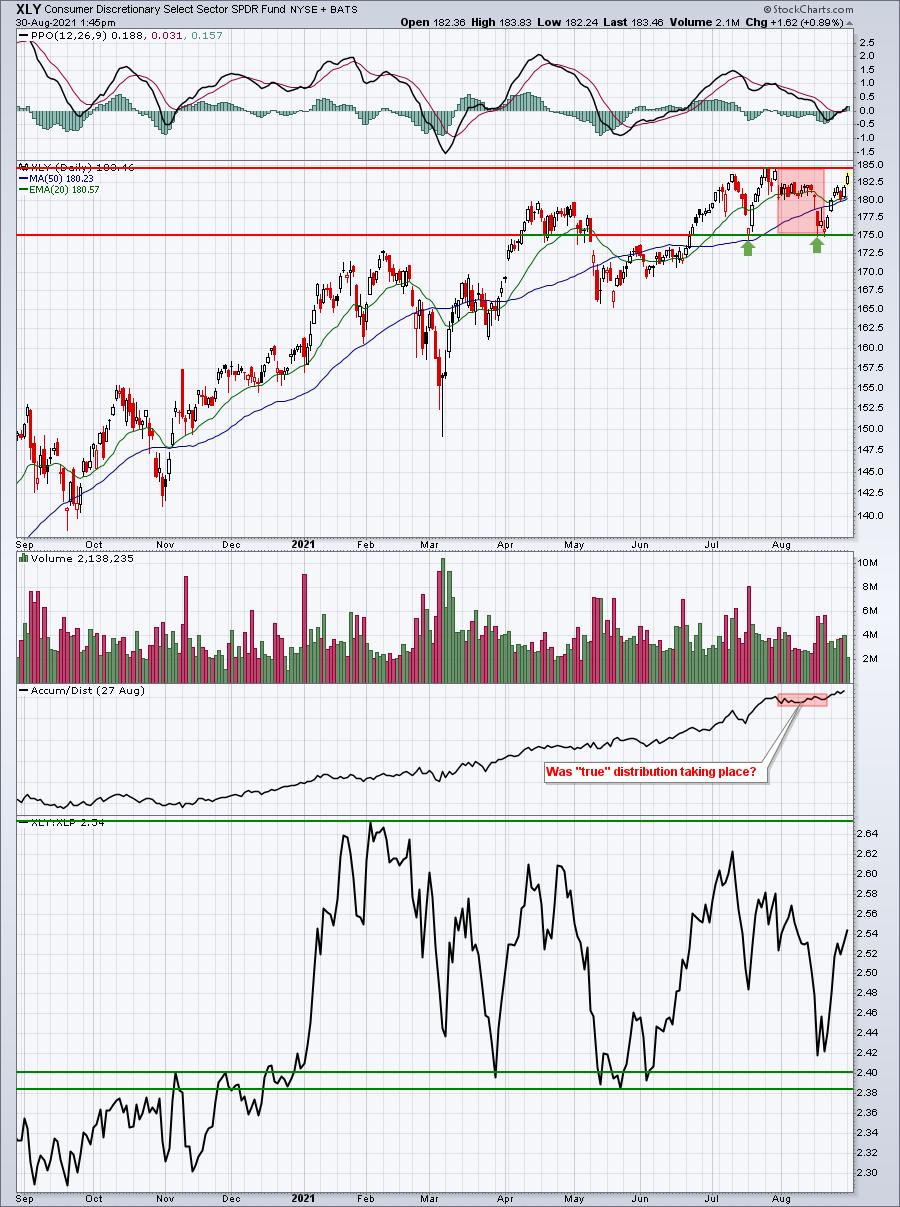
The daily PPO is just now breaking back into positive territory. It's quite likely that this uptrend and relative outperformance has just begun. Note in the bottom panel that the XLY:XLP ratio isn't going higher all the time. In fact, this ratio has been consolidating for months. There is absolutely nothing wrong with relative outperformance, followed by a lengthy period of relative consolidation. Don't read too much into a week or two of relative weakness. Rotation happens in the market everywhere.
One of the keys on this chart, however, is the AD line. While some may have been speculating that distribution was taking place as the XLY sold off from its late-July high down to the 175 level, the AD line was in no way confirming this. In fact, I'd conclude it was just the opposite. We've seen what I'd consider a bearish red-filled candle (filled candles mean the close is below the open) on the XLY only once since the late-July high - in mid-August. But even that day, we saw buying the moment 175 price support was reached.
Sector/Industry Focus
That was a really big miss on the July pending home sales earlier this morning. Despite the miss, however, home construction stocks are holding up quite well, maintaining their current uptrend with price action above the rising 20-day EMA:
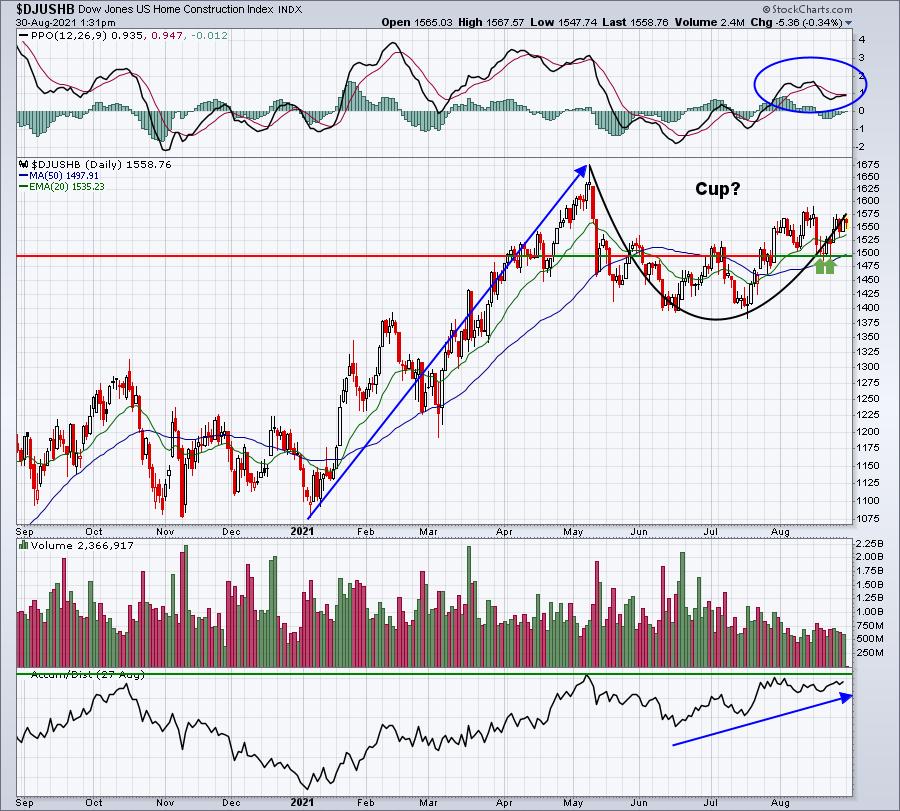
I know it's easy to be swayed by fundamental news, but this news can change from month-to-month, while the technical picture tends not to sway quite so easily. And we all should know that media reports can be particularly misleading from time to time. Always stick with the story told by the charts.
As I look at the DJUSHB, I see a strengthening AD line nearing a breakout, a PPO that remains well above centerline support, which in turn, suggests bullish momentum. I'm seeing the possible rounded bottom of a cup that's attempting to form after an uptrend. In a secular bull market, we should all be looking for bullish continuation patterns and STOP trying to predict tops. These pullbacks are our FRIENDS. The 1490-1500 area has provided us nice support recently, so I'll remain bullish the group so long as this price support level holds. If it's broken, then an objective re-evaluation should be performed.
ChartLists/Strategies
In the past week, two stocks featured here in the DMR - one a breakout (MDXG) and the other a potential breakout (SNDR) - have been excellent trades. Let's recap those before trying to find additional profitable trades:
MDXG:
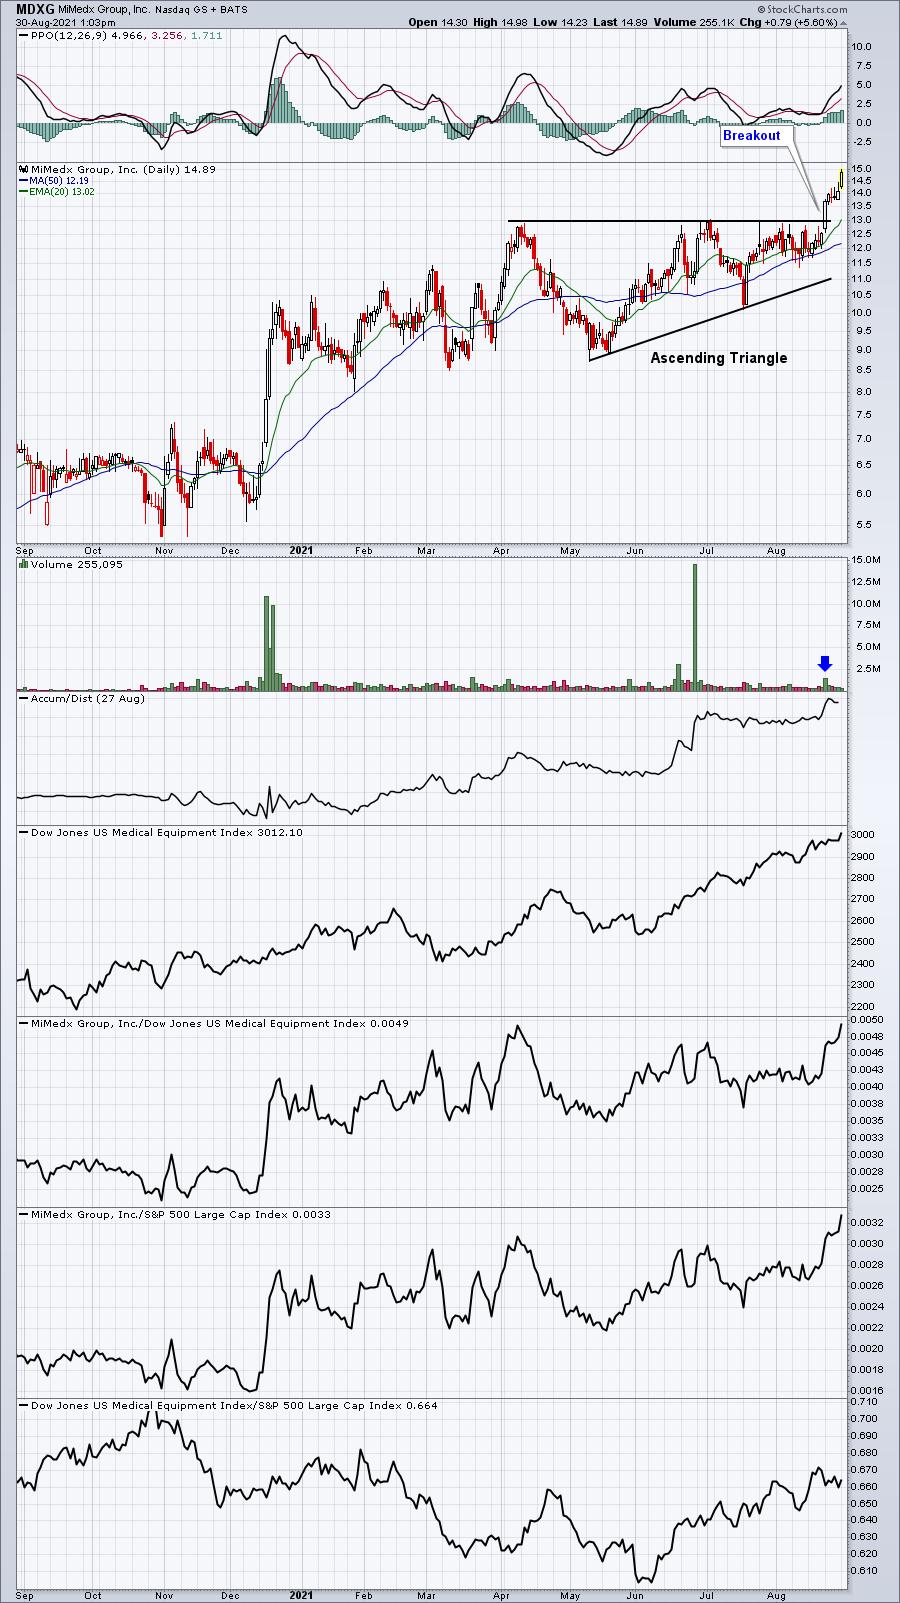
A beautiful breakout of an ascending triangle that's continued rising another 10%+ since being featured. Note the new 52-week high vs. its medical equipment peers ($DJUSAM)? I'd stick with this one at least until the pattern's measurement of 17ish is reached. We definitely could see a pullback along the way, but MDXG looks very solid.
SNDR:
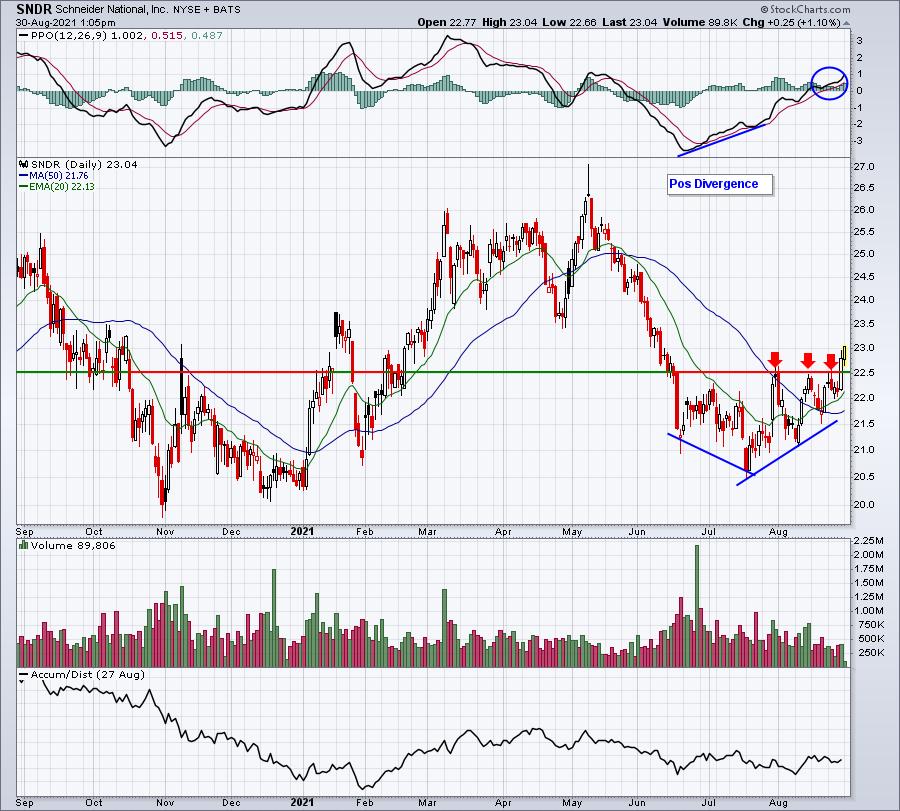
SNDR was showing initial signs of an uptrend, which followed the positive divergence that had printed. We're now getting confirmation of this new uptrend with Friday's breakout and today's additional strength. I'd now consider that rising 20-day EMA to be excellent support on any pullback and allow this stock to run. Remember, it's in the transports space ($TRAN) and September has been historically bullish for transports.
As I look at our portfolio stocks and literally hundreds of charts on our various ChartLists for additional setups, I always remind myself that not all trades will work. As technicians, we need to know where to draw lines and let stocks go to avoid big losses that can really have a major impact on portfolio performance. After scouring our ChartLists, here were 3 that I thought were worth mentioning from a technical perspective:
CVNA:
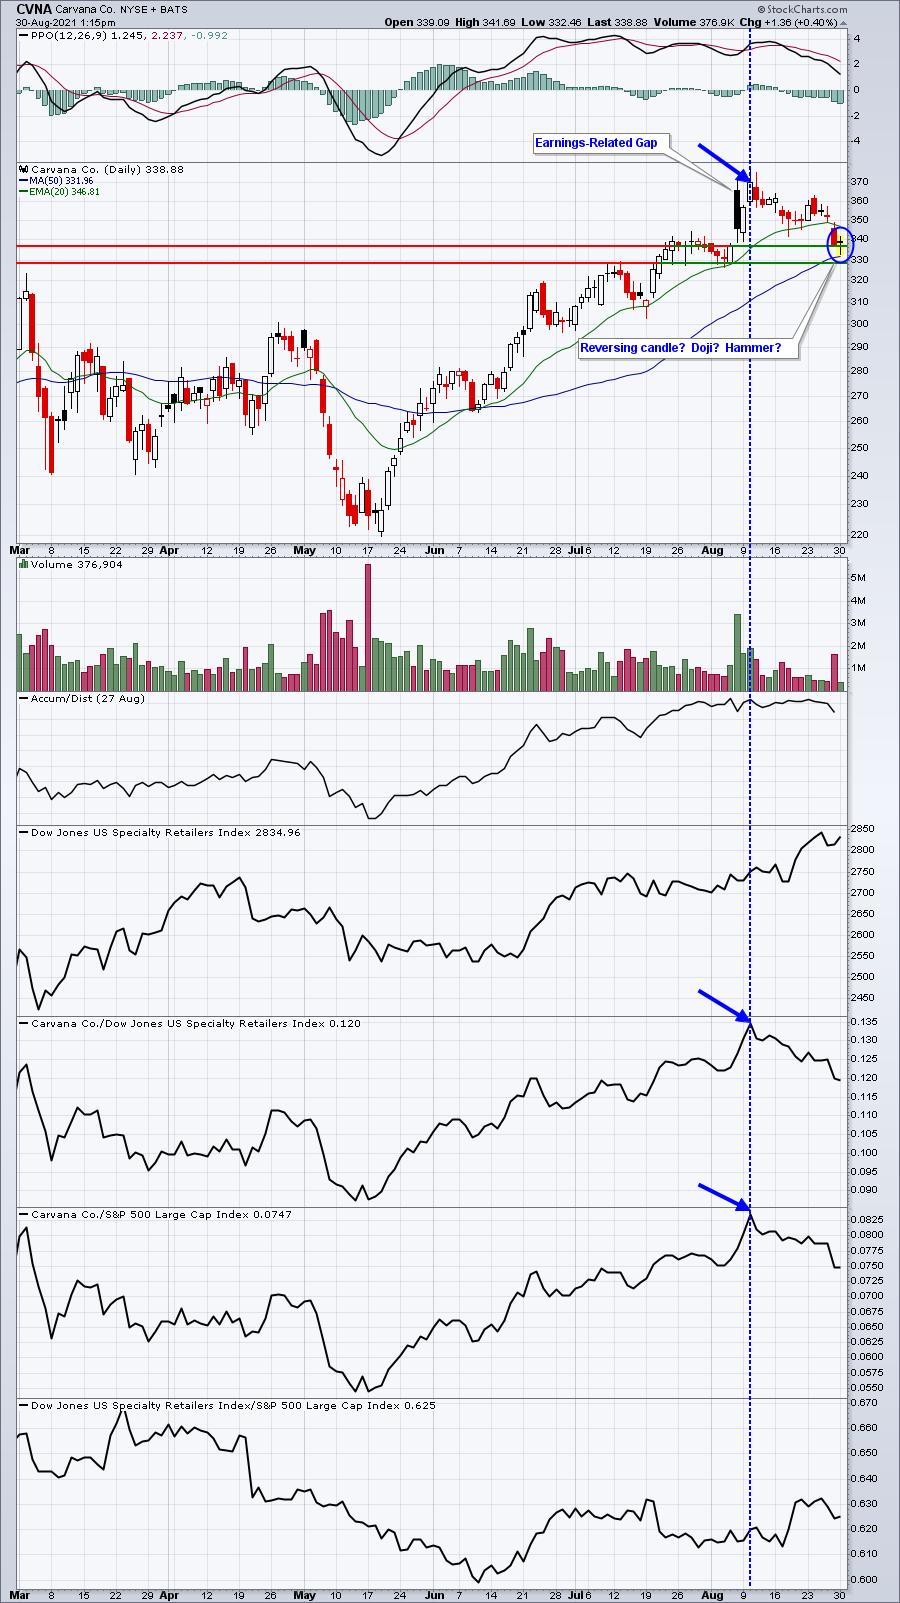
The blue-dotted horizontal line shows CVNA as a leader in its space at its most recent, POST-earnings-related gap higher. It has since sold off nearly 10% to completely fill its gap and test its 50-day SMA. Note also that the PPO is getting a much-needed centerline test. There's no guarantee that CVNA goes higher here and I'd keep a closing stop no more than 3-4% below current price, but I do like the reward to risk.
(Disclosure: I own shares of CVNA)
AN:
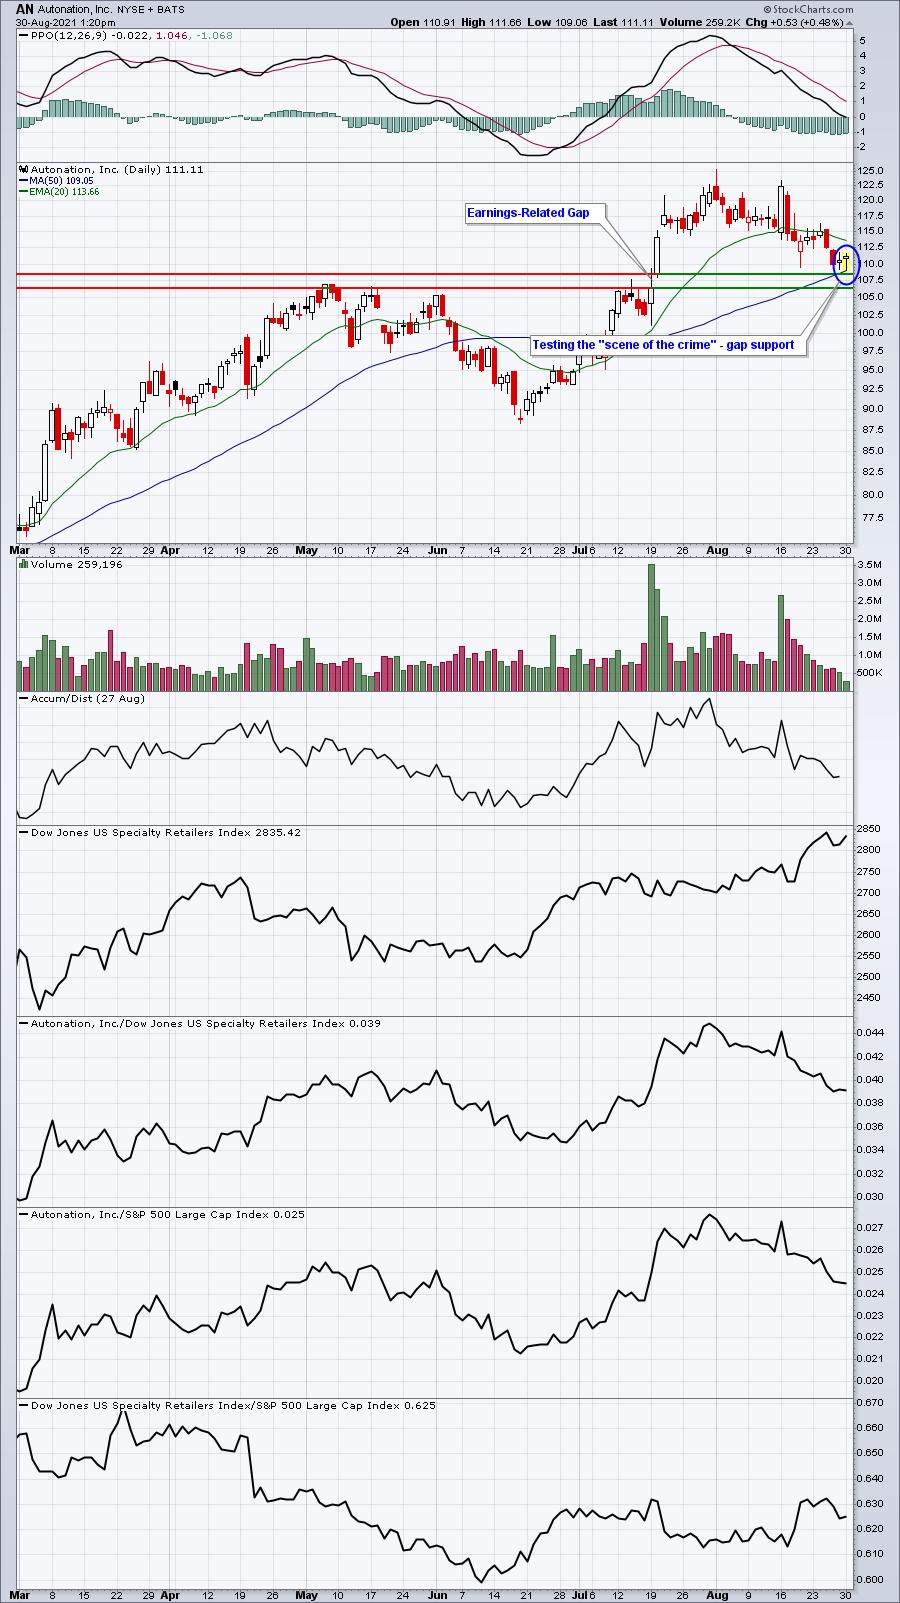
I still would rank AN's earnings report as one of the Top 10 of this past earnings season. They absolutely blew away revenue and EPS estimates and announced a $1 billion repurchase program. Instead of chasing, I believe this pullback gives us a great opportunity to enter a strong company at an excellent reward-to-risk price.
(Disclosure: I own shares of AN)
ANTM:
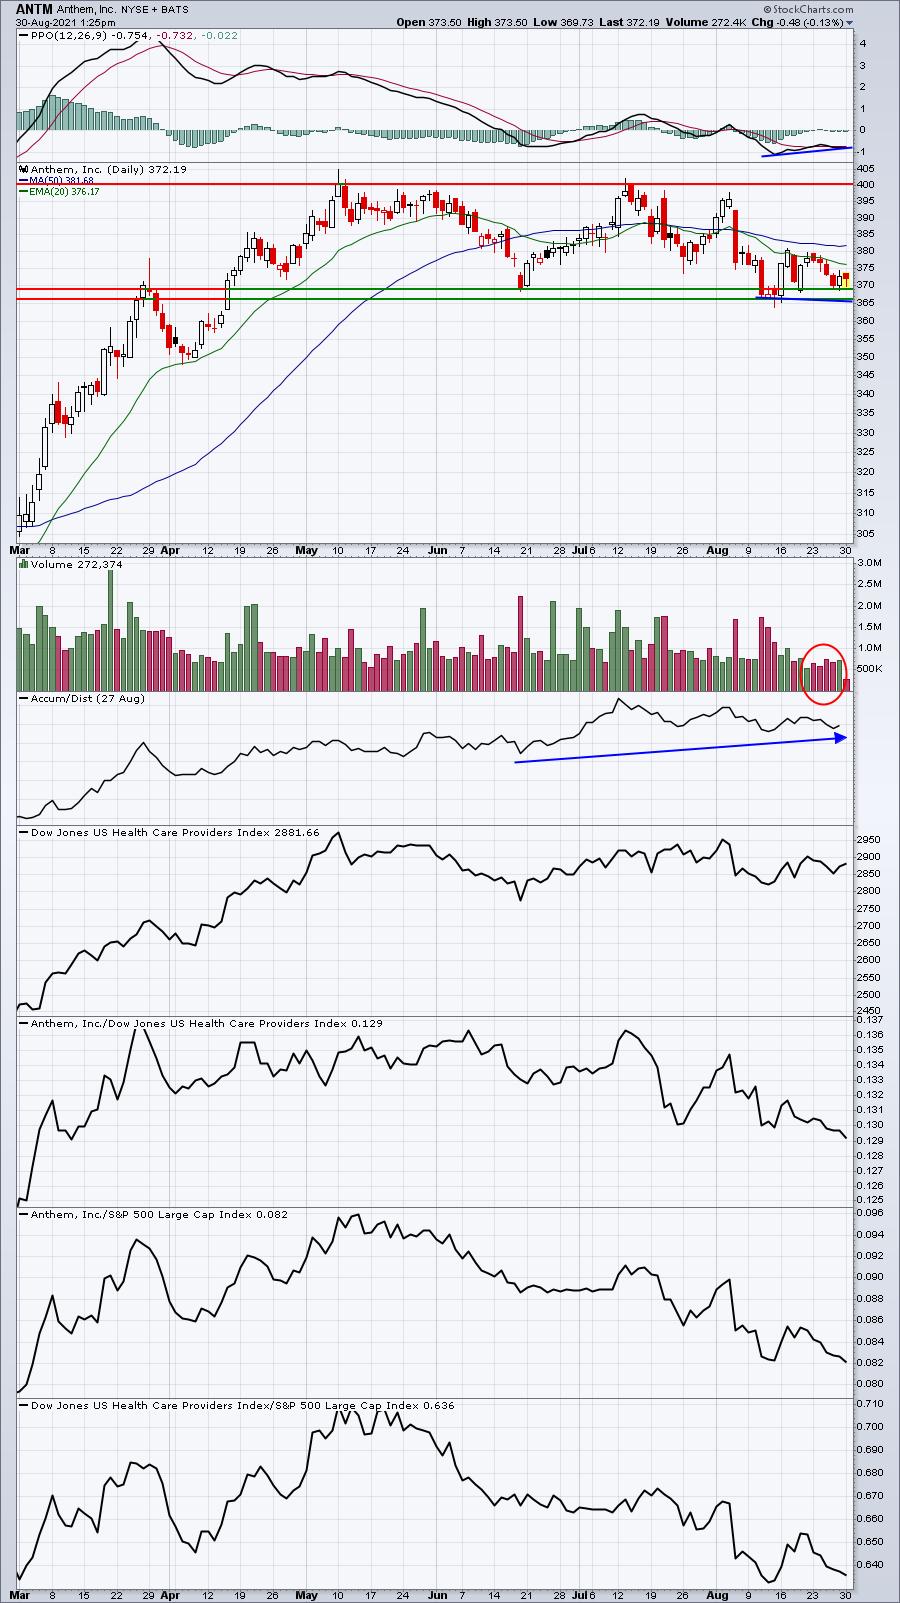
Health care (XLV) didn't perform well last week, but it's showing some strength today as the XLV bounces off its 20-day EMA. That could help to trigger some buying in ANTM. While price action hasn't been great here, ANTM's AD line has held up very well, suggesting that this recent weakness could be a signal of institutional buying. Other health care stocks have held up better, however, so I'd want to see ANTM hold the price support level in the mid-360s shown above. A test of that level would likely result in the printing of a positive divergence. I haven't initiated a position, but I'm watching this one closely.
Earnings Reports
Here are the key earnings reports for the next two days, featuring stocks with market caps of more than $10 billion. I also include a few select companies with market caps below $10 billion. Finally, any portfolio stocks that will be reporting results are highlighted in BOLD. If you decide to hold a stock into earnings, please understand the significant short-term risk that you are taking. Please be sure to check for earnings dates for any companies you own or are considering owning.
Monday, August 30:
ZM, LI, CTLT, STNE, NDSN, CLDR
Tuesday, August 31:
CRWD, NTES, PLAN, PVH, AMBA
Economic Reports
July pending home sales: -1.8% (actual) vs. +0.3% (estimate)
Happy trading!
Tom