
EB Daily Market Report - Tuesday, August 31, 2021
ChartLists Updated
The Raised Guidance ChartList (RGCL) and Short Squeeze ChartList (SSCL) have both been updated and can be viewed/downloaded at our website.
I'll do my best to send out the Short Report and Seasonality Report for September later today or sometime tomorrow.
Executive Market Summary
- Futures were fairly flat to start the day
- The NASDAQ is approaching a 5-month relative high vs. the S&P 500 as it leads once again today
- Growth stocks reside at 6-month highs relative to value stocks based on both the $DJUSGS:$DJUSVS and IWF:IWD ratios
- Crude oil ($WTIC) is down 1.2% today as energy (XLE) is flat on the session, following a very strong recent surge
- It's a bifurcated kind of day with 4 sectors higher and 7 lower; communication services (XLC, +0.59%) is today's leader
- Zoom Video Communications (ZM, -16.37%) is down significantly, despite beating top and bottom lines and lifting estimates
- Wells Fargo (WFC, -5.48%) has seen huge selling since early afternoon as reports surface that the bank could have further regulatory risks due to "pace of restitution"
Market Outlook
When I look at the market and try to determine where a pullback might take a key index like the NASDAQ 100 ($NDX), I'll typically start with an hourly chart:
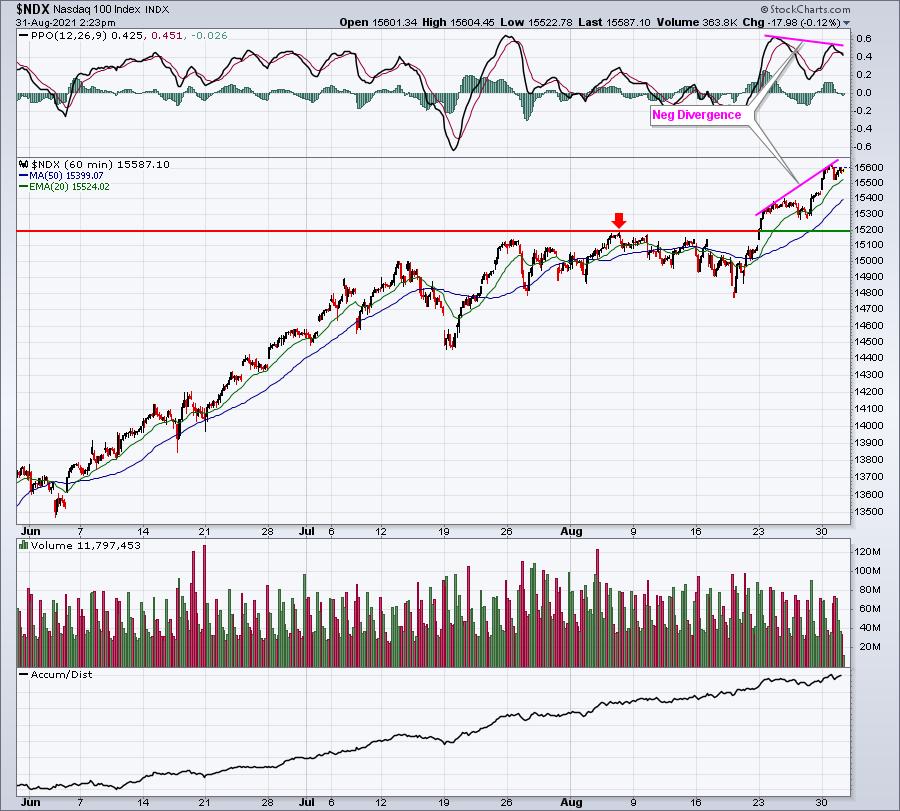
The NDX is running into a bit of a momentum issue on its hourly chart, but the daily chart (below) shows strengthening momentum. Therefore, I'd only consider a very slight pullback of 2-3% and lasting no more than 2-3 days at this point. The hourly chart shows price support near 15200. I then look to the daily chart to see if there are other reasons why this 15200 level could provide excellent support:
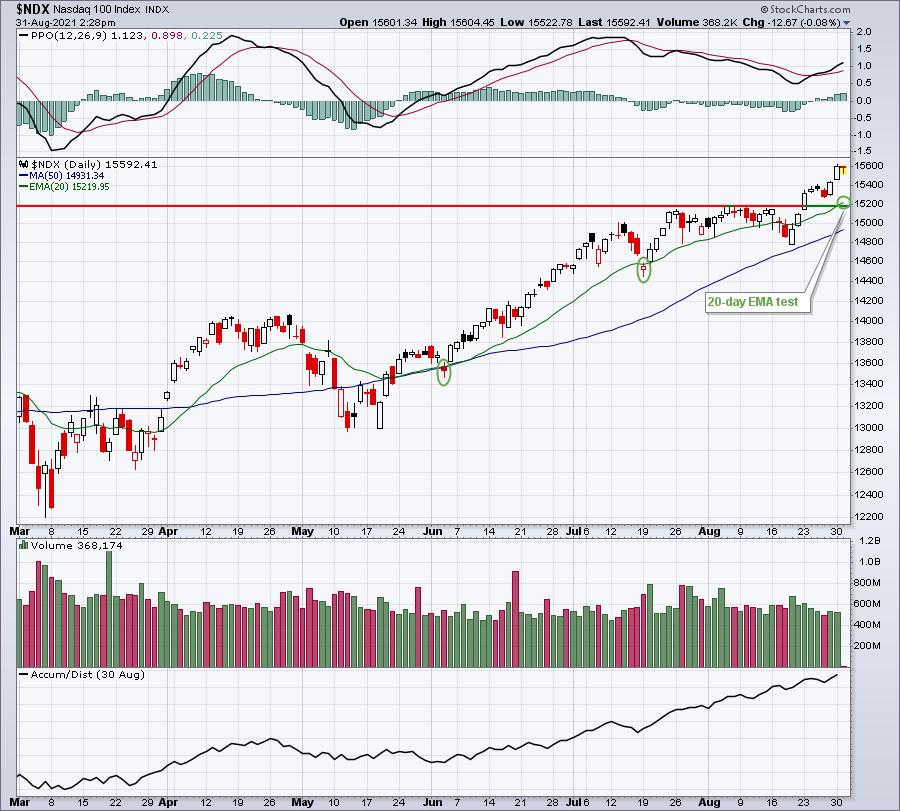
Price support at 15200 happens to coincide with that key 20-day EMA, which currently resides at 15220. So if selling were to kick in, that's the level I'd expect to see. I'm not suggesting we're going to see that selling, but it doesn't always announce ahead of time that the selling is about to begin.
Sector/Industry Focus
It's always a good idea to pull up long-term charts to gain more context. Let me give you an example. Full line insurance ($DJUSIF) has been very strong in 2021 as you can see below on this daily chart:
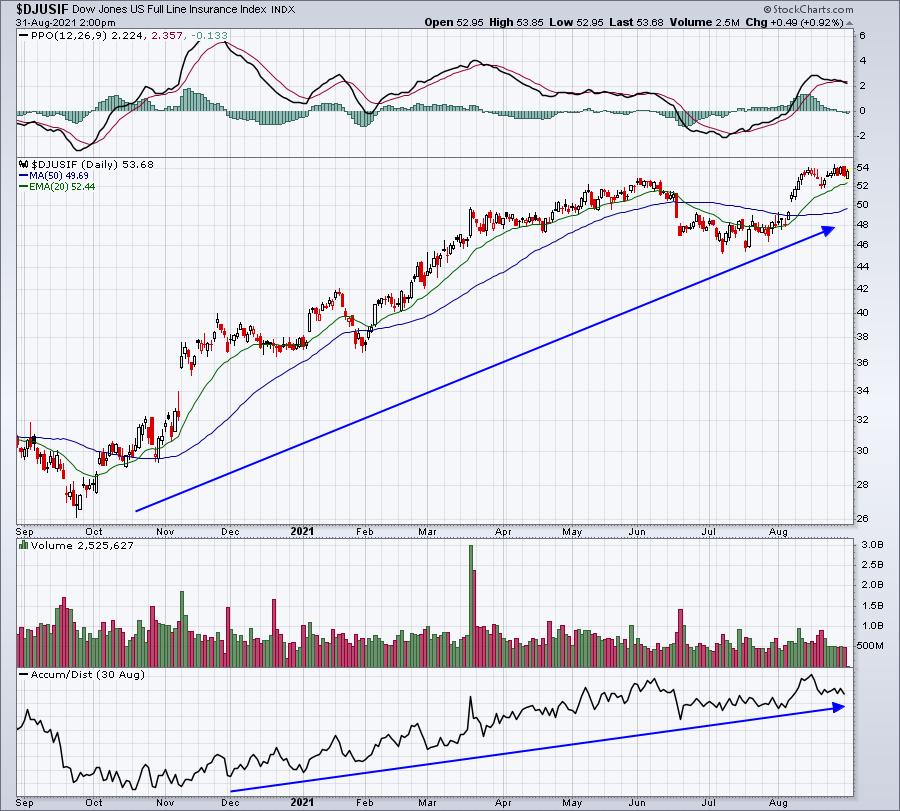
But taking another couple minutes to view the longer-term weekly chart would result in seeing this:
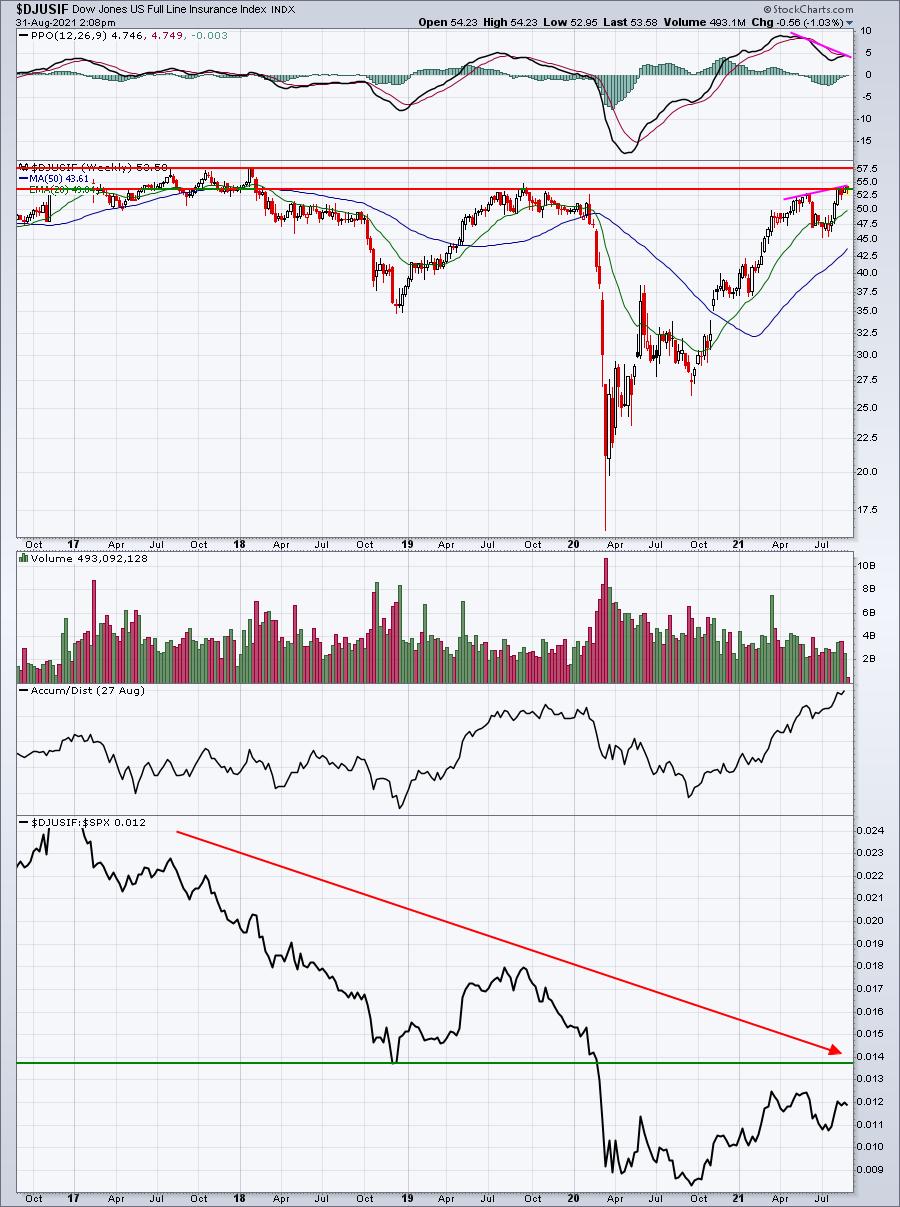
Momentum has become an issue with a negative divergence printing on the weekly chart. Worse yet, it's printing just as the DJUSIF hits key overhead resistance from highs in prior years. This doesn't mean that the DJUSIF cannot go higher, but there definitely are obstacles ahead that couldn't be seen from the daily chart.
ChartLists/Strategies
Recently, I created a "Bullish Trifecta" ChartList, which includes any stock that appears in all 3 of the following ChartLists:
- Strong Earnings ChartList (SECL)
- Strong AD ChartList (SADCL)
- Raised Guidance ChartList (RGCL)
I haven't done any formal tracking of the Bullish Trifecta ChartList, but I'd certainly expect it to produce many excellent trading candidates as each of these companies would (1) have beaten the most recent Wall Street estimates as to revenues and EPS, (2) show considerable evidence of institutional accumulation, and (3) likely require higher market valuations due to raised forecasts and higher growth. Again, this is all just theory, but I still like the idea of having one ChartList that provides me all the companies meeting these three filters.
Because I just updated the Raised Guidance ChartList (RGCL), I ran a "new" Bullish Trifecta ChartList and am including the link and password for you here, if interested:
Password: BULL2585
Earnings Reports
Here are the key earnings reports for the next two days, featuring stocks with market caps of more than $10 billion. I also include a few select companies with market caps below $10 billion. Finally, any portfolio stocks that will be reporting results are highlighted in BOLD. If you decide to hold a stock into earnings, please understand the significant short-term risk that you are taking. Please be sure to check for earnings dates for any companies you own or are considering owning.
Tuesday, August 31:
CRWD, NTES, PLAN, PVH, AMBA
Wednesday, September 1:
VEEV, CHWY, OKTA, ASAN, CPB, FIVE, NTNX, AI, SMTC, PHR
Economic Reports
June Case Shiller home price index: +1.8% (actual) vs. +1.7% (estimate)
June FHFA house price index: +1.6% (actual) vs. +1.8% (estimate)
August Chicago PMI: 66.8 (actual) vs. 69.8 (estimate)
August consumer confidence: 113.8 (actual) vs. 123.0 (estimate)
Happy trading!
Tom